

Arboviruses in North Dakota, 2003-2006
- PMID: 25487728
- PMCID: PMC4347345
- DOI: 10.4269/ajtmh.14-0291
Arboviruses in North Dakota, 2003-2006
Abstract
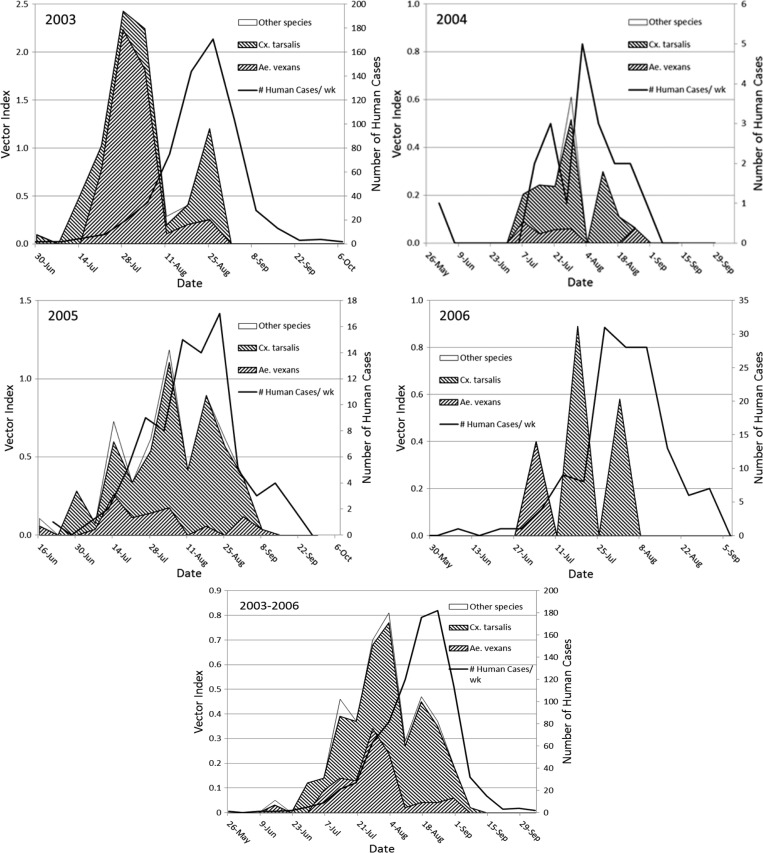
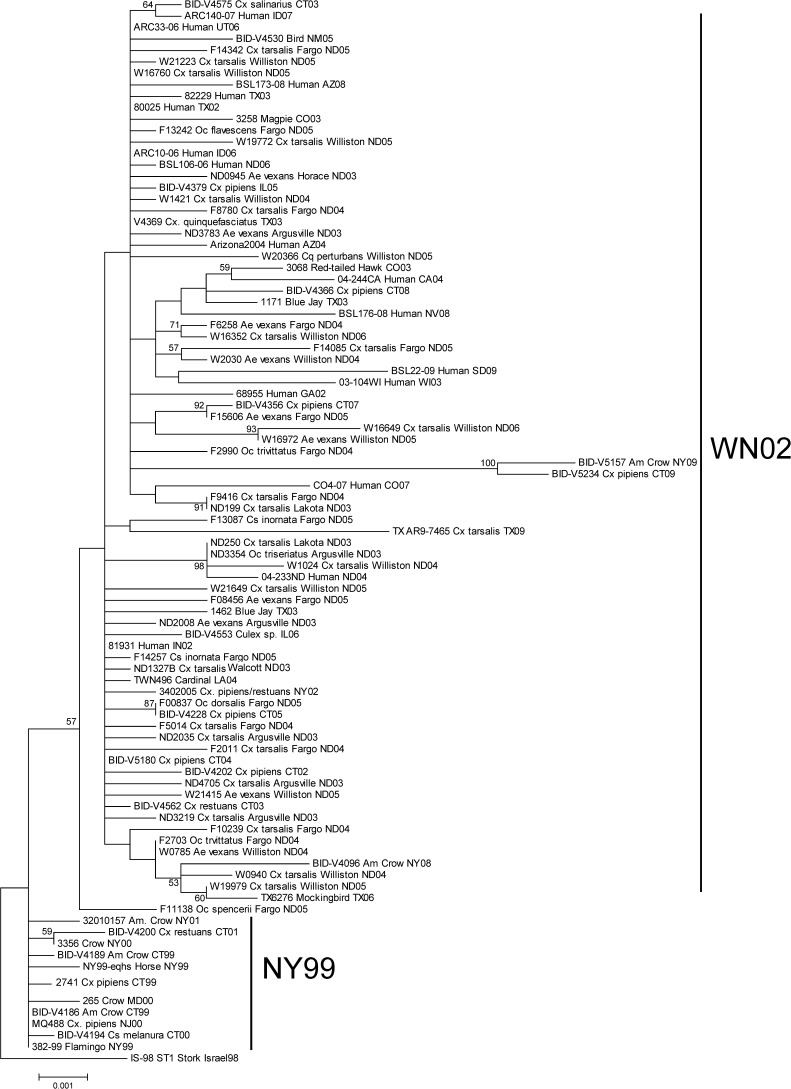
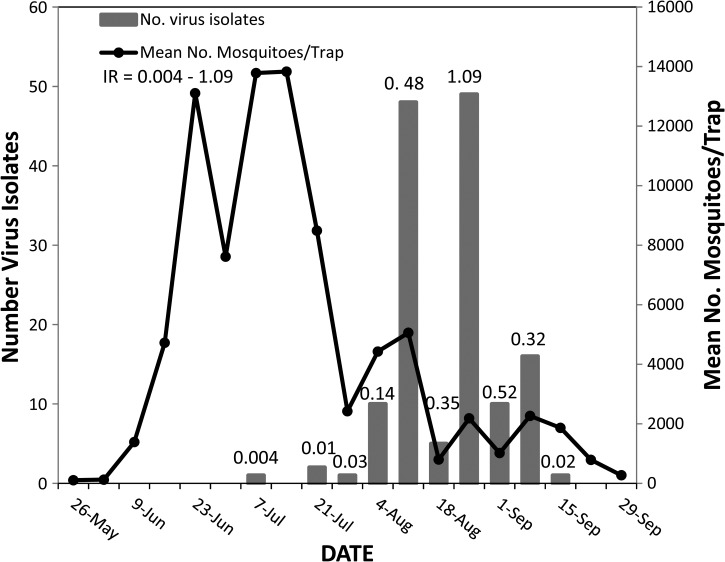
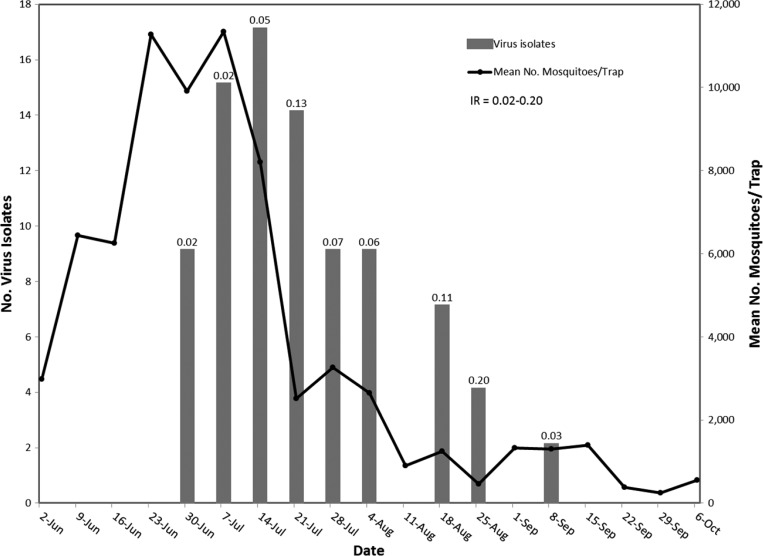
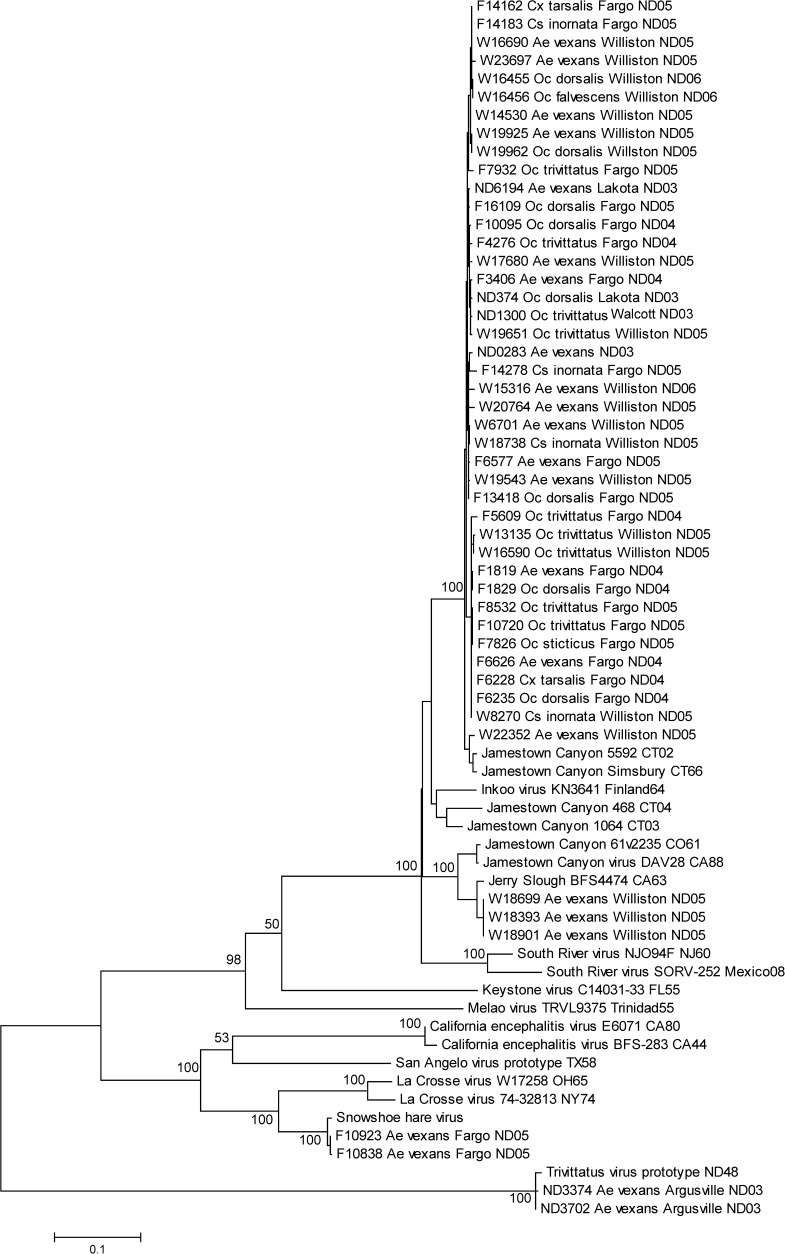
To investigate arbovirus transmission in North Dakota, we collected and screened mosquitoes for viral infection by Vero cell culture assay. Seven viruses were isolated from 13 mosquito species. Spatial and temporal distributions of the important vectors of West Nile virus (WNV), Cache Valley virus, Jamestown Canyon virus (JCV), and trivittatus virus are reported. Snowshoe hare virus, Potosi virus, and western equine encephalomyelitis virus were also isolated. The risks of Culex tarsalis and Aedes vexans transmitting WNV to humans were 61.4% and 34.0% in 2003-2006, respectively, but in 2003 when the largest epidemic was reported, risks for Ae. vexans and Cx. tarsalis in Cass County were 73.6% and 23.9%, respectively. Risk of humans acquiring an infectious bite was greatest from about the second week of July through most of August. West Nile virus sequences were of the WN02 genotype. Most JCV strains belonged to a single clade of genetically related strains. Cache Valley virus and JCV were prevalent during August and early September and during July and August, respectively.
© The American Society of Tropical Medicine and Hygiene.
Figures
References
-
- Leake JP. Epidemic of infectious encephalitis. Public Health Rep. 1941;56:1902–1905.
-
- U.S. Geological Survey West Nile virus maps. 2012. http://diseasemaps.usgs.gov/wnv_us_humans.html Available at. Accessed April 23, 2014.
-
- Karabatsos N. International Catalogue of Arboviruses Including Certain Other Viruses of Vertebrates. San Antonio, TX: American Society of Tropical Medicine and Hygiene; 1985. - PubMed
-
- Sudia WD, Chamberlain RW. Battery-operated light trap, an improved model. Mosq News. 1962;3:311–316. - PubMed
Publication types
MeSH terms
Associated data
- Actions
- Actions
- Actions
- Actions
- Actions
- Actions
- Actions
- Actions
- Actions
- Actions
- Actions
- Actions
- Actions
- Actions
- Actions
- Actions
- Actions
- Actions
- Actions
- Actions
- Actions
- Actions
- Actions
- Actions
- Actions
- Actions
- Actions
- Actions
- Actions
- Actions
- Actions
- Actions
- Actions
- Actions
- Actions
- Actions
- Actions
- Actions
- Actions
- Actions
- Actions
- Actions
- Actions
- Actions
- Actions
- Actions
- Actions
- Actions
- Actions
- Actions
- Actions
- Actions
- Actions
- Actions
- Actions
- Actions
- Actions
- Actions
- Actions
- Actions
- Actions
- Actions
- Actions
- Actions
- Actions
- Actions
- Actions
- Actions
- Actions
- Actions
- Actions
- Actions
- Actions
- Actions
- Actions
- Actions
- Actions
- Actions
- Actions
- Actions
- Actions
- Actions
- Actions
- Actions
- Actions
- Actions
- Actions
- Actions
- Actions
- Actions
Grants and funding
LinkOut - more resources
Full Text Sources
Other Literature Sources
Molecular Biology Databases
Miscellaneous
