

In vivo molecular mapping of the tumor microenvironment in an azoxymethane-treated mouse model of colon carcinogenesis
- PMID: 25487746
- PMCID: PMC4304916
- DOI: 10.1002/lsm.22309
In vivo molecular mapping of the tumor microenvironment in an azoxymethane-treated mouse model of colon carcinogenesis
Abstract
Background and objective: Development of miniaturized imaging systems with molecular probes enables examination of molecular changes leading to initiation and progression of colorectal cancer in an azoxymethane (AOM)-induced mouse model of the disease. Through improved and novel studies of animal disease models, more effective diagnostic and treatment strategies may be developed for clinical translation. We introduce use of a miniaturized multimodal endoscope with lavage-delivered fluorescent probes to examine dynamic microenvironment changes in an AOM-treated mouse model.
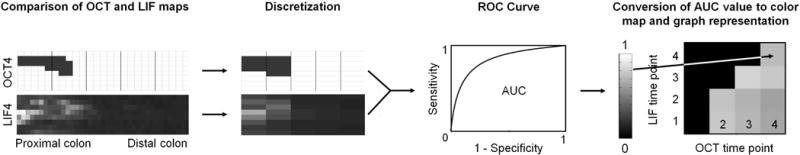
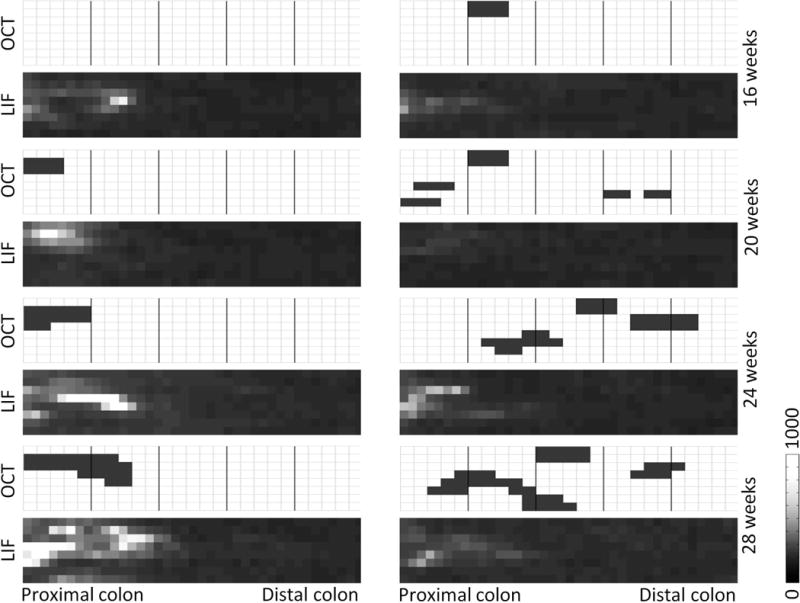
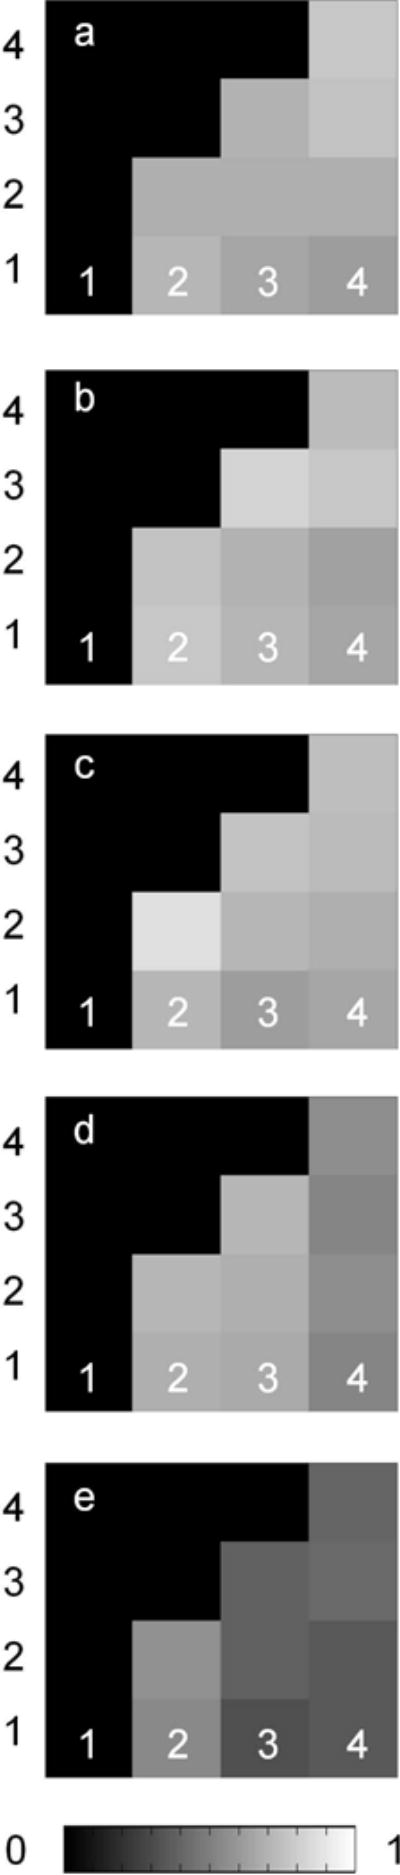
Study design/materials and methods: The endoscope is equipped with optical coherence tomography (OCT) and laser induced fluorescence (LIF) imaging modalities. It is used with Cy5.5-conjugated antibodies to create time-resolved molecular maps of colon carcinogenesis. We monitored in vivo changes in molecular expression over a five month period for four biomarkers: epithelial growth factor receptor (EGFR), transferrin receptor (TfR), transforming growth factor beta 1 (TGFβ1), and chemokine (C-X-C motif) receptor 2 (CXCR2). In vivo OCT and LIF images were compared over multiple time points to correlate increases in biomarker expression with adenoma development.
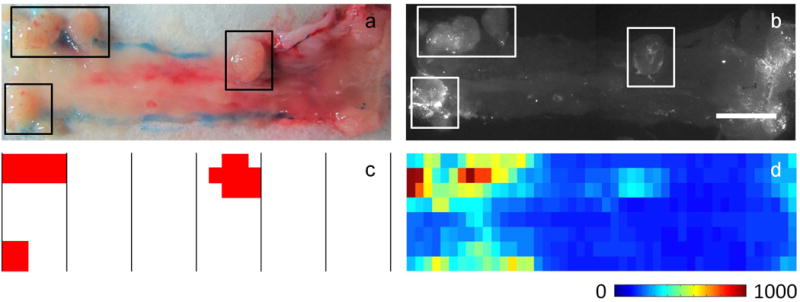
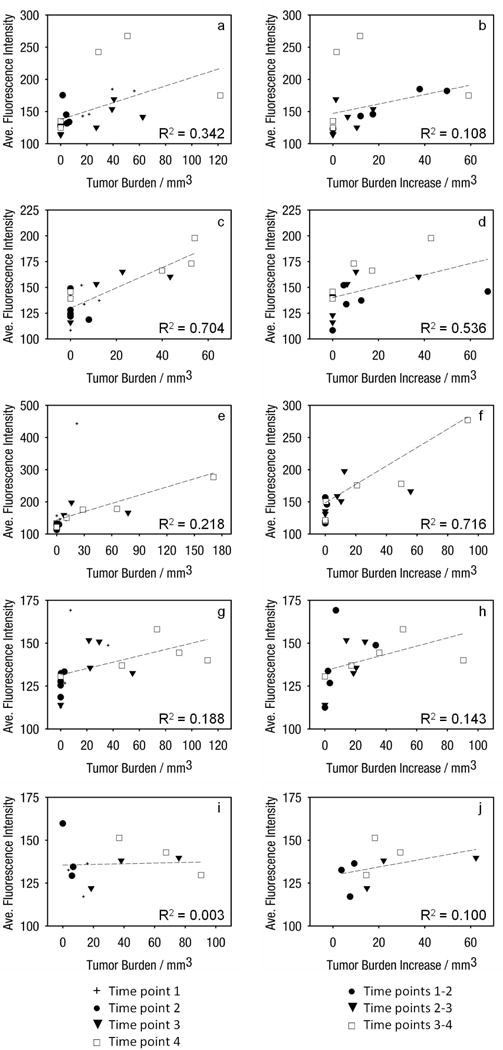
Results: This system is uniquely capable of tracking in vivo changes in molecular expression over time. Increased expression of the biomarker panel corresponded to sites of disease and offered predictive utility in highlighting sites of disease prior to detectable structural changes. Biomarker expression also tended to increase with higher tumor burden and growth rate in the colon.
Conclusion: We can use miniaturized dual modality endoscopes with fluorescent probes to study the tumor microenvironment in developmental animal models of cancer and supplement findings from biopsy and tissue harvesting.
Keywords: endoscopy; fluorescence; microenvironment; molecular imaging; optical coherence tomography.
© 2014 Wiley Periodicals, Inc.
Figures

Similar articles
-
In vivo molecular imaging of colorectal cancer using quantum dots targeted to vascular endothelial growth factor receptor 2 and optical coherence tomography/laser-induced fluorescence dual-modality imaging.J Biomed Opt. 2015;20(9):096015. doi: 10.1117/1.JBO.20.9.096015. J Biomed Opt. 2015. PMID: 26397238 Free PMC article.
-
In vivo, dual-modality OCT/LIF imaging using a novel VEGF receptor-targeted NIR fluorescent probe in the AOM-treated mouse model.Mol Imaging Biol. 2011 Dec;13(6):1173-82. doi: 10.1007/s11307-010-0450-6. Mol Imaging Biol. 2011. PMID: 21042865 Free PMC article.
-
Dual optical modality endoscopic imaging of cancer development in the mouse colon.Lasers Surg Med. 2015 Jan;47(1):30-9. doi: 10.1002/lsm.22307. Epub 2014 Dec 1. Lasers Surg Med. 2015. PMID: 25449147 Free PMC article.
-
Mouse models for the study of colon carcinogenesis.Carcinogenesis. 2009 Feb;30(2):183-96. doi: 10.1093/carcin/bgn267. Epub 2008 Nov 26. Carcinogenesis. 2009. PMID: 19037092 Free PMC article. Review.
-
Novel Approaches to Imaging Tumor Metabolism.Cancer J. 2015 May-Jun;21(3):165-73. doi: 10.1097/PPO.0000000000000111. Cancer J. 2015. PMID: 26049695 Free PMC article. Review.
Cited by
-
Diagnostic imaging advances in murine models of colitis.World J Gastroenterol. 2016 Jan 21;22(3):996-1007. doi: 10.3748/wjg.v22.i3.996. World J Gastroenterol. 2016. PMID: 26811642 Free PMC article. Review.
-
Kallikrein-Related Peptidase 6 Contributes to Murine Intestinal Tumorigenesis Driven by a Mutant Adenomatous polyposis coli Gene.Cancers (Basel). 2024 Nov 15;16(22):3842. doi: 10.3390/cancers16223842. Cancers (Basel). 2024. PMID: 39594797 Free PMC article.
-
From Crypts to Cancer: A Holistic Perspective on Colorectal Carcinogenesis and Therapeutic Strategies.Int J Mol Sci. 2024 Aug 30;25(17):9463. doi: 10.3390/ijms25179463. Int J Mol Sci. 2024. PMID: 39273409 Free PMC article. Review.
-
In vivo molecular imaging of colorectal cancer using quantum dots targeted to vascular endothelial growth factor receptor 2 and optical coherence tomography/laser-induced fluorescence dual-modality imaging.J Biomed Opt. 2015;20(9):096015. doi: 10.1117/1.JBO.20.9.096015. J Biomed Opt. 2015. PMID: 26397238 Free PMC article.
-
Time-serial Assessment of Drug Combination Interventions in a Mouse Model of Colorectal Carcinogenesis Using Optical Coherence Tomography.Cancer Growth Metastasis. 2015 Sep 7;8(Suppl 1):63-80. doi: 10.4137/CGM.S21216. eCollection 2015. Cancer Growth Metastasis. 2015. PMID: 26396545 Free PMC article.
References
-
- Roukos DH, Katsios C, Liakakos T. Genotype–phenotype map and molecular networks: a promising solution in overcoming colorectal cancer resistance to targeted treatment. Expert Rev Mol Diagn. 2010;10(5):541–545. - PubMed
-
- Fearon ER. Molecular genetics of colorectal cancer. Annu Rev Pathol Mech Dis. 2011;6:479–507. - PubMed
-
- Neufert C, Becker C, Neurath MF. An inducible mouse model of colon carcinogenesis for the analysis of sporadic and inflammation-driven tumor progression. Nat Protoc. 2007;2(8):1998–2004. - PubMed
Publication types
MeSH terms
Substances
Grants and funding
LinkOut - more resources
Full Text Sources
Other Literature Sources
Medical
Research Materials
Miscellaneous
