. 2015 Jan 23;290(4):2334-50.
doi: 10.1074/jbc.M114.605691. Epub 2014 Dec 8.

A revised mechanism for the activation of complement C3 to C3b: a molecular explanation of a disease-associated polymorphism

Affiliations

A revised mechanism for the activation of complement C3 to C3b: a molecular explanation of a disease-associated polymorphism

Elizabeth Rodriguez et al. J Biol Chem. .

Abstract

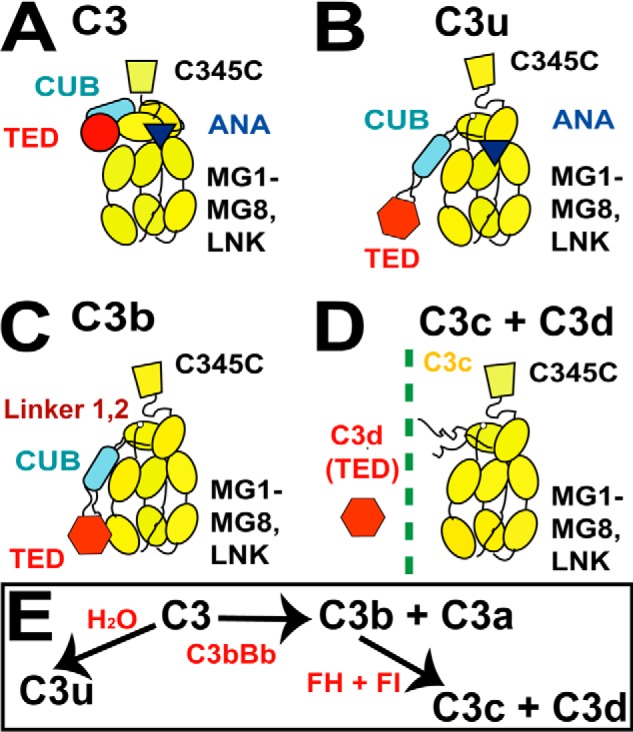
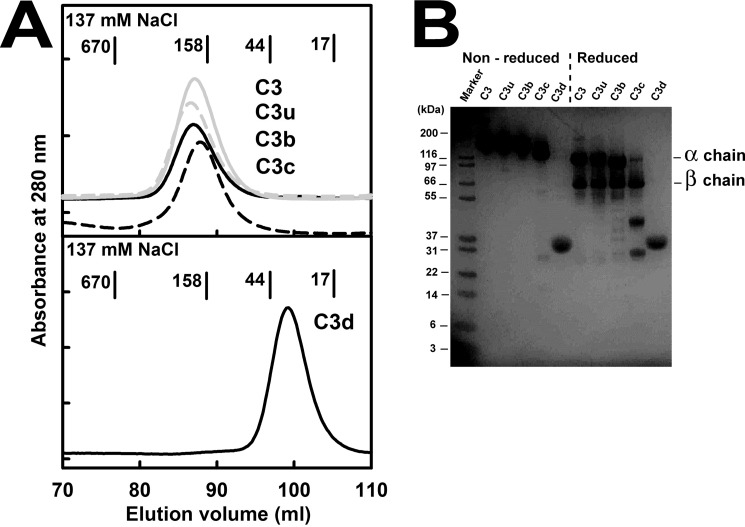
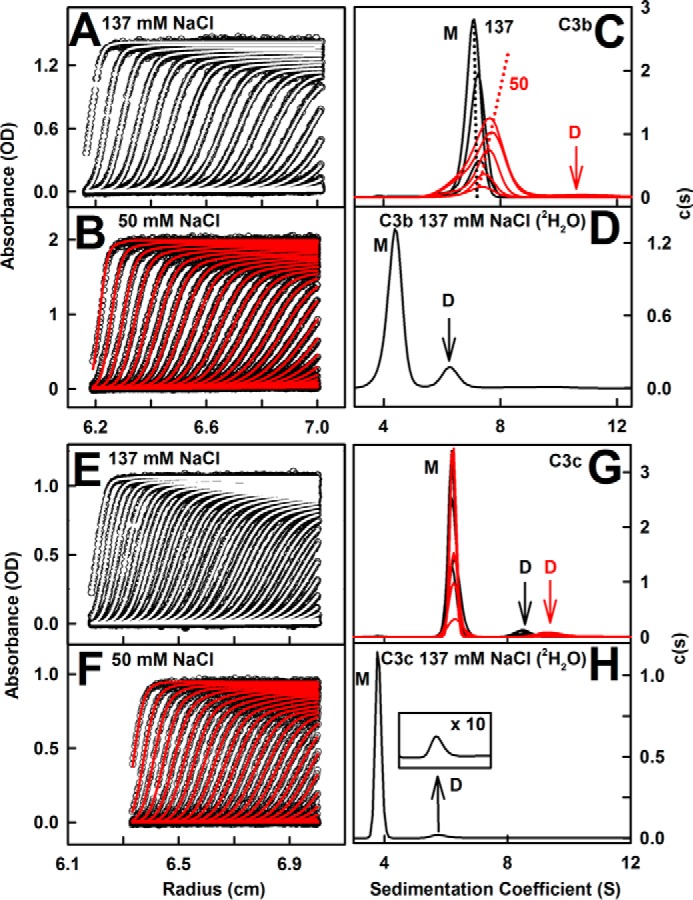
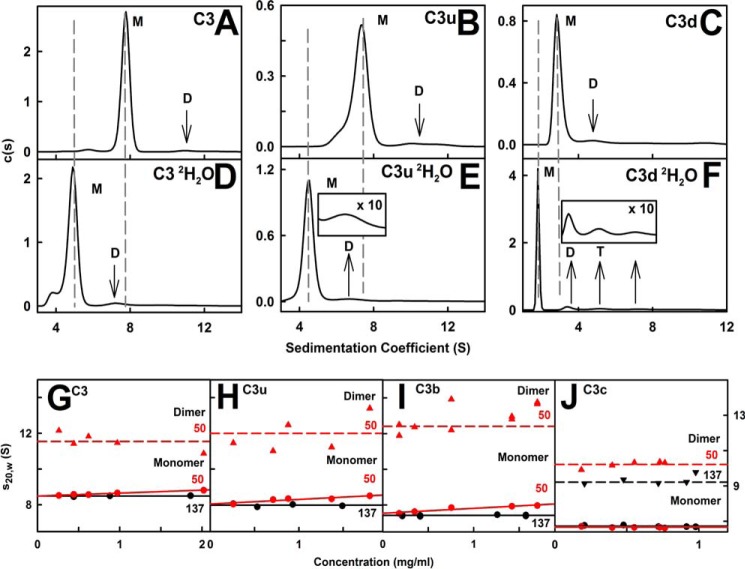
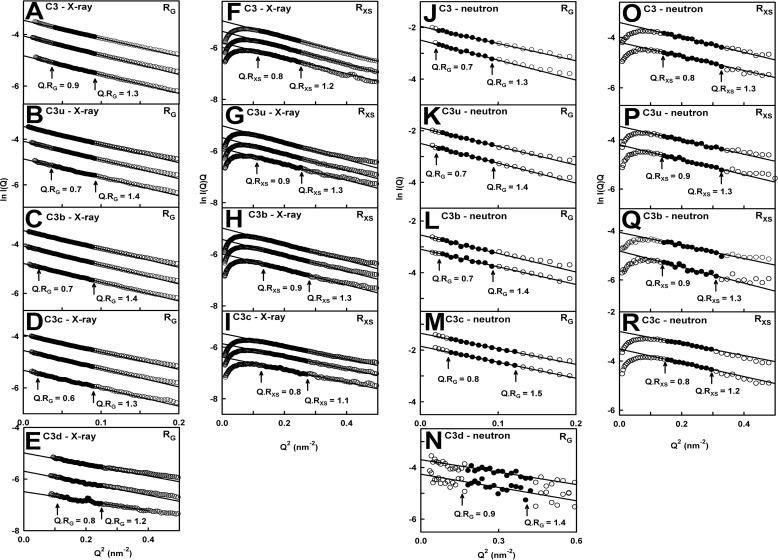
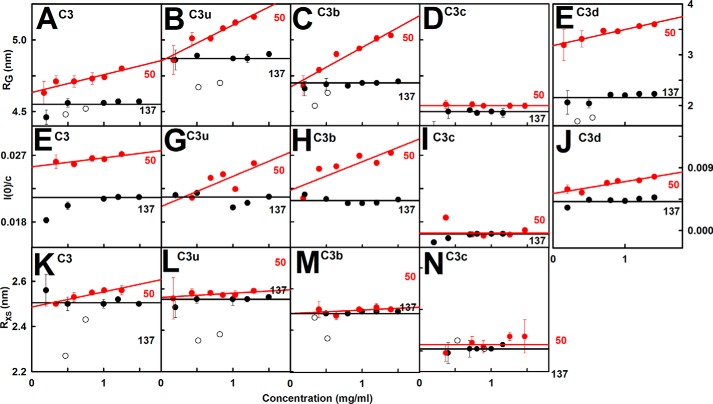
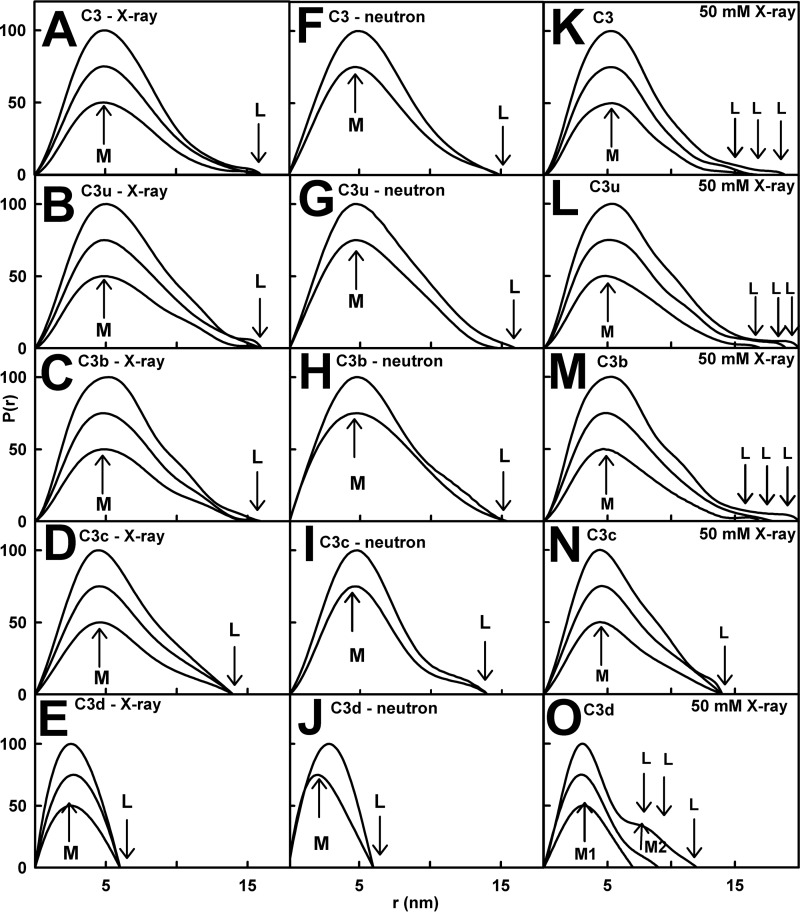
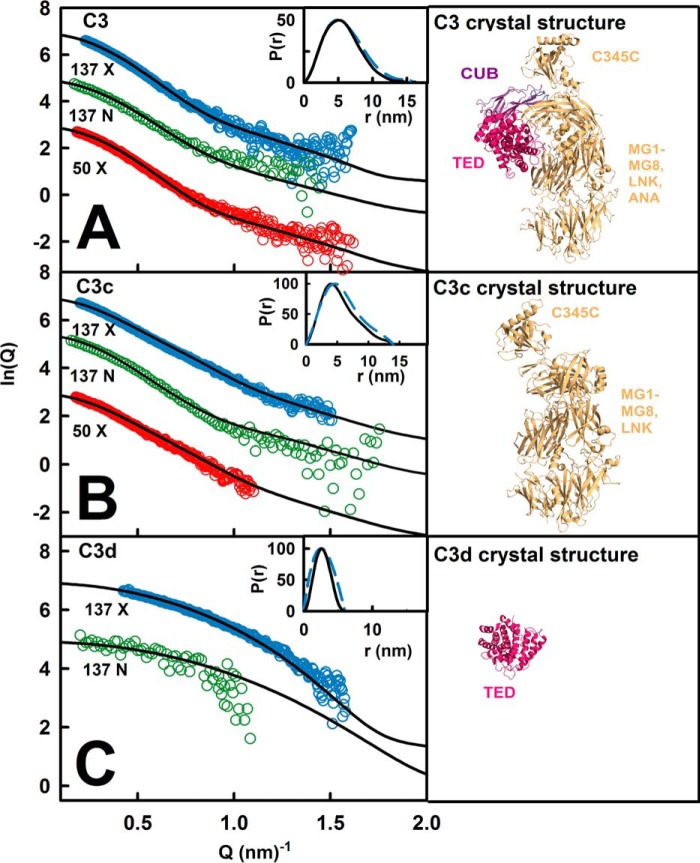
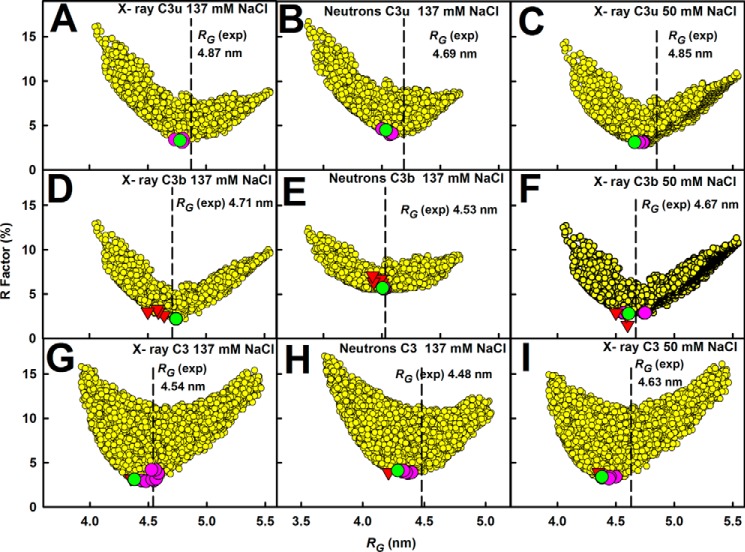
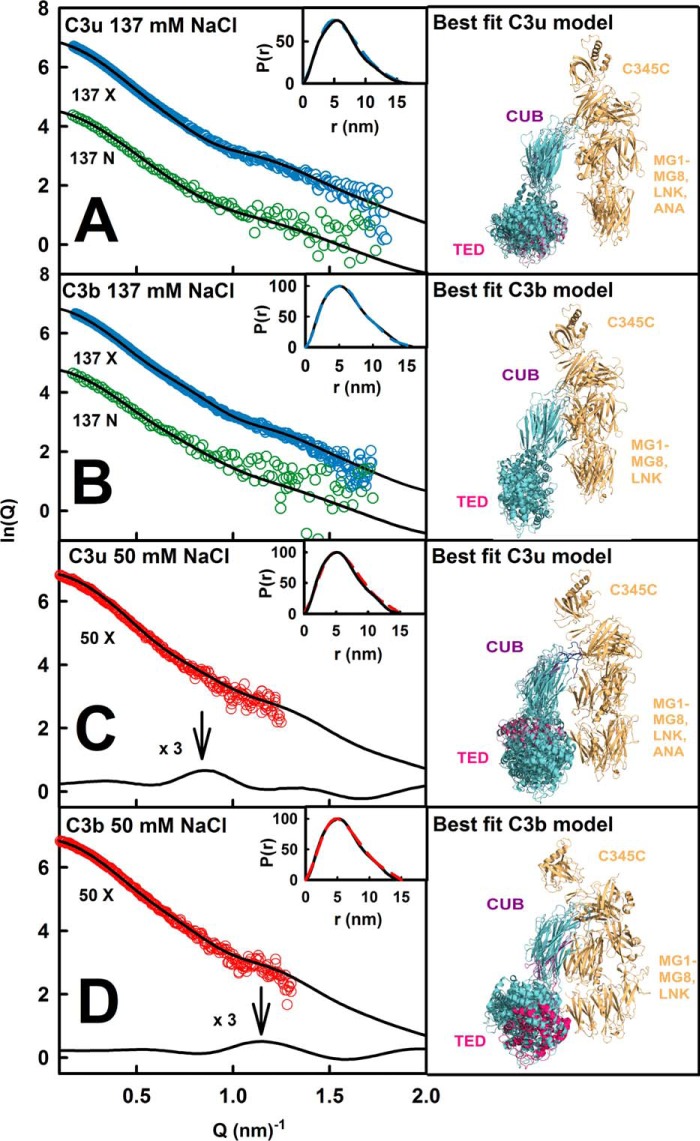
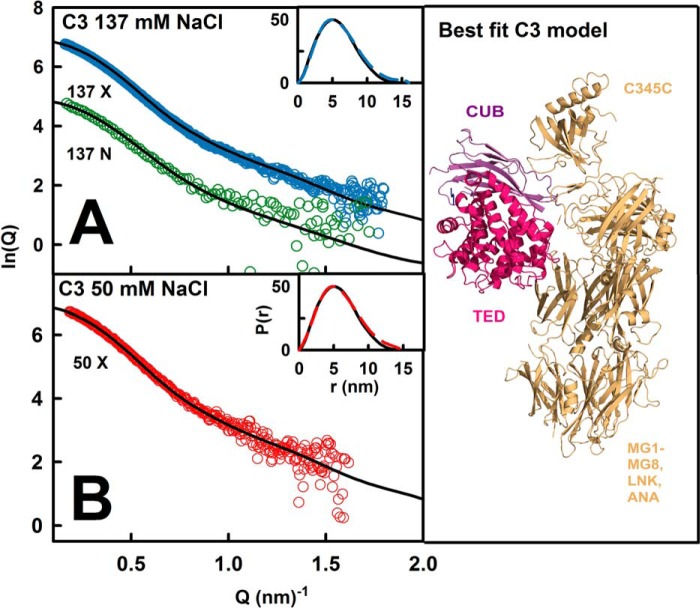
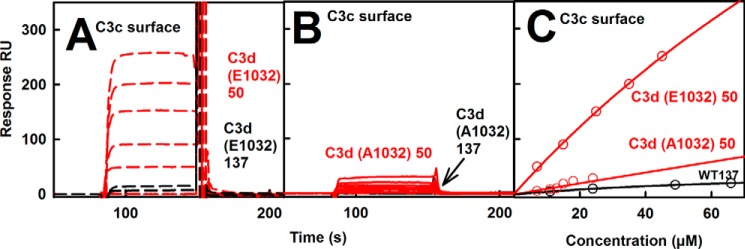
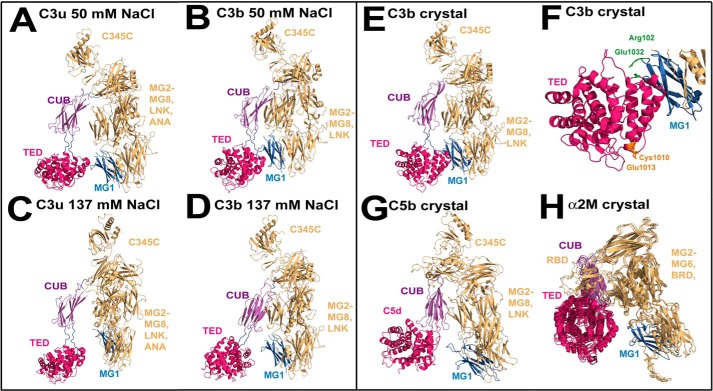
The solution structure of complement C3b is crucial for the understanding of complement activation and regulation. C3b is generated by the removal of C3a from C3. Hydrolysis of the C3 thioester produces C3u, an analog of C3b. C3b cleavage results in C3c and C3d (thioester-containing domain; TED). To resolve functional questions in relation to C3b and C3u, analytical ultracentrifugation and x-ray and neutron scattering studies were used with C3, C3b, C3u, C3c, and C3d, using the wild-type allotype with Arg(102). In 50 mm NaCl buffer, atomistic scattering modeling showed that both C3b and C3u adopted a compact structure, similar to the C3b crystal structure in which its TED and macroglobulin 1 (MG1) domains were connected through the Arg(102)-Glu(1032) salt bridge. In physiological 137 mm NaCl, scattering modeling showed that C3b and C3u were both extended in structure, with the TED and MG1 domains now separated by up to 6 nm. The importance of the Arg(102)-Glu(1032) salt bridge was determined using surface plasmon resonance to monitor the binding of wild-type C3d(E1032) and mutant C3d(A1032) to immobilized C3c. The mutant did not bind, whereas the wild-type form did. The high conformational variability of TED in C3b in physiological buffer showed that C3b is more reactive than previously thought. Because the Arg(102)-Glu(1032) salt bridge is essential for the C3b-Factor H complex during the regulatory control of C3b, the known clinical associations of the major C3S (Arg(102)) and disease-linked C3F (Gly(102)) allotypes of C3b were experimentally explained for the first time.

Keywords: Analytical Ultracentrifugation; Complement C3; Inflammation; Molecular Modeling; Neutron Scattering; Surface Plasmon Resonance (SPR); X-ray Scattering.


Figures

FIGURE 1.
FIGURE 1.
Schematic views of the five protein structures. A–D, the arrangement of the 10–13 domains of C3, C3u, C3b, and C3c depicted as schematics with the TED (red circle or hexagon), CUB (blue rectangle), and ANA (dark triangle) domains shown when present. The eight MG domains and one C345C domain are shown in yellow. E, summary of the relationship between the five forms of C3.
FIGURE 2.
FIGURE 2.
Purification of the five proteins. A, the elution profiles in 137 mm NaCl buffer of C3 (continuous gray line), C3u (dashed gray line), C3b (continuous black line), and C3c (dashed black line) are shown at the top, and that for C3d is shown at the bottom. B, non-reduced and reduced SDS-PAGE analyses of the five proteins in 137 mm NaCl buffer. The α and β chains of C3, C3u, and C3b are labeled, together with the masses of the protein markers.
FIGURE 3.
FIGURE 3.
Sedimentation distribution analyses for C3b and C3c. A and B, absorbance boundary fits for C3b in 137 and 50 mm NaCl buffers. For clarity, only every eighth absorbance boundary is shown from 200 scans. Interference data are not shown. C, the corresponding c(s) distributions for 0.2–1.57 mg/ml C3b in 137 mm NaCl (black) and 0.18–1.7 mg/ml C3b in 50 mm NaCl (red). The two dashed lines highlight the dependence of s on increasing C3b concentration (M, monomer; D, dimer). D, the c(s) distribution for 1.0 mg/ml C3b in 137 mm NaCl in PBS-2H2O. E and F, the corresponding boundary fits for C3c in 137 and 50 mm NaCl are shown. G, the c(s) distributions for 0.2–0.97 mg/ml C3c in 137 mm NaCl (black) and 0.18–0.80 mg/ml C3c in 50 mm NaCl (red). H, the c(s) distribution for 0.86 mg/ml C3c in 137 mm NaCl in PBS-2H2O.
FIGURE 4.
FIGURE 4.
Summary of the sedimentation analyses for the five proteins. A–C, the c(s) distributions for 1.72 mg/ml C3, 0.39 mg/ml C3u, and 0.55 mg/ml C3d in 137 mm NaCl buffer in H2O. D–F, the c(s) distributions for 1.62 mg/ml C3, 0.83 mg/ml C3u, and 0.91 mg/ml C3d in 137 mm NaCl in 2H2O. The monomer (M), dimer (D), and trimer/tetramer (T) peaks are labeled. The dashed lines indicate the change in the monomer s values on going from light to heavy water. G–J, the s20,w values for the four monomers of C3, C3u, C3b, and C3c in 50 mm NaCl (red) were fitted by linear regression to give the s20,w0 values. Those in 137 mm NaCl are shown as their mean. Those for dimers are shown by dashed lines. The s20,w0 values are summarized in Table 1.
FIGURE 5.
FIGURE 5.
Guinier Rg and Rxs analyses for the five proteins. A–I, in the x-ray analyses, the C3, C3u, and C3b concentrations in 137 mm NaCl buffer ranged between 0.5 and 1.5 mg/ml (from bottom to top, as shown); those for C3c ranged between 0.4 and 1.1 mg/ml; and those for C3d ranged between 0.5 and 1.4 mg/ml. The Q ranges used for the Rg fits were 0.18–0.30 nm−1 for C3; 0.14–0.30 nm−1 for C3u, C3b, and C3c; and 0.35–0.55 nm−1 for C3d. Those for the Rxs fits were 0.35–0.50 nm−1 for all four proteins. The filled circles represent the data used to determine the Rg and Rxs values. Their values were measured within satisfactory Q·Rg and Q·Rxs ranges, as shown. J–R, in the neutron analyses, the C3 concentrations were 0.75 and 0.47 mg/ml; those for C3u were 0.82 and 0.52 mg/ml; those for C3b were 0.52 and 0.34 mg/ml; those for C3c were 0.91 and 0.53 mg/ml; and those for C3d were 0.55 and 0.34 mg/ml. The D22 data sets correspond to 2H2O buffer. The Q ranges used for the Rg fits were 0.16–0.30 nm−1 for C3, C3u, and C3b; 0.2–0.35 nm−1 for C3c; and 0.4–0.6 nm−1 for C3d. Those for the Rxs fits were 0.35–0.50 nm−1 for all four proteins. The filled circles represent the data used to determine the Rg and Rxs values.
FIGURE 6.
FIGURE 6.
Concentration dependence of the Guinier values. Each x-ray value is the mean of four measurements. The neutron values from D22 correspond to single measurements. A–E, x-ray Rg values are shown for 137 mm (black) and 50 mm NaCl (red) buffers. The pairs of open symbols correspond to the neutron Rg values. For 137 mm NaCl, the line denotes the mean value. For 50 mm NaCl, linear regression gave the mean ± S.D. F–J, corresponding x-ray I(0)/c analyses. K–N, corresponding x-ray and neutron Rxs values.
FIGURE 7.
FIGURE 7.
Distance distribution functions P(r) for the five proteins. A–E, for C3, C3u, and C3b in 137 mm NaCl by x-rays, the maximum M is at 5.0 nm; M for C3c is at 4.5 nm; and M for C3d is at 2.5 nm. For C3, C3u, and C3b, the maximum length L is at 16 nm; L for C3c is at 14 nm; and L for C3d is at 7 nm. F–J, the neutron data in 137 mm NaCl showed similar M and L values for the five proteins. K–O, the x-ray data in 50 mm NaCl showed L values for C3 of 15 nm (0.5 mg/ml), 16 nm (0.8 mg/ml), and 19 nm (1.25 mg/ml). For C3u, the L values increased from 16 to 20 nm between 0.17 and 1.29 mg/ml. For C3b, the L values increased from 17 to 20 nm between 0.4 and 1.40 mg/ml. For C3c, the L values of 14 nm were unchanged between 0.16 and 1.25 mg/ml. C3d showed L values of 6 nm (0.15 mg/ml), 9 nm (0.5 mg/ml), and 12 nm (1.41 mg/ml) and two peaks denoted M1 and M2 at 1.41 mg/ml.
FIGURE 8.
FIGURE 8.
Scattering curve fits using the C3, C3c, and C3d crystal structures. A, the three experimental curves for C3 (concentrations of 0.73–1.49 mg/ml) are shown in circles, and the black line is based on the C3 crystal structure. B, the experimental curves for C3c (1.01–1.16 mg/ml) are shown in circles, and the black line is based on the C3c crystal structure. C, the experimental curves for C3d/TED (0.50–0.59 mg/ml) are shown in circles, and the black line is based on the C3d crystal structure.
FIGURE 9.
FIGURE 9.
Constrained modeling of C3u, C3b, and C3 in three buffers. The R-factors for the 4650 conformationally randomized models for C3u (A–C) and C3b (D–F) and 8000 randomized models for C3 (G–I) are compared with their corresponding Rg values. The three buffers were 137 mm NaCl in light water for x-rays (A, D, and G); 137 mm NaCl in heavy water for neutrons (B, E, and H); and 50 mm NaCl in light water for X-rays (C, F, and I). In each panel, the vertical dashed line corresponds to the experimental Rg value. The R-factors for the 10 best fit models are shown in pink, and the best fit of these is shown in green. The R-factors for the C3b and C3 crystal structures are denoted by inverted red triangles in D–I.
FIGURE 10.
FIGURE 10.
Scattering modeling fits for C3u and C3b in three buffers. A, the x-ray and neutron fits for C3u at 0.82–1.0 mg/ml in 137 mm NaCl buffer in light and heavy water are shown in blue and green, respectively. B, the x-ray and neutron fits for C3b at 0.52–1.0 mg/ml in 137 mm NaCl buffer in light and heavy water are shown in blue and green, respectively. C, the C3u x-ray curve in 50 mm NaCl buffer in light water was extrapolated to zero concentration. Subtraction of the fitted C3u x-ray curve in 137 mm NaCl buffer revealed a peak at 0.86 nm−1. D, the C3b x-ray curve in 50 mm NaCl buffer in light water was extrapolated to zero concentration. Subtraction of the fitted C3b x-ray curve in 137 mm NaCl buffer revealed a peak at 1.14 nm−1. The insets show the experimental (continuous) and modeled (dashed) x-ray P(r) curves. The right-hand panels show the 4–6 x-ray best fitted superimposed structures in the same orientation as Fig. 1, with the best fit TED domain shown in crimson.
FIGURE 11.
FIGURE 11.
Scattering modeling fits for C3 in three buffers. A, the x-ray and neutron fits for C3 at 0.75–1.2 mg/ml in 137 mm NaCl buffer in light and heavy water are shown in blue and green, respectively. B, x-ray fit for C3 in 50 mm NaCl buffer in light water extrapolated to zero concentration. C, the best fit C3 structure is shown. For more details, see the legend to Fig. 8.
FIGURE 12.
FIGURE 12.
Analysis of the Arg102–Glu1032 salt bridge using surface plasmon resonance. A and B, wild type C3d (E1032) and mutant C3d (A1032) analytes were injected over amine-coupled immobilized C3c as ligand in 50 mm NaCl (red) and 137 mm NaCl (black) buffers. C, corresponding KD fits for 50 mm NaCl (red) and 137 mm NaCl (black). C3d (E1032) gave a KD value of 51 μm in 50 mm NaCl buffer.
FIGURE 13.
FIGURE 13.
Structures of C3b and C3u in 50 mm and 137 mm NaCl buffers. A and B, best fit solution structures for C3u and C3b in 50 mm NaCl show that the TED (crimson) and MG1 (blue) domains are close to each other. C and D, best fit solution structures for C3u and C3b in 137 mm NaCl show that the TED (crimson) and MG1 (blue) domains have separated in this buffer. E, the C3b structure crystallized in 50 mm NaCl is similar to those in A and B. F, salt bridge interaction at Arg102 (MG1; blue) and Glu1032 (TED; crimson) is shown in green. The thioester (Cys1010 and Glu1013) is shown in orange. G and H, crystal structures for C5b in its complex with C6 (not shown) and the four superimposed monomers of active α2-macroglobulin. In these structures, the TED (crimson) and MG1 (blue) domains are also separated.

References

    1. Walport M. J. (2001) Complement: first of two parts. N. Engl. J. Med. 344, 1058–1066 - PubMed
    1. Law S. K. A., Reid K. B. M. (1995) Complement, 2nd Ed., IRL Press, Oxford
    1. Winters M. S., Spellman D. S., Lambris J. D. (2005) Solvent accessibility of native and hydrolyzed human complement protein 3 analyzed by hydrogen/deuterium exchange and mass spectrometry. J. Immunol. 174, 3469–3474 - PubMed
    1. Gros P., Milder F. J., Janssen B. J. (2008) Complement driven by conformational changes. Nat. Rev. Immunol. 8, 48–58 - PubMed
    1. Delanghe J. R., Speeckaert R., Speeckaert M. M. (2014) Complement C3 and its polymorphism: biological and clinical consequences. Pathology 46, 1–10 - PubMed

Publication types

LinkOut - more resources