. 2015 Jan 16;290(3):1850-60.
doi: 10.1074/jbc.M114.620211. Epub 2014 Dec 8.

Transcription factors GATA4 and HNF4A control distinct aspects of intestinal homeostasis in conjunction with transcription factor CDX2

Affiliations

Transcription factors GATA4 and HNF4A control distinct aspects of intestinal homeostasis in conjunction with transcription factor CDX2

Adrianna K San Roman et al. J Biol Chem. .

Abstract

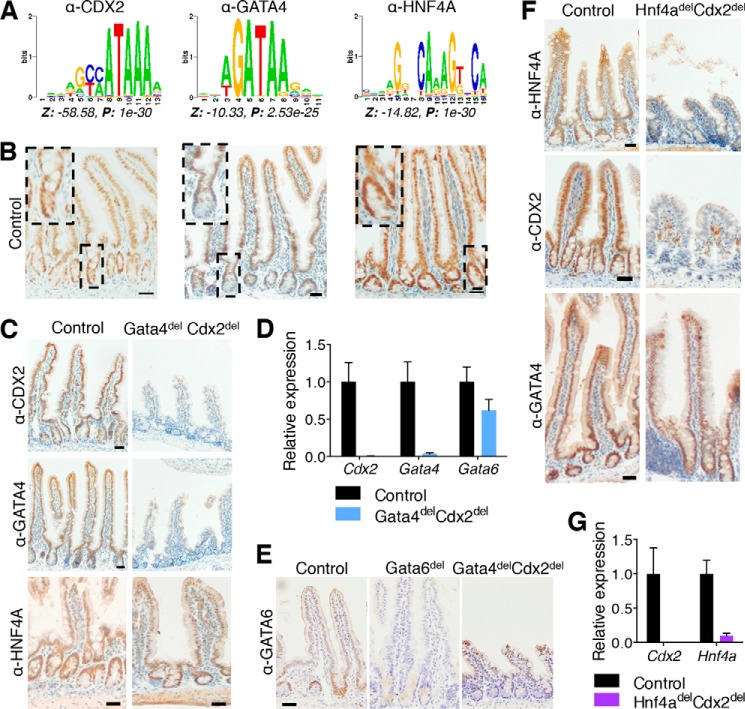
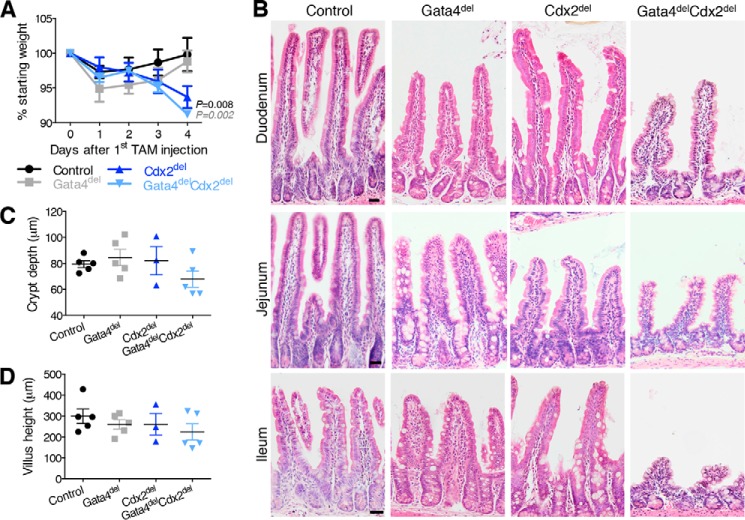
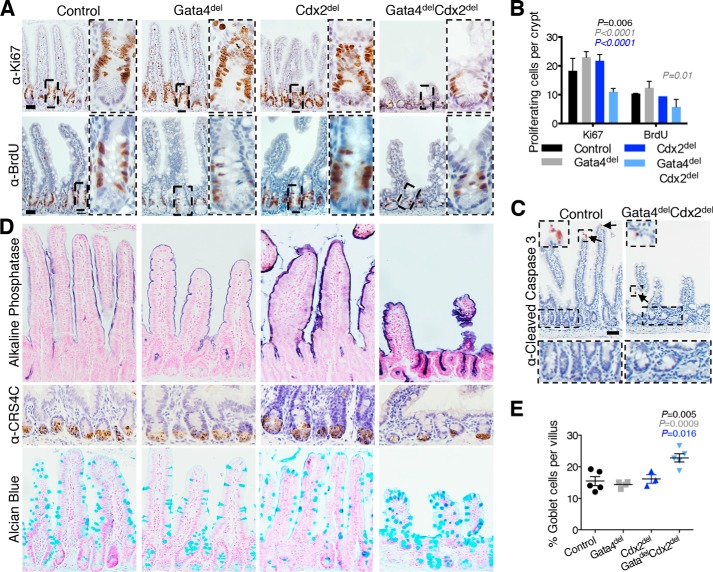
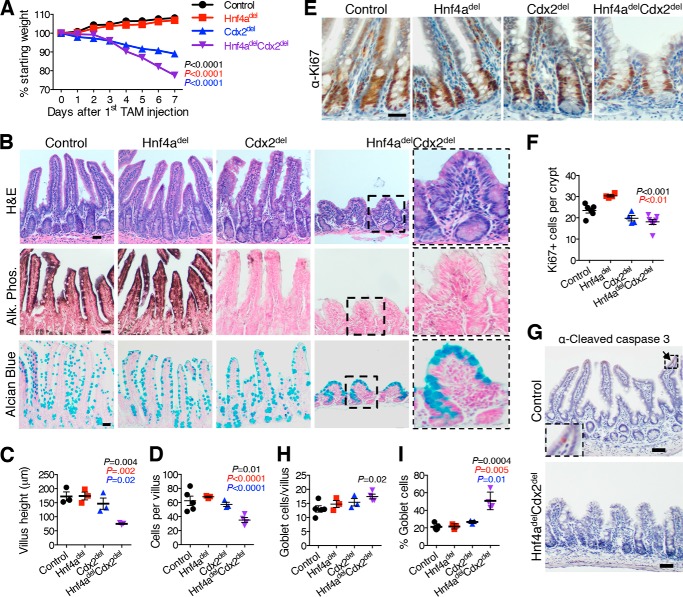
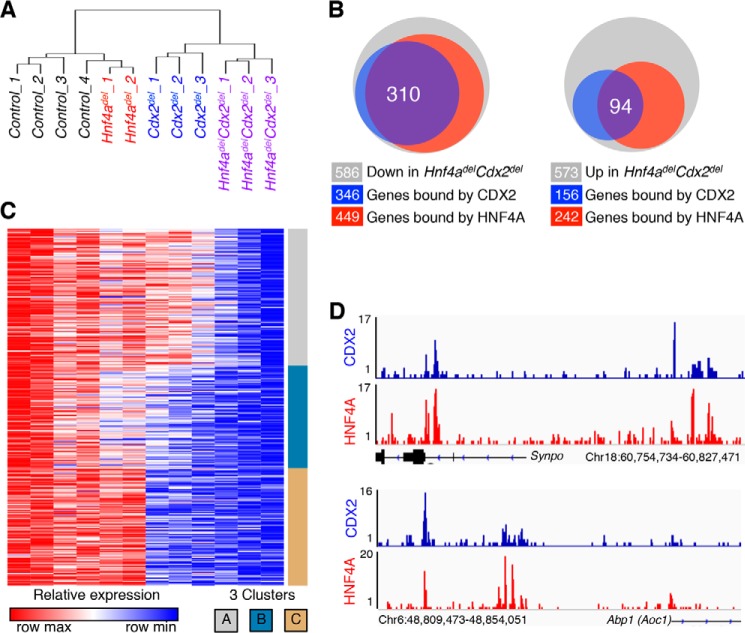
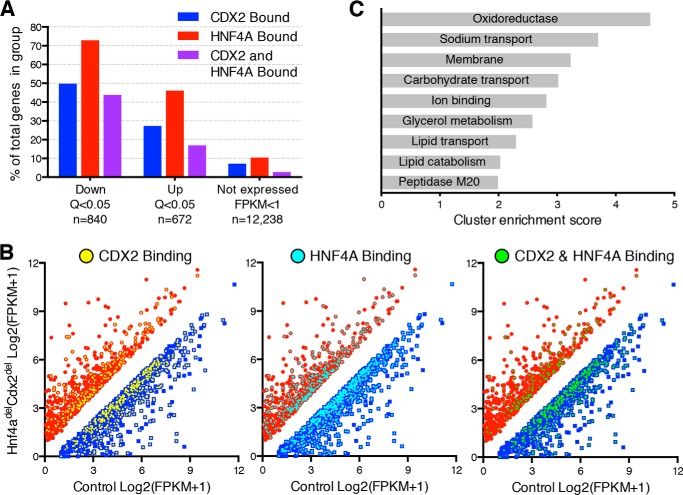
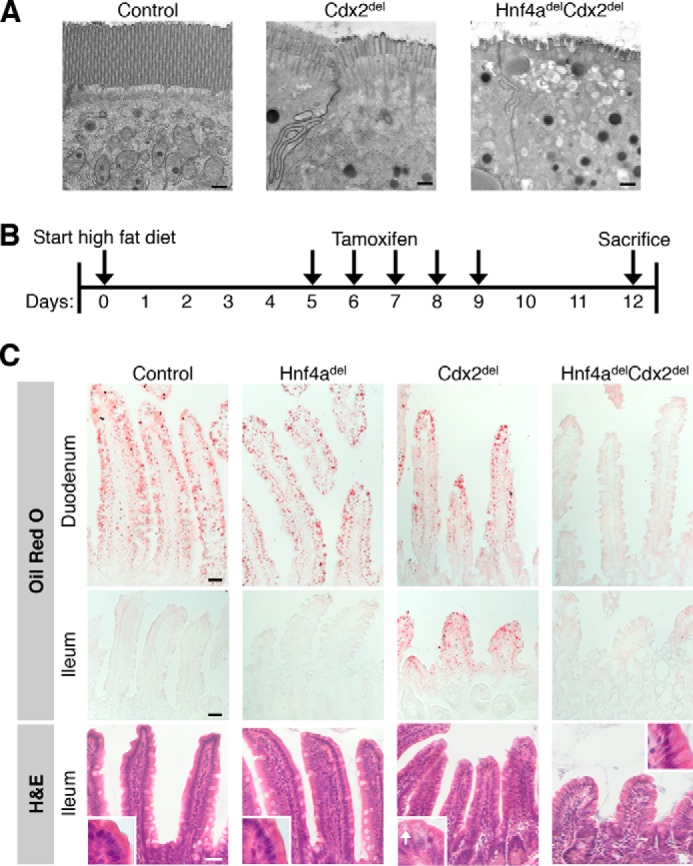
Distinct groups of transcription factors (TFs) assemble at tissue-specific cis-regulatory sites, implying that different TF combinations may control different genes and cellular functions. Within such combinations, TFs that specify or maintain a lineage and are therefore considered master regulators may play a key role. Gene enhancers often attract these tissue-restricted TFs, as well as TFs that are expressed more broadly. However, the contributions of the individual TFs to combinatorial regulatory activity have not been examined critically in many cases in vivo. We address this question using a genetic approach in mice to inactivate the intestine-specifying and intestine-restricted factor CDX2 alone or in combination with its more broadly expressed partner factors, GATA4 and HNF4A. Compared with single mutants, each combination produced significantly greater defects and rapid lethality through distinct anomalies. Intestines lacking Gata4 and Cdx2 were deficient in crypt cell replication, whereas combined loss of Hnf4a and Cdx2 specifically impaired viability and maturation of villus enterocytes. Integrated analysis of TF binding and of transcripts affected in Hnf4a;Cdx2 compound-mutant intestines indicated that this TF pair controls genes required to construct the apical brush border and absorb nutrients, including dietary lipids. This study thus defines combinatorial TF activities, their specific requirements during tissue homeostasis, and modules of transcriptional targets in intestinal epithelial cells in vivo.

Keywords: CDX2 Transcription Factor; Cell Differentiation; Cell Proliferation; GATA Transcription Factor; Gene Regulation; HNF4A Transcription Factor; Intestinal Epithelium; Lipid Metabolism.


Figures

FIGURE 1.
FIGURE 1.
Recurrence of DNA sequence motifs at CDX2-binding sites in mouse intestinal villus cells and efficient gene deletion in conditional mutant mice. A, motifs for CDX2, GATA, and HNF4A are enriched near the 5000 strongest CDX2-binding sites in wild-type mouse intestinal villus cells. Position weight matrices, with the corresponding Z-score and p value, are indicated for each motif. B, immunohistochemistry for each TF showed nuclear staining throughout the crypt-villus axis in wild-type mice. Dashed boxes and insets show crypt details. C, CDX2 (upper panels) and GATA4 (middle panels) immunohistochemistry in control and Gata4delCdx2del jejuna confirmed the absence of the targeted TF proteins. Immunohistochemistry for HNF4A (lower panels) revealed similar levels in Gata4delCdx2del and control mice. D, quantitative RT-PCR for Cdx2 and Gata4 revealed complete loss of these mRNAs in the Gata4delCdx2del jejunum compared with controls (n = 2 each). However, Gata6 mRNA levels were only mildly reduced (n ≥ 4 each). E, GATA6 immunohistochemistry showed persistent protein in the Gata4delCdx2del jejunum after 4 days of tamoxifen. At the same time, mice with Gata6del alone recombined the allele efficiently and lost GATA6. F, immunohistochemistry for HNF4A (upper panels) and CDX2 (middle panels) verified the absence of both proteins in the ileum of compound-mutant intestines. Staining for GATA4 (lower panels) in the duodenum of Hnf4adelCdx2del mice (GATA4 is not expressed in the ileum) was similar to the control. G, quantitative RT-PCR for Cdx2 and Hnf4a showed complete and nearly complete loss of mRNA levels (n = 3 each), respectively. Scale bars = 30 μm. Graphs show means ± S.E.
FIGURE 2.
FIGURE 2.
Morbidity and morphologic defects with combined loss of Gata4 and Cdx2. A, mouse body weights each day after the start of tamoxifen (TAM) injection revealed weight loss in Cdx2del and Gata4delCdx2del mice. Significance was calculated between Gata4delCdx2del mice and other genotypes on day 4 (n ≥ 5). B, duodenal (upper panels), jejunal (middle panels), and ileal (lower panels) tissue sections stained with H&E showed reduced villus height and crypt depth in Gata4delCdx2del intestines compared with loss of either TF alone. Scale bars = 30 μm. C and D, quantitation of crypt (C) and villus (D) length in the Gata4delCdx2del jejunum compared with single mutants and controls (n ≥ 3). Graphs show means ± S.E. Statistical significance was assessed using Student's t test; p values are indicated when significant and are color-coded to match the sample with which Gata4delCdx2del samples were compared.
FIGURE 3.
FIGURE 3.
Effects of combined loss of Gata4 and Cdx2 on proliferating and differentiated intestinal cells. A, immunohistochemistry of proliferative markers Ki67 and BrdU (administered 1 h before euthanasia) confirmed significantly reduced proliferation in Gata4delCdx2del jejuna compared with single-mutant and control littermates (quantified in B). Dashed boxes outline the areas magnified to the right. Scale bars = 50 μm. C, cleaved caspase-3 staining revealed that apoptosis was not increased in Gata4delCdx2del intestines compared with control villi or crypts (areas in dashed boxes are magnified below). Arrows indicate caspase-3-positive cells (an example is magnified in the dashed box on the upper left. D, histochemistry and immunohistochemistry of the jejuna for alkaline phosphatase and CRS4C1 in Gata4delCdx2del and control mice showed no differences in mature enterocytes and Paneth cells, respectively. Alcian blue staining revealed an increased fraction of villus goblet cells in Gata4delCdx2del intestines (quantified in E). Of note, Gata4delCdx2del mice had ectopic alkaline phosphatase and Alcian blue staining in crypts. Graphs show means ± S.E. Significant changes between Gata4delCdx2del and other genotypes were calculated using Student's t test. Results are color-coded by genotype; insignificant differences are not marked. Scale bars = 50 μm (A) and 30 μm (C).
FIGURE 4.
FIGURE 4.
Combined loss of Hnf4a and Cdx2 accelerates death and results in reduction of absorptive enterocytes. A, weight loss in Hnf4delCdx2del mice was accelerated compared with single mutants or controls, requiring euthanasia within 7 days of induced gene deletion. Significance was calculated between Hnf4adelCdx2del mice and other genotypes on day 7 (n = 6). TAM, tamoxifen. B, H&E staining of the ileum in the Hnf4a/Cdx2 genetic series showed significant shortening of Hnf4adelCdx2del villi (quantified in C). Both Cdx2del and Hnf4adelCdx2del mice lacked alkaline phosphatase (Alk. Phos.) in ileal villus cells, indicating defective enterocyte maturation. Alcian blue staining revealed goblet cell abundance in Hnf4adelCdx2del villi. Dashed boxes outline areas magnified to the right. D, the total number of ileal villus cells was reduced in Hnf4adelCdx2del mice. E, Ki67 immunohistochemistry showed that combined loss of Hnf4a and Cdx2 affected proliferation no more than loss of Cdx2 alone (quantified in F). G, cleaved caspase-3 staining revealed no significant apoptosis in the Hnf4adelCdx2del ileal epithelium. A few apoptotic cells were present at the villus tips in control mice (arrow). A caspase-3-positive cell is magnified in dashed box at the lower left. H, quantitation of total goblet cell numbers per villus in the ileum showed no increase in Hnf4adelCdx2del intestines compared with single-mutant intestines. I, Hnf4adelCdx2del mice exhibited an increased proportion of ileal goblet cells. Scale bars = 30 μm (B and E) and 50 μm (G). Graphs show means ± S.E. Significant changes between Hnf4adelCdx2del and other genotypes were calculated using Student's t test. Results are color-coded by genotype as indicated; insignificant results are not indicated.
FIGURE 5.
FIGURE 5.
mRNA analysis of single- and compound-mutant intestinal epithelia reveals dependences on single or multiple TFs. A, hierarchical cluster analysis of global mRNA expression in a series of Hnf4a;Cdx2 mutant intestinal epithelia revealed that transcripts were more profoundly affected in Hnf4adelCdx2del than in either single mutant. B, Venn diagram depicting dysregulated genes in Hnf4adelCdx2del mice (gray) and their overlap with CDX2 (blue) and HNF4A (red) binding. Gene numbers represented in each circle are indicated below. C, heat map showing expression levels in each genotype of the 310 down-regulated and co-occupied genes. The patterns of change fall into three k-means clusters (A–C). D, data traces for CDX2 and HNF4A ChIP-seq at the Abp1 (Aoc1) and Synpo loci, demonstrating TF co-occupancy at selected sites. The y axis indicates the density of mapped sequence tags, and genome coordinates are shown on the x axis, Chr, chromosome.
FIGURE 6.
FIGURE 6.
RNA-seq analysis further identifies CDX2- and HNF4A-co-regulated intestinal genes. A and B, integration of CDX2 and HNF4A binding data from ChIP-seq with mRNA expression data from RNA-seq analysis of control and Hnf4adelCdx2del intestines. A, genes significantly down- or up-regulated (Q < 0.05) are shown in relation to those not expressed (fragments/kb of transcript/million mapped reads (FPKM) < 1) in either sample. The fraction of genes in each group bound by CDX2 (blue), HNF4A (red), and both TFs (purple) indicates again that these TFs activate mainly target genes. B, FPKM graphs showing RNA-seq expression of significantly up- and down-regulated genes are overlaid with binding for CDX2 (left panel, yellow), HNF4A (middle panel, aqua), and both (right panel, green), demonstrating a higher distribution of bound down-regulated genes. C, gene ontology annotation clusters from DAVID analysis of the 362 genes significantly down-regulated in Hnf4adelCdx2del intestines and bound by both TFs.
FIGURE 7.
FIGURE 7.
HNF4A and CDX2 co-regulate enterocyte apical microvilli and absorption of dietary lipids. A, electron micrographs of ileal enterocyte apices showing an intact brush border in control mice, shortened microvilli in Cdx2del mice, and severely depleted and stunted microvilli in Hnf4adelCdx2del intestines. Scale bars = 500 nm. B, experimental schema for maintaining mice on a high-fat diet before, during, and after inducing gene deletion. C, Oil Red O staining for neutral lipids revealed ectopic lipid absorption in Cdx2del ileal enterocytes and a total lack of lipid absorption in Hnf4delCdx2del intestines. H&E staining of the ileum revealed light lipid droplets in the Cdx2del epithelium (inset, white arrow), but not in other genotypes. Scale bars = 30 μm.

Similar articles

Cited by

References

    1. James R., Erler T., Kazenwadel J. (1994) Structure of the murine homeobox gene cdx-2. Expression in embryonic and adult intestinal epithelium. J. Biol. Chem. 269, 15229–15237 - PubMed
    1. Krapp A., Knöfler M., Frutiger S., Hughes G. J., Hagenbüchle O., Wellauer P. K. (1996) The p48 DNA-binding subunit of transcription factor PTF1 is a new exocrine pancreas-specific basic helix-loop-helix protein. EMBO J. 15, 4317–4329 - PMC - PubMed
    1. Ohlsson H., Karlsson K., Edlund T. (1993) IPF1, a homeodomain-containing transactivator of the insulin gene. EMBO J. 12, 4251–4259 - PMC - PubMed
    1. German M. S., Wang J., Chadwick R. B., Rutter W. J. (1992) Synergistic activation of the insulin gene by a LIM-homeo domain protein and a basic helix-loop-helix protein: building a functional insulin minienhancer complex. Genes Dev. 6, 2165–2176 - PubMed
    1. James R., Kazenwadel J. (1991) Homeobox gene expression in the intestinal epithelium of adult mice. J. Biol. Chem. 266, 3246–3251 - PubMed

Publication types

Associated data