. 2015 Jan 30;290(5):3121-36.
doi: 10.1074/jbc.M114.628628. Epub 2014 Dec 8.

Pompe disease results in a Golgi-based glycosylation deficit in human induced pluripotent stem cell-derived cardiomyocytes

Affiliations

Pompe disease results in a Golgi-based glycosylation deficit in human induced pluripotent stem cell-derived cardiomyocytes

Kunil K Raval et al. J Biol Chem. .

Abstract

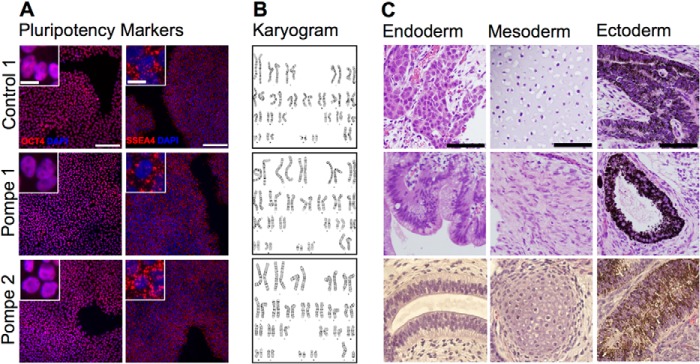
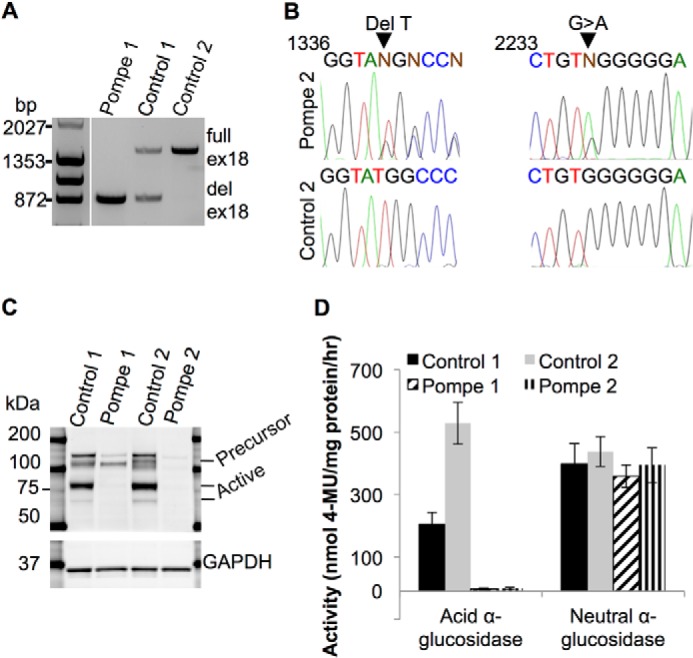
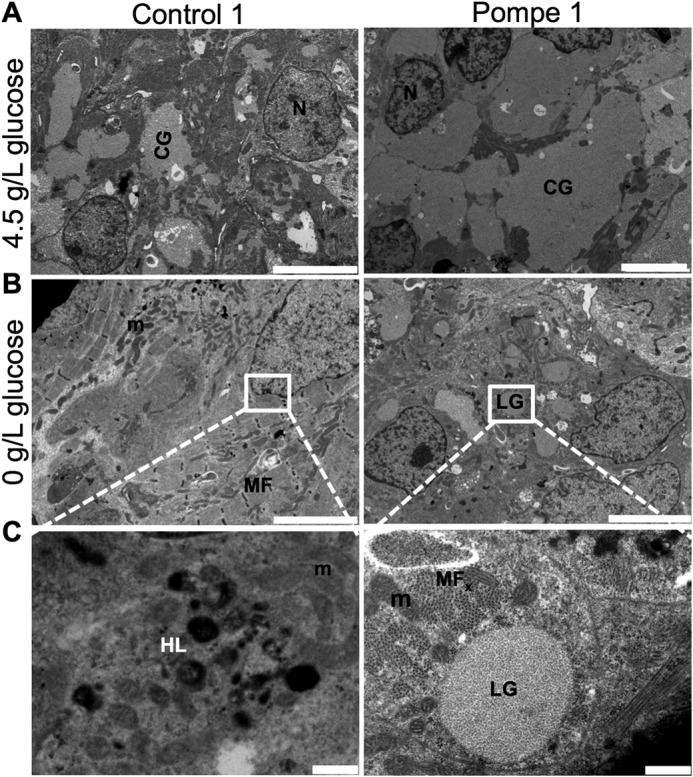
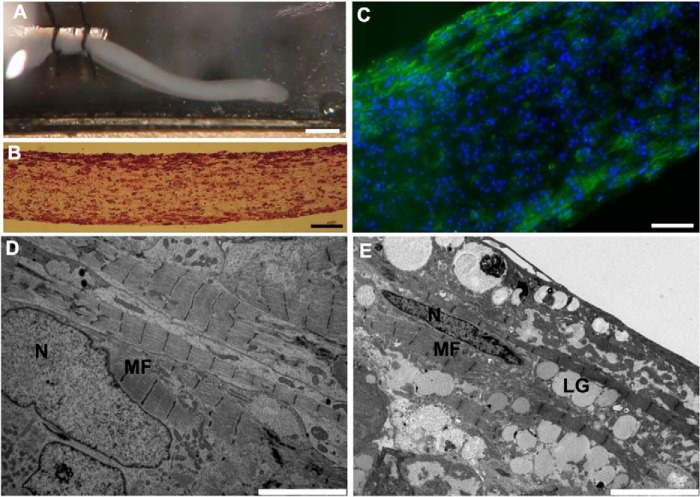
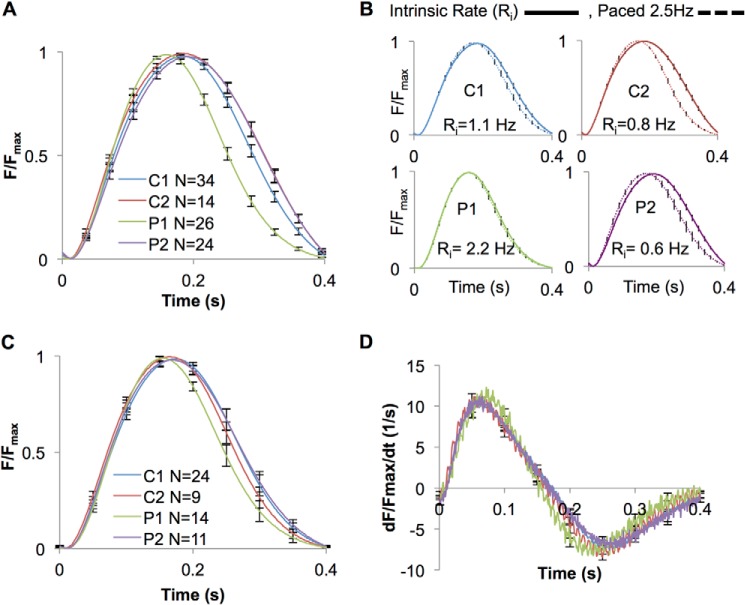
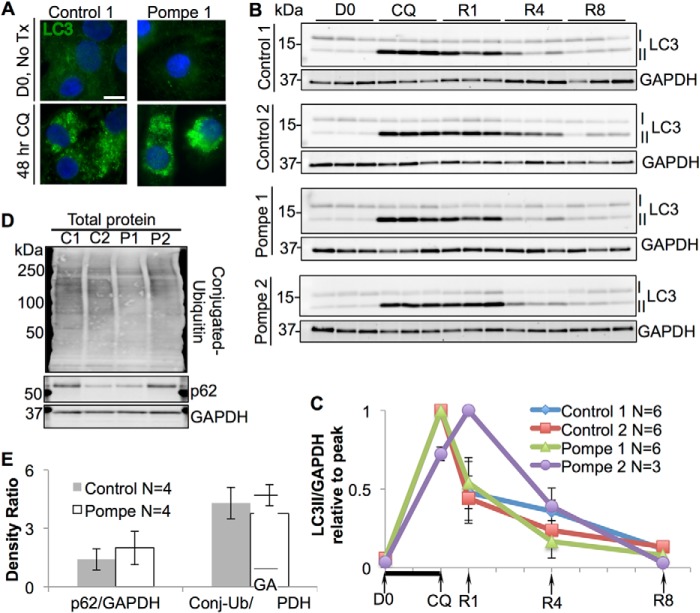
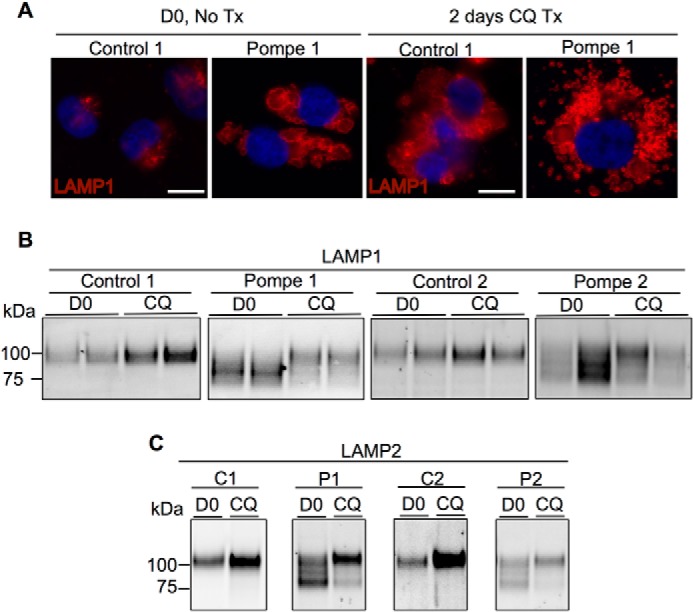
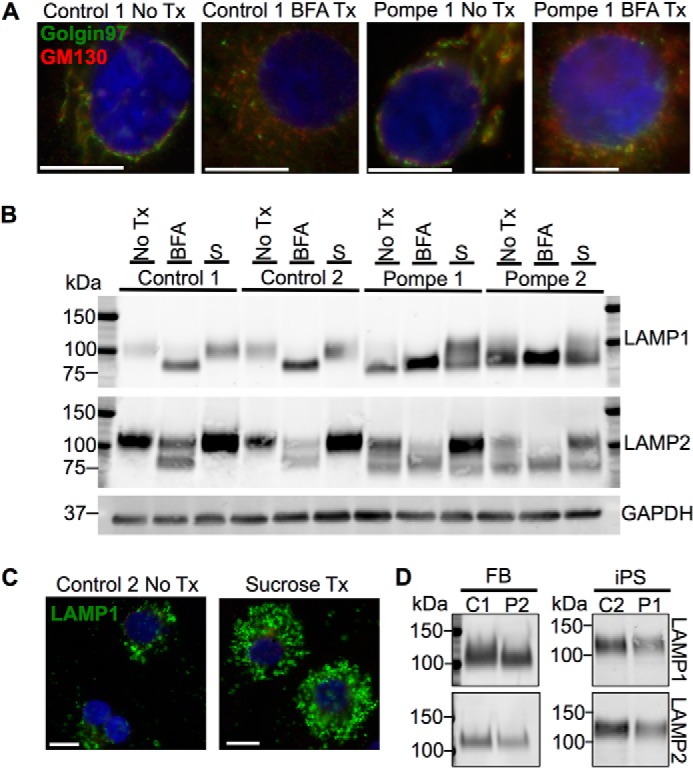
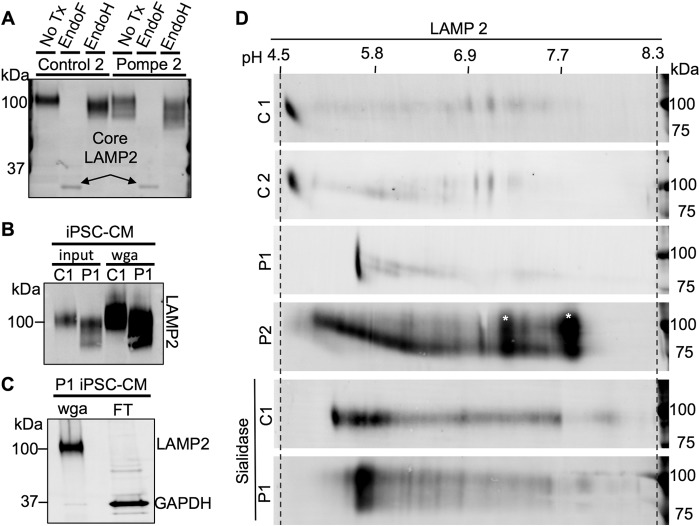
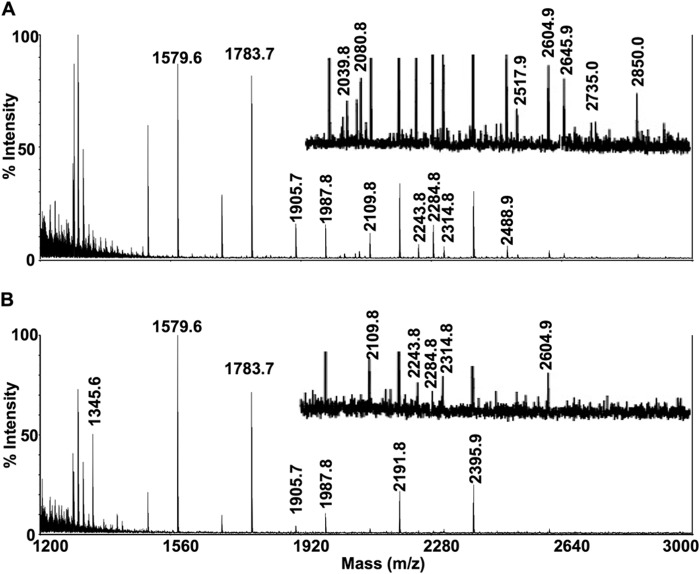
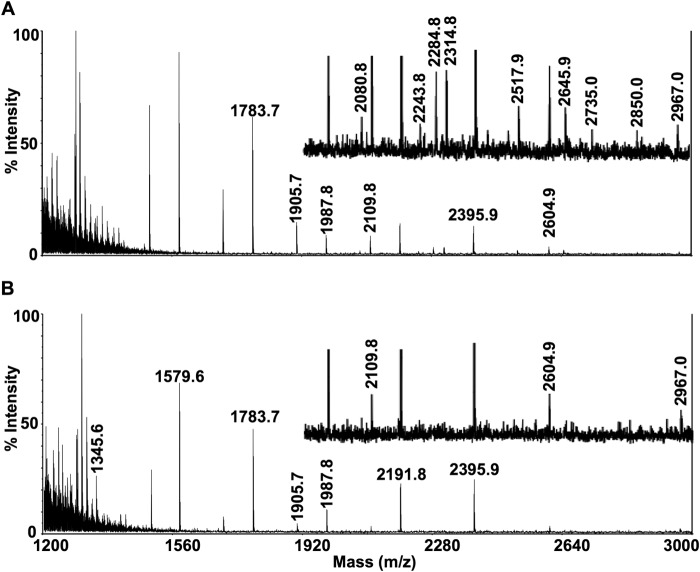
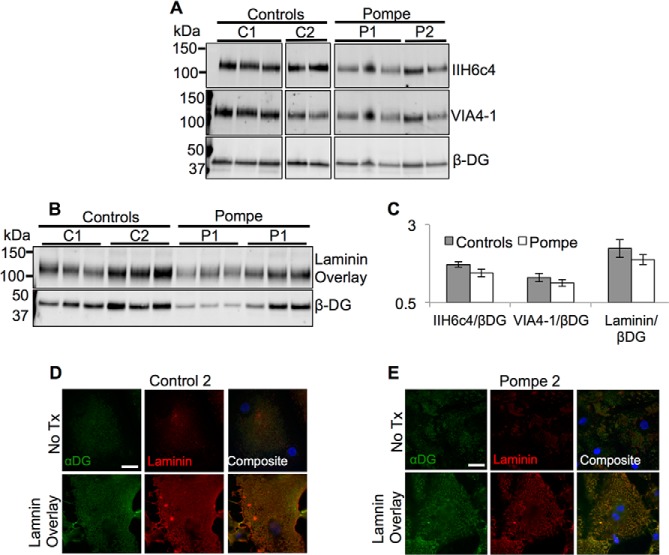
Infantile-onset Pompe disease is an autosomal recessive disorder caused by the complete loss of lysosomal glycogen-hydrolyzing enzyme acid α-glucosidase (GAA) activity, which results in lysosomal glycogen accumulation and prominent cardiac and skeletal muscle pathology. The mechanism by which loss of GAA activity causes cardiomyopathy is poorly understood. We reprogrammed fibroblasts from patients with infantile-onset Pompe disease to generate induced pluripotent stem (iPS) cells that were differentiated to cardiomyocytes (iPSC-CM). Pompe iPSC-CMs had undetectable GAA activity and pathognomonic glycogen-filled lysosomes. Nonetheless, Pompe and control iPSC-CMs exhibited comparable contractile properties in engineered cardiac tissue. Impaired autophagy has been implicated in Pompe skeletal muscle; however, control and Pompe iPSC-CMs had comparable clearance rates of LC3-II-detected autophagosomes. Unexpectedly, the lysosome-associated membrane proteins, LAMP1 and LAMP2, from Pompe iPSC-CMs demonstrated higher electrophoretic mobility compared with control iPSC-CMs. Brefeldin A induced disruption of the Golgi in control iPSC-CMs reproduced the higher mobility forms of the LAMPs, suggesting that Pompe iPSC-CMs produce LAMPs lacking appropriate glycosylation. Isoelectric focusing studies revealed that LAMP2 has a more alkaline pI in Pompe compared with control iPSC-CMs due largely to hyposialylation. MALDI-TOF-MS analysis of N-linked glycans demonstrated reduced diversity of multiantennary structures and the major presence of a trimannose complex glycan precursor in Pompe iPSC-CMs. These data suggest that Pompe cardiomyopathy has a glycan processing abnormality and thus shares features with hypertrophic cardiomyopathies observed in the congenital disorders of glycosylation.

Keywords: Autophagy; Cardiomyopathy; Golgi; Induced Pluripotent Stem Cell (iPSC); Lysosomal Glycoprotein; N-linked Glycosylation; Pompe Disease; Tissue Engineering.


Figures

FIGURE 1.
FIGURE 1.
Characterization of iPS cells reprogrammed from patient dermal fibroblasts. A, immunofluorescence of iPS cell cultures probed with anti-OCT4 (nuclear) and anti-SSEA4 (plasma membrane) markers of pluripotency. Scale bar = 100 μm for panels and 10 μm for insets. B, Giemsa band karyograms from each line: Control 1, 46XX; Pompe 1, 46XX; Pompe 2, 46XY. C, H&E-stained sections of iPS cell teratomas. Examples of endoderm, mesoderm, and ectoderm are represented from each reprogrammed line. Endoderm: Control 1, hepatoid cells; Pompe 1, primitive gut epithelium; Pompe 2, respiratory epithelium. Mesoderm: Control 1, cartilage; Pompe 1, smooth muscle; Pompe 2, cartilage. Ectoderm: Control 1, Pompe 1 and Pompe 2, retinal pigmented epithelium. Scale bar = 50 μm.
FIGURE 2.
FIGURE 2.
The acid α-glucosidase genotype and biochemical phenotype in Pompe and control iPS cell lines. A, PCR products of the genomic DNA region that includes GAA exon 18 from Pompe 1, Control 1, and Control 2 iPS cell lines separated on a 0.8% agarose gel. ex18, exon 18; del ex18, deletion of exon 18. B, sequencing chromatograms of PCR products from Pompe 2 iPS cell genomic DNA at locations of the two point mutations. Aligned wild-type sequences underneath are from Control 2 iPS cells. Arrows point to the deletion of a T nucleotide in one allele and the G→A transition in the other allele. Regions of interest were PCR-amplified and directly sequenced. Nucleotide position numbers refer to the GAA cDNA sequence. C, immunoblot of iPS cell total protein lysates probed with anti-GAA. The precursor form is ∼110 kDa, and enzymatically active forms are represented by a dark band above and a light band below the 75-kDa marker. Anti-GAPDH was used as a loading control. D, enzymatic activity assay of total protein lysates from the four iPS cell lines for the ability to hydrolyze 4-MUG into glucose and the fluorophore 4-MU at pH 4 for lysosomal GAA and at pH 7 for cytoplasmic neutral α-glucosidase. Activity is measured as nmol of 4-MU released/mg of protein/h. n = 4 biological replicates (cells taken from different passages) for each line. All error bars are ±S.E.
FIGURE 3.
FIGURE 3.
Ultrastructure of Pompe and control iPSC-CMs. A, electron micrographs of Control 1 and Pompe 1 iPSC-CMs cultured in media containing 4.5 g/liter glucose. Scale bar = 5 μm B, electron micrographs of Control 1 and Pompe 1 iPSC-CMs cultured in zero g/liter glucose for 24 h before imaging. Scale bar = 5 μm C, expanded regions from B. scale bar = 0.5 μm. N, nuclei; CG, cytoplasmic glycogen; M, mitochondria; HL, healthy lysosome; LG, lysosomal glycogen; MF, myofilaments; MFx, myofilaments in cross-section.
FIGURE 4.
FIGURE 4.
Structural characterization of ECTs produced with control and Pompe iPSC-CMs. A, photograph of an ECT in perfusion chamber before testing. The left end is tied to a stationary arm, and the right end will soon be attached to the force transducer. Scale bar = 1 mm. B, photomicrograph of an H&E-stained longitudinal ECT section post-testing. Scale bar = 50 μm C, immunofluorescence image of a sectioned ECT immunolabeled with anti-cTnT to identify cardiomyocyte location. Scale bar = 50 μm. DAPI stains the nuclei blue. D, representative electron micrographs of a control ECT. Scale bar = 5 μm E, an electron micrograph of a Pompe ECT. N, nuclei; MF, myofilaments; LG, lysosomal glycogen. Scale bar = 5 μm.
FIGURE 5.
FIGURE 5.
Contractile force and kinetic studies of ECTs produced with control and Pompe iPSC-CMs. A, force normalized to maximum force (F/Fmax) versus time curves for a single contraction at 2.5 Hz from ECTs contracting at their intrinsic rate (unpaced) while in culture for 2 weeks prior to testing. 30 contractions are averaged for each ECT. B, the F/Fmax versus time curves measured at 2.5 Hz for both control and Pompe ECTs either allowed to contract at their intrinsic rate for 2 weeks in culture or paced at 2.5 Hz for 1 week before measurement. The N (number of ECTs tested) for each cell line in both paced and intrinsic rate groups are given in Table 3. C, F/Fmax versus time curves for a single contraction at 2.5 Hz from ECTs that were paced in culture for 1 week at 2.5 Hz. D, first derivative (dF/dt, dt = 0.001s) of the F/Fmax versus time curves in C. All error bars are ±S.E.
FIGURE 6.
FIGURE 6.
Autophagosomal flux in control and Pompe iPSC-CMs during recovery from CQ-mediated lysosomal arrest. A, immunofluorescence image of LC3 in control and Pompe iPSC-CMs before and after 2 days of CQ treatment. DAPI stains the nuclei blue. Scale bar = 10 μm. B, LC3 immunoblots of total protein lysates during CQ treatment and recovery with GAPDH controls. LC3-I is converted into LC3-II upon autophagosomal formation. Three replicate experiments (CMs differentiated from different iPS cell passages) are shown for each line, with one lane representing cells from one culture well. D0, day 0. Cells were harvested immediately before CQ treatment. CQ, cells exposed to CQ for 2 days before protein collection. R1, R4, and R8, recovery from CQ treatment. CQ was removed from the media, and cells were cultured for 1, 4, and 8 days in normal media before harvest. The x axis is labeled to correspond with immunoblot time points. C, quantification of LC3-II/GADPH density ratios from B relative to the maximum ratio set to 1. Each x axis mark represents 1 day, with the black bar indicating CQ exposure. D, immunoblots of p62 and total ubquitinylated protein (mono- and poly-) from Control 1 and 2 and Pompe 1 and 2 iPSC-CM total protein. E, quantification of p62 and conjugated ubiquitin (Conj-Ub) to GAPDH density ratios. Density ratios were averaged from four independent control (two C1 + two C2) and Pompe (two P1 + two P2) samples on two separate blots. All error bars are ±S.E.
FIGURE 7.
FIGURE 7.
Analysis of LAMPs from control and Pompe iPSC-CMs before and after CQ treatment. A, LAMP1 immunofluorescence in control and Pompe iPSC-CMs before (D0) and after 2 days of CQ treatment (Tx). DAPI stains the nuclei blue. Scale bar = 10 μm. B, LAMP1 immunoblots from Pompe and control iPSC-CMs before and after 2 days of CQ treatment. Data are presented in duplicates. C, LAMP2 immunoblots from Pompe and control iPSC-CMs before and after 2 days of CQ exposure.
FIGURE 8.
FIGURE 8.
Effect of Golgi structural disruption and induction of an artificial lysosomal storage disorder on LAMP1 and LAMP2 from control and Pompe iPSC-CMs. A, the Golgi apparatus stained with cis- and trans-Golgi marker GM130 and Golgin-97, respectively, in control and Pompe iPSC-CMs and after treatment (Tx) with BFA. Scale bars = 10 μm. B, immunoblots of LAMP1 and LAMP2 from iPSC-CMs with no treatments (No Tx), after 2 days of 500 ng/ml BFA treatment and after 2 weeks of culture in 100 mm sucrose (S). GAPDH functions as the loading control. C, lysosomes stained with LAMP1 before and after 2 weeks of sucrose treatment in Control 2 iPSC-CMs. Scale bar = 10 μm. All nuclei are stained with DAPI in blue. D, representative LAMP1 and LAMP2 immunodetection from skin fibroblast (FB) and iPS cell total protein lysates.
FIGURE 9.
FIGURE 9.
Glycosylation analysis of LAMP2 from control and Pompe iPSC-CMs via endoglycosidase treatment and two-dimensional glycoprotein separation. A, endoglycosidase analysis of LAMP2 in Control 2 and Pompe 2 iPSC-CMs. Endo F cleaves all N-linked glycan chains, producing a de-N-glycosylated peptide. Endo H cleaves N-linked glycan chains that have not yet been processed by the α-mannosidase II class of Golgi glycosidases. B, Western blots demonstrating LAMP2 enrichment from total iPSC-CM protein by WGA glycoprotein pulldown. LAMP2 was immunodetected from equal amounts of Control 2 and Pompe 2 total cellular protein (input) and WGA-bound glycoprotein (wga). C, Western blot showing efficiency of LAMP2 extraction by WGA from Control 1 iPSC-CM total protein lysate. LAMP2 and GAPDH were immunodetected in the WGA-bound fraction and the WGA-unbound (flow-through (FT)) fraction. D, WGA-bound glycoprotein extracts from Control 1 and 2 and Pompe 1 and 2 iPSC-CMs separated by pI and molecular weight along the horizontal and vertical axes, respectively, and probed for LAMP2. The pH gradient across the IEF tube was measured by using a surface pH electrode for three blank IEF tubes. Also included are sialidase-treated Control 1 and Pompe 1 glycoprotein prior to two-dimensional separation and immunodetection of LAMP2. *, indicates likely background detection.
FIGURE 10.
FIGURE 10.
Mass spectra of N-linked glycans from Control 1 and Pompe 1 iPSC-CMs. Mass spectra obtained from MALDI-TOF-MS of N-linked glycans from Control 1 (A) and Pompe 1 (B) iPSC-CMs. Equal (weighed) amounts of total cellular protein per sample were processed for N-linked glycan extraction, permethylation, and mass/charge determination. Individual peaks and background intensities are calibrated to the maximal intense peak of the sample. Regions that contain peaks of relatively low intensity have been presented at ×4 magnification above the region without magnification.
FIGURE 11.
FIGURE 11.
Mass spectra of N-linked glycans from Control 2 and Pompe 2 iPSC-CMs. Mass spectra obtained from MALDI-TOF-MS of N-linked glycans from Control 2 (A) and Pompe 2 (B) iPSC-CMs. See Fig. 10 legend for description.
FIGURE 12.
FIGURE 12.
Dystroglycan glycosylation and laminin binding in control and Pompe iPSC-CMs. A, immunoblots of glycoprotein from both control (C1 and C2) and Pompe (P1 and P2) iPSC-CMs probed with anti-αDG antibodies IIH6c4 and VIA4-1 that exclusively detect the laminin-binding glycoepitope. Each lane within one cell line represents protein from iPSC-CMs differentiated from different iPS cell passages. B, laminin overlay assay to measure laminin binding ability specific to αDG. Binding of laminin occurs at the molecular weight of αDG recognized by IIH6c4 and VIA4-1. C, quantification of α/β dystroglycan ratios in A and laminin binding to βDG ratios in D. No significant differences were noticed between the control and Pompe groups. D and E, laminin and αDG (IIH6c4) immunofluorescence of iPSC-CMs fixed after 2 days of incubation with exogenous laminin (bottom row) compared with normal culture conditions (top row) in Control 2 (D) and Pompe 2 (E) iPSC-CMs. Scale bar = 20 μm. All nuclei are stained with DAPI in blue.

Similar articles

Cited by

References

    1. van der Ploeg A. T., Reuser A. J. (2008) Pompe's disease. Lancet 372, 1342–1353 - PubMed
    1. Kishnani P. S., Hwu W. L., Mandel H., Nicolino M., Yong F., Corzo D., and Infantile-Onset Pompe Disease Natural History Study Group (2006) A retrospective, multinational, multicenter study on the natural history of infantile-onset Pompe disease. J. Pediatr. 148, 671–676 - PubMed
    1. Kishnani P. S., Goldenberg P. C., DeArmey S. L., Heller J., Benjamin D., Young S., Bali D., Smith S. A., Li J. S., Mandel H., Koeberl D., Rosenberg A., Chen Y. T. (2010) Cross-reactive immunologic material status affects treatment outcomes in Pompe disease infants. Mol. Genet. Metab. 99, 26–33 - PMC - PubMed
    1. Shea L., Raben N. (2009) Autophagy in skeletal muscle: implications for Pompe disease. Int. J. Clin. Pharmacol. Ther. 47, Suppl. 1, S42–S47 - PMC - PubMed
    1. Chen L. R., Chen C. A., Chiu S. N., Chien Y. H., Lee N. C., Lin M. T., Hwu W. L., Wang J. K., Wu M. H. (2009) Reversal of cardiac dysfunction after enzyme replacement in patients with infantile-onset Pompe disease. J. Pediatr. 155, 271–275 - PubMed

Publication types