. 2015 Mar;8(2):253-65.
doi: 10.1111/1751-7915.12236. Epub 2014 Dec 9.

A chromosomally encoded T7 RNA polymerase-dependent gene expression system for Corynebacterium glutamicum: construction and comparative evaluation at the single-cell level

Affiliations

A chromosomally encoded T7 RNA polymerase-dependent gene expression system for Corynebacterium glutamicum: construction and comparative evaluation at the single-cell level

Maike Kortmann et al. Microb Biotechnol. 2015 Mar.

Abstract

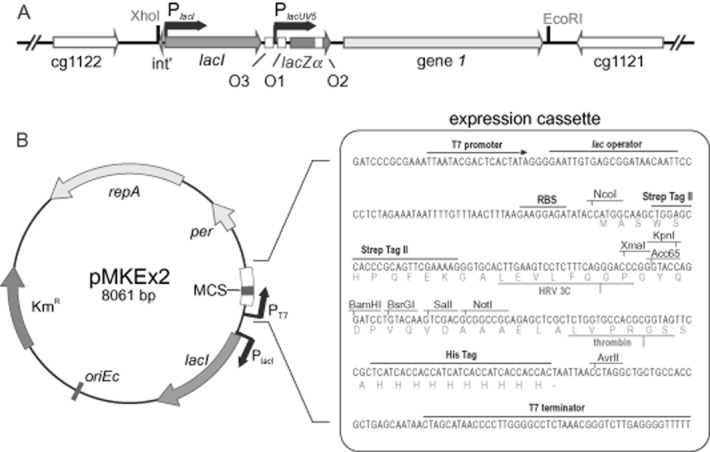
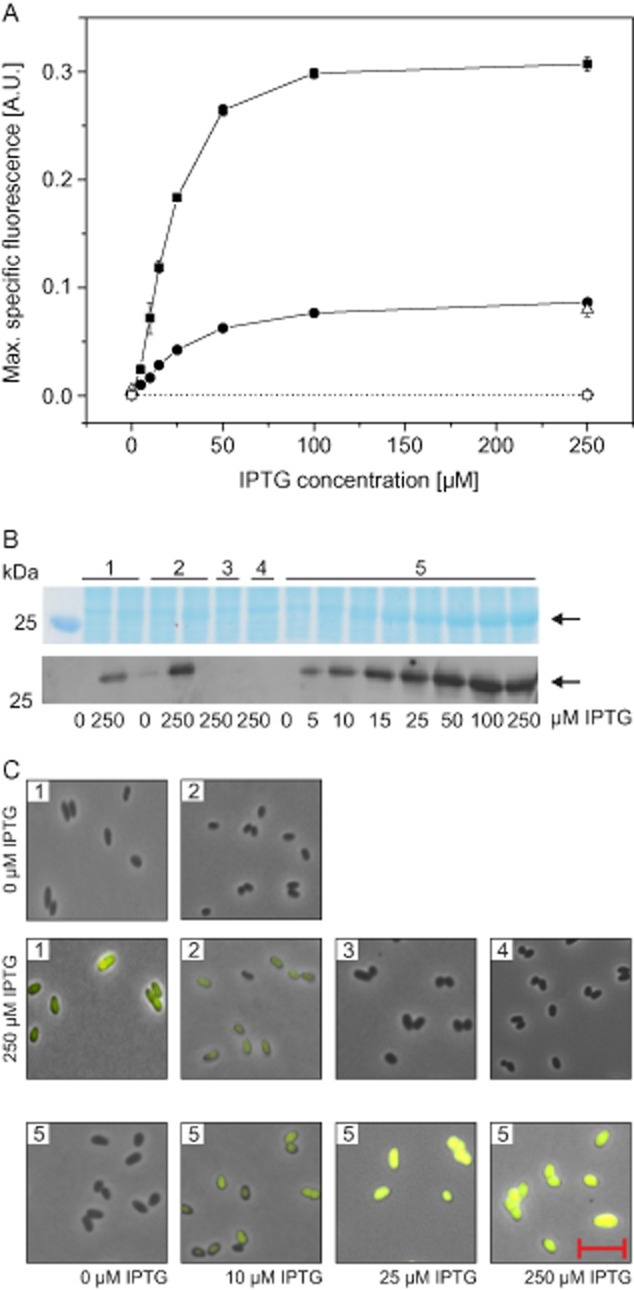
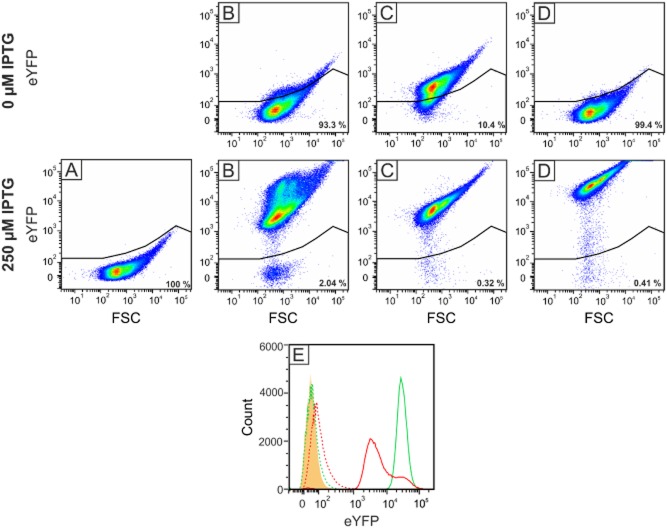
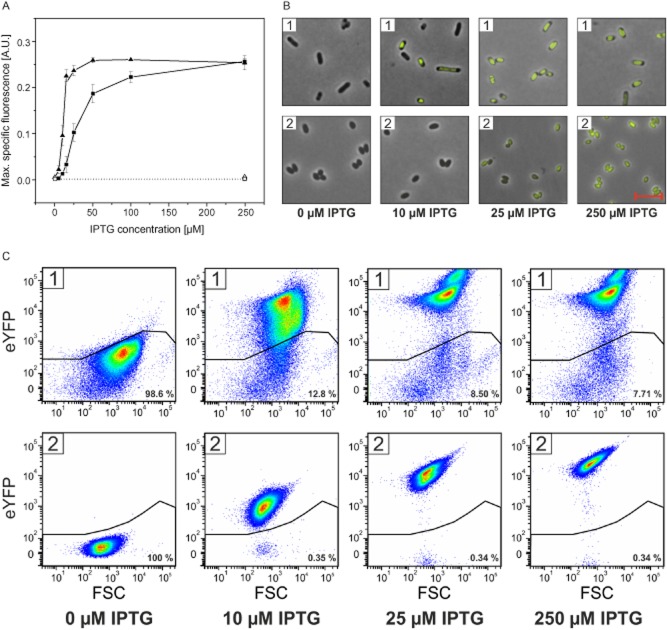
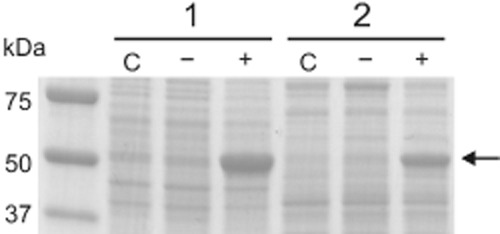
Corynebacterium glutamicum has become a favourite model organism in white biotechnology. Nevertheless, only few systems for the regulatable (over)expression of homologous and heterologous genes are currently available, all of which are based on the endogenous RNA polymerase. In this study, we developed an isopropyl-β-D-1-thiogalactopyranosid (IPTG)-inducible T7 expression system in the prophage-free strain C. glutamicum MB001. For this purpose, part of the DE3 region of Escherichia coli BL21(DE3) including the T7 RNA polymerase gene 1 under control of the lacUV5 promoter was integrated into the chromosome, resulting in strain MB001(DE3). Furthermore, the expression vector pMKEx2 was constructed allowing cloning of target genes under the control of the T7lac promoter. The properties of the system were evaluated using eyfp as heterologous target gene. Without induction, the system was tightly repressed, resulting in a very low specific eYFP fluorescence (= fluorescence per cell density). After maximal induction with IPTG, the specific fluorescence increased 450-fold compared with the uninduced state and was about 3.5 times higher than in control strains expressing eyfp under control of the IPTG-induced tac promoter with the endogenous RNA polymerase. Flow cytometry revealed that T7-based eyfp expression resulted in a highly uniform population, with 99% of all cells showing high fluorescence. Besides eyfp, the functionality of the corynebacterial T7 expression system was also successfully demonstrated by overexpression of the C. glutamicum pyk gene for pyruvate kinase, which led to an increase of the specific activity from 2.6 to 135 U mg(-1). It thus presents an efficient new tool for protein overproduction, metabolic engineering and synthetic biology approaches with C. glutamicum.


Figures

Figure 1
Figure 1
A. genomic region of C. glutamicum MB001(DE3) carrying the DE3 insertion. A 4.5 kb DNA fragment was amplified from chromosomal DNA of E. coli BL21(DE3) and inserted into the intergenic region of cg1121-cg1122 of MB001(DE3). The fragment contains lacI, lacZα and T7 gene 1, the latter two under the transcriptional control of the lacUV5 promoter and its three LacI operator sites O1-O3. B. Map of the expression plasmid pMKEx2, which is based on pJC1 and an expression cassette from pET52b. The region between the T7 promoter and the T7 terminator is shown in detail.
Figure 2
Figure 2
Comparison of eYFP synthesis in C. glutamicum with the newly constructed T7-based expression system and the pEKEx2 system using the tac promoter and the endogenous RNAP. The strains MB001/pEKEx2-eyfp (•/1), MB001/pJC1-Ptac-eyfp (Δ/2), MB001(DE3)/pMKEx2 (◊/3), MB001/pMKEx2-eyfp (□/4) and MB001(DE3)/pMKEx2-eyfp (▪/5) were grown aerobically in CGXII minimal medium with 4% (wt/vol) glucose using a Biolector system at 30°C and 1200 r.p.m. Target gene expression was induced 2 h after inoculation by addition of 0–250 μM IPTG.A. 25 h after starting the cultivation, the maximal specific eYFP fluorescence (ratio of fluorescence emission at 532 nm and backscatter value at 620 nm) was determined. Mean values of at least three independent experiments and standard deviations are shown.B. For protein analysis, cells were disrupted by beat-beating and equivalent amounts of total protein (10 μg) of the cell-free extracts were subjected to SDS-PAGE and visualized by staining with Coomassie Brilliant Blue. In addition, eYFP was detected by Western blotting with an polyclonal anti-GFP antibody. The arrows indicate the predicted size of 27.2 kDa for eYFP.C. Cells were analysed by fluorescence microscopy and images were taken with an exposure time of 40 ms. The red bar represents a length of 5 μm.
Figure 3
Figure 3
Analysis of heterologous eYFP production in the C. glutamicum strains MB001/pMKEx2-eyfp (A), MB001/pEKEx2-eyfp (B), MB001/pJC1-Ptac-eyfp (C) and MB001(DE3)/pMKEx2-eyfp (D) at the single-cell level. The strains were cultivated for 24 h at 30°C in CGXII minimal medium with 4% (wt/vol) glucose using a Biolector system. Induction of eyfp expression was triggered by adding 250 μM IPTG to the cultures after 2 h. Pseudo-coloured dot plots from flow cytometry analysis (excitation at 488 nm, emission at 533 nm) of at least 100 000 cells of each strain displaying the eYFP fluorescence signal against the forward scatter signal (FSC) are shown. The gate used to define non-fluorescent cells was set with C. glutamicum MB001(DE3)/pMKEx2 with 100% of the cells falling into this gate (data not shown). The number inside the blot indicates the percentage of cells inside this gate. Panel E shows a histogram of the strains MB001/pEKEx2-eyfp (red) and MB001(DE3)/pMKEx2-eyfp (green). The number of cells is plotted against the eYFP fluorescence intensity. The dotted peaks show the measurement of the uninduced culture, the continuous line the cultures grown in the presence of 250 μM IPTG. The orange peak represents the background set with strain MB001(DE3)/pMKEx2.
Figure 4
Figure 4
T7 RNAP-dependent expression of eyfp in C. glutamicum and E. coli. The strains C. glutamicum MB001/pMKEx2-eyfp (□), C. glutamicum MB001(DE3)/pMKEx2-eyfp (▪), E. coli BL21(DE3)/pMKEx2 (Δ) and E. coli BL21(DE3)/pMKEx2-eyfp (▴) were cultivated for 24 h aerobically in 2xTY medium using a BioLector system at 1200 r.p.m. and either 30°C (C. glutamicum) or 37°C (E. coli). Gene expression was induced 2 h after starting the cultivation by addition of 0–250 μM IPTG.A. After 24 h, the maximal specific eYFP fluorescence was determined (ratio of fluorescence emission at 532 nm and backscatter value at 620 nm). Mean values and standard deviations of at least three independent replicates are shown.B. Fluorescence microscopy images of E. coli BL21(DE3)/pMKEx2-eyfp (1) and C. glutamicum MB001(DE3)/pMKEx2-eyfp (2) cultivated with different IPTG concentrations. Images were taken with an exposure time of 40 ms. The red bar represents a length of 5 μm.C. Flow cytometry analysis of E. coli BL21(DE3)/pMKEx2-eyfp (1) and C. glutamicum MB001(DE3)/pMKEx2-eyfp (2) cultivated with different IPTG concentrations. Pseudo-coloured dot plots of eYFP fluorescence versus forward scatter are shown.
Figure 5
Figure 5
Coomassie-stained SDS-polyacrylamide gel for analysing overproduction of pyruvate kinase in C. glutamicum MB001(DE3)/pMKEx2-pyk (1) and E. coli BL21(DE3)/pMKEx2-pyk (2). The strains were cultivated in M9 medium with 2% (wt/vol) glucose (E. coli) or in CGXII medium with 4% (wt/vol) glucose (C. glutamicum). Strains labelled with ‘−’ were grown without IPTG, whereas strains labelled ‘+’ were supplemented with 250 μM IPTG when the cultures had reached an OD600 of 2. When the cultures had reached an OD600 of 5, cells were harvested and used for preparation of cell extracts. Ten microgram total protein of these extracts were subjected to SDS-PAGE. The samples labelled with ‘C’ represent control strains, either C. glutamicum MB001(DE3)/pMKEx2 (1) or E. coli BL21(DE3)/pMKEx2 (2), that were cultivated in the presence of 250 μM IPTG. The arrow indicates the predicted size for C. glutamicum pyruvate kinase (54.4 kDa).

Similar articles

Cited by

References

    1. Arvani S, Markert A, Loeschcke A, Jaeger KE. Drepper T. A T7 RNA polymerase-based toolkit for the concerted expression of clustered genes. J Biotechnol. 2012;159:162–171. - PubMed
    1. Baneyx F. Recombinant protein expression in Escherichia coli. Curr Opin Biotechnol. 1999;10:411–421. - PubMed
    1. Bansal-Mutalik R. Nikaido H. Quantitative lipid composition of cell envelopes of Corynebacterium glutamicum elucidated through reverse micelle extraction. Proc Natl Acad Sci USA. 2011;108:15360–15365. - PMC - PubMed
    1. Barnard GC, Henderson GE, Srinivasan S. Gerngross TU. High level recombinant protein expression in Ralstonia eutropha using T7 RNA polymerase based amplification. Protein Expr Purif. 2004;38:264–271. - PubMed
    1. Baumgart M, Luder K, Grover S, Gätgens C, Besra GS. Frunzke J. IpsA, a novel LacI-type regulator, is required for inositol-derived lipid formation in Corynebacteria and Mycobacteria. BMC Biol. 2013a;11:122. - PMC - PubMed

MeSH terms

LinkOut - more resources