. 2014 Dec 8;207(5):599-613.
doi: 10.1083/jcb.201405014.

BRCA2 diffuses as oligomeric clusters with RAD51 and changes mobility after DNA damage in live cells

Affiliations

BRCA2 diffuses as oligomeric clusters with RAD51 and changes mobility after DNA damage in live cells

Marcel Reuter et al. J Cell Biol. .

Erratum in

Abstract

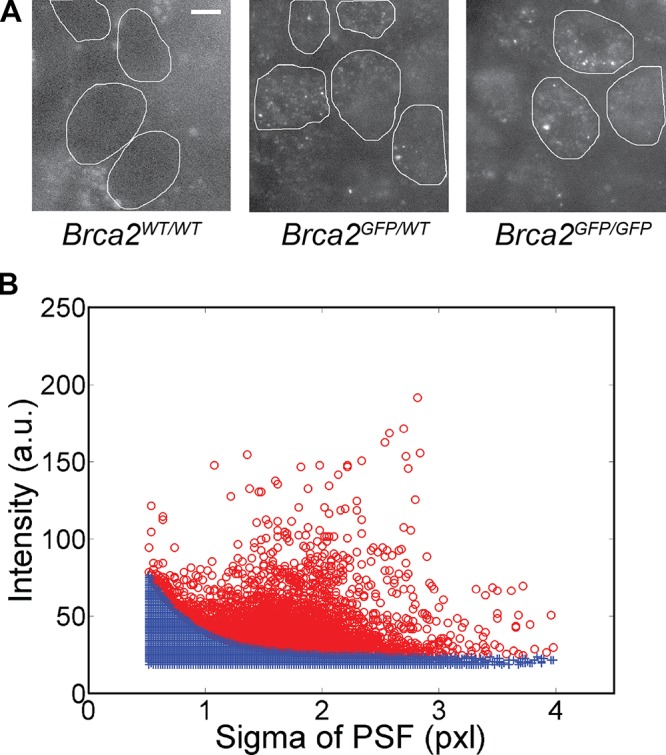
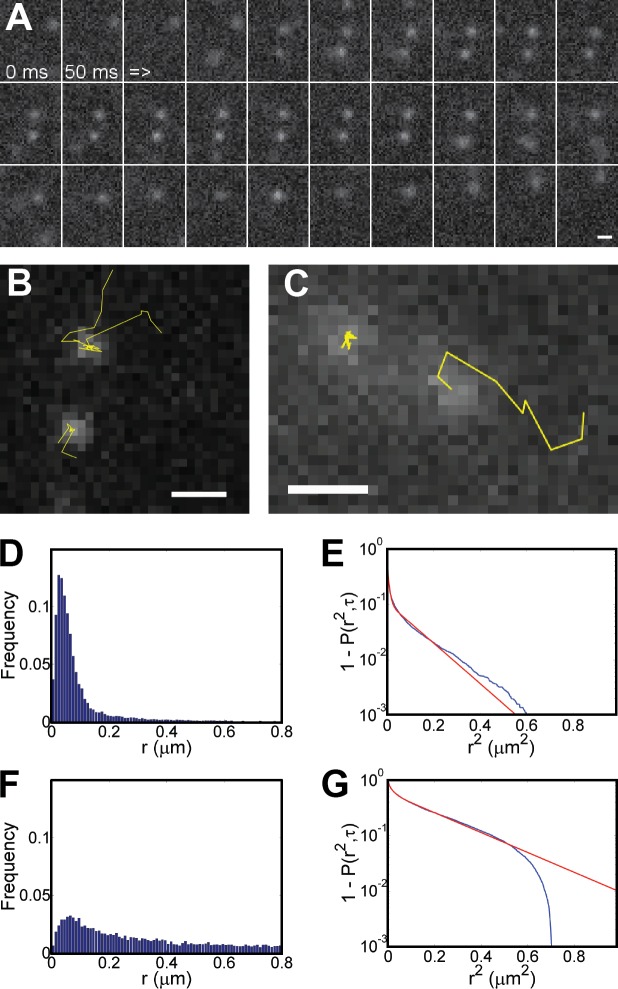
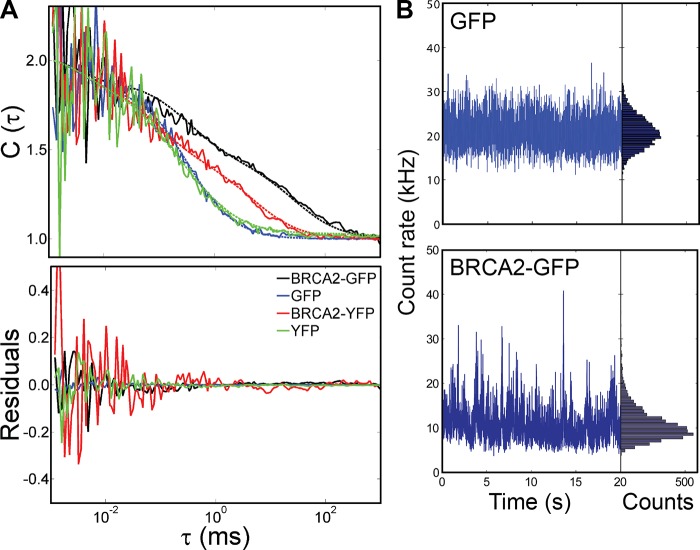
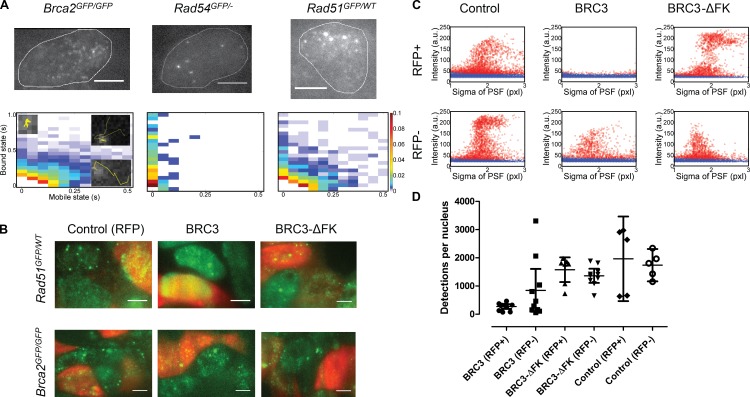
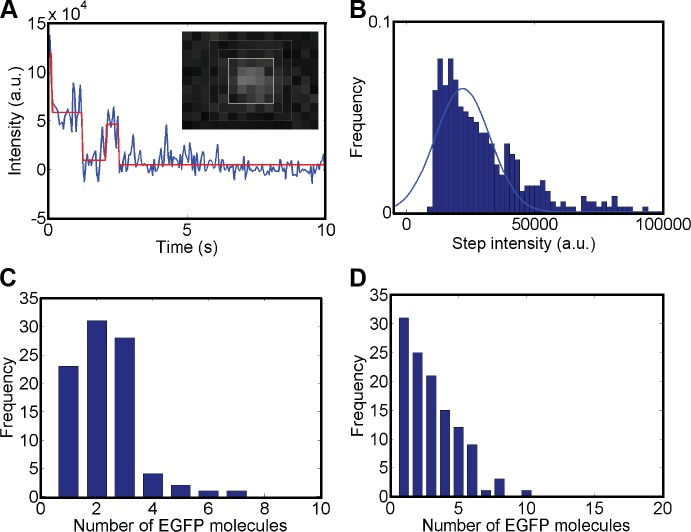
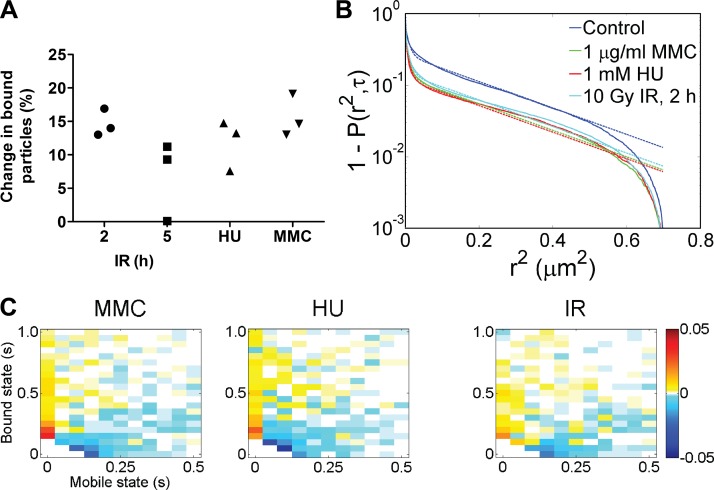
Genome maintenance by homologous recombination depends on coordinating many proteins in time and space to assemble at DNA break sites. To understand this process, we followed the mobility of BRCA2, a critical recombination mediator, in live cells at the single-molecule level using both single-particle tracking and fluorescence correlation spectroscopy. BRCA2-GFP and -YFP were compared to distinguish diffusion from fluorophore behavior. Diffusive behavior of fluorescent RAD51 and RAD54 was determined for comparison. All fluorescent proteins were expressed from endogenous loci. We found that nuclear BRCA2 existed in oligomeric clusters, and exhibited heterogeneous mobility. DNA damage increased BRCA2 transient binding, presumably including binding to damaged sites. Despite its very different size, RAD51 displayed mobility similar to BRCA2, which indicates physical interaction between these proteins both before and after induction of DNA damage. We propose that BRCA2-mediated sequestration of nuclear RAD51 serves to prevent inappropriate DNA interactions and that all RAD51 is delivered to DNA damage sites in association with BRCA2.


Figures

Figure 1.
Figure 1.
Single-molecule detections in live cells can be clearly identified. (A) Oblique laser illumination fluorescence images of the wild-type ES cells (Brca2WT/WT) and the heterozygous and homozygous Brca2-GFP knock-in cells. The nuclei of Brca2-GFP knock-in cells contain low-fluorescent diffusing and highly fluorescent bound particles. Brca2WT/WT cell nuclei lack a distinct fluorescence signal. Cell nuclei were manually demarcated based on bright-field and fluorescence images and are indicated by white lines. Bar, 5 µm. (B) Each detected pixel area above background was fitted with a 2D Gaussian PSF characterized by a sigma and an intensity value, here based on 8-bit images. The intensity-sigma data pairs were plotted for all detections from one image stack. The data shown are representative of multiple experimental repeats (the number of individual stacks is >200). Camera noise contributes false detections (blue crosses), also found in Brca2WT/WT cell nuclei and outside cell nuclei, which lie below an approximated exponential curve derived from this raw data (see Fig. S3 A). Remaining true detections are displayed as red circles. One pixel is 70 nm.
Figure 2.
Figure 2.
BRCA2 displays heterogeneous mobility. (A) An image sequence showing diffusion of two BRCA2 particles, coming from an area above or below the observed focal plane, with transient binding. Individual frames are separated by 50 ms. (B) Tracked BRCA2 particle trajectories from the sequence in A are displayed as yellow lines superimposed on the 14th frame. (C) Other BRCA2 tracks representative of mobile or bound species. Bars, 0.5 µm. (D and F) The histograms show all particle jumps r from tracks classified as either bound (D) or mobile (F), respectively. (E and G) From these histograms, CDFs, normalized between 1 and 0 and displayed as decay, were derived and subjected to fitting with three components. The blue and red lines represent raw and fitted data, respectively. The data shown, obtained under nondamaged conditions, are representative of multiple experimental repeats (n > 10). Each dataset is based on at least 20 cells.
Figure 3.
Figure 3.
Mobility of BRCA2 fusion proteins determined by FCS. (A) Autocorrelation curves C(τ) were fitted with a three-component model, for ES cells with homozygous BRCA2-GFP and BRCA2-YFP knock-ins and for ES cells transiently expressing GFP and YFP, as indicated by color. Raw and fitted data are shown as solid and broken lines, respectively. ACF curves were postnormalized between 1 and 2 for better comparison of the diffusion characteristics, but the residuals were left unchanged. (B) The intensity fluctuation raw data and the photon counting histograms are displayed for cells transiently expressing GFP at a low concentration and Brca2-GFP homozygous knock-in cells, using an integration time of 4 ms. Although the photon counting histogram for GFP-expressing cells is symmetric, the histogram for BRCA2-GFP is skewed, suggesting a heterogeneous BRCA2-GFP population consisting of BRCA2 oligomers with varying protein number. The data shown are representative of multiple experimental repeats (n = 10 cells).
Figure 4.
Figure 4.
BRCA2 and RAD51 display similar diffusive behavior in live cells that is disrupted by BRC3 overexpression. (A, top) Oblique illumination images of live cells expressing BRCA2-GFP, RAD51-GFP, and RAD54-GFP. Slowly diffusing particles were detected for both BRCA2 and RAD51. RAD54 was detected only as immobile clusters. Bars, 5 µm. (A, bottom) 2D histograms for all three proteins display the distribution of residence times in the mobile (particle jumps > 200 nm) and bound state (particle jumps < 200 nm) of all detected tracks. The insets illustrate representative tracks for characteristic different mobility behaviors and are also shown in Fig. 2 (B and C). The relative frequencies for tracks with the indicated times spent in the bound and mobile state are represented by the colors defined on the right. The number of acquired tracks was 4126 for BRCA2-GFP, 791 for RAD51-GFP, and 250 for RAD54-GFP, from at least four fields and 16 nuclei per sample. (B) Fluorescence images of cells transfected with BRC3 peptide expression vector and/or an RFP expression vector. Upon expression of BRC3-ΔFK peptide, which is deficient for RAD51 binding, slowly diffusing and transiently binding RAD51-GFP particles (green color channel) can be detected in Rad51GFP/WT cell nuclei. Upon BRC3 peptide expression, nuclei of most transfected cells now show bright, uniform RAD51-GFP fluorescence, indicating that BRCA2–RAD51 interactions are disrupted and RAD51 mobility is enhanced. BRC3 expression did not alter the mobile behavior of BRCA2-GFP. Bars, 5 µm. (C) Quantification of true detections (red circles) as in Fig. 1 B, in RFP-positive and -negative cells expressing BRC3, BRC3-ΔFK, or control transfection. Because of the relatively high RAD51 concentration (compared with BRCA2-GFP), and therefore enhanced fluorescence level, only relevant detections in the σ range of 1–3 were analyzed. Additionally, the exponential function was set off by 5 AU because the RFP+ BRC3 dataset did not have any detections to use for deriving a cutoff curve. Example data representative of individual video stacks are displayed. (D) Number of detections per condition (5–7 nuclei, number of initial detections: 5,000–12,000). The error bar represents the mean with the 95% confidence interval. Thus, BRC3-expressing cells have significantly fewer RAD51 detections than cells subjected to control transfection or BRC3-ΔFK expression.
Figure 5.
Figure 5.
BRCA2-GFP is oligomeric in cells. (A) Fluorescence intensity bleaching traces (blue line) from six fixed cells were acquired by integrating the fluorescence intensity of 5 × 5-pixel windows centered around an intensity maximum and corrected for background using the mean value of the surrounding 9 × 9 frame (gray; see inset). (B) A histogram of the steps (n = 360) obtained from the step-function fit (red line in A) was used to estimate the mean step size by fitting the distribution with a Gaussian function. This mean step size, as mean intensity per GFP, was used to determine the number of BRCA2-GFP molecules per fluorescent object in two different ways. (C) Steps larger or equal to this mean step size were counted; steps more than twice the size of this mean were calculated as two BRCA2-GFP molecules (n = 90 traces with at least one BRCA2-GFP). (D) Alternatively, the difference between initial and final intensity in the bleaching traces (n = 118 with at least one BRCA2-GFP) was divided by the mean step size to determine the number of molecules per BRCA2 cluster. The data shown are representative of multiple experimental repeats (n = 3).
Figure 6.
Figure 6.
BRCA2 mobility changes after DNA damage. (A) The percentage of additionally bound BRCA2 particles was determined by SPT analysis after induction of DNA damage: 2 and 5 h after exposure to 10 Gy IR, after 1 h treatment with 1 mM HU, and after 24 h treatment with 1 µg/ml MMC (from at least six fields, nine nuclei, and 457 individual tracks for each sample, well above 1,000 tracks for most conditions). In the absence of induced DNA damage, between 51 and 68% of the BRCA2 particles were bound. Three experimental replicates are shown for each treatment. (B) From all track segments, CDF curves were derived for the different DNA damage treatments (solid lines). Global fitting (broken lines) of the curves yielded three Dapp components, with D1 = 1.15 µm2/s, D2 = 0.05 µm2/s, and D3 = 0.003 µm2/s indicating mobility (D1) and transient binding interactions (D2 and D3). The percentage for these different mobility contributions shows that after DNA damage induced by IR, HU, and MMC, more of the observed BRCA2 is transiently bound, manifested as an amplitude decrease of D1 to 15%, 12%, and 13%, respectively, compared with the control condition (27%). (C) 2D difference histograms display mobility changes (yellow-red for increased frequency or blue for decreased frequency) after DNA damage indicating the shift to more immobile states compared with control (as shown in Fig. 4 A). In response to DNA damage, particles spend less time in the mobile state. Change in relative frequency is indicated by the colors defined on the right.

Similar articles

Cited by

References

    1. Abraham J., Lemmers B., Hande M.P., Moynahan M.E., Chahwan C., Ciccia A., Essers J., Hanada K., Chahwan R., Khaw A.K., et al. . 2003. Eme1 is involved in DNA damage processing and maintenance of genomic stability in mammalian cells. EMBO J. 22:6137–6147 10.1093/emboj/cdg580 - DOI - PMC - PubMed
    1. Abràmoff M.D., Magalhães P.J., and Ram S.J.. 2004. Image processing with ImageJ. Biophotonics International. 11:36–42.
    1. Adams D.J., Quail M.A., Cox T., van der Weyden L., Gorick B.D., Su Q., Chan W.I., Davies R., Bonfield J.K., Law F., et al. . 2005. A genome-wide, end-sequenced 129Sv BAC library resource for targeting vector construction. Genomics. 86:753–758 10.1016/j.ygeno.2005.08.003 - DOI - PubMed
    1. Agarwal S., van Cappellen W.A., Guénolé A., Eppink B., Linsen S.E., Meijering E., Houtsmuller A., Kanaar R., and Essers J.. 2011. ATP-dependent and independent functions of Rad54 in genome maintenance. J. Cell Biol. 192:735–750 10.1083/jcb.201011025 - DOI - PMC - PubMed
    1. Anastassiadis K., Fu J., Patsch C., Hu S., Weidlich S., Duerschke K., Buchholz F., Edenhofer F., and Stewart A.F.. 2009. Dre recombinase, like Cre, is a highly efficient site-specific recombinase in E. coli, mammalian cells and mice. Dis. Model. Mech. 2:508–515 10.1242/dmm.003087 - DOI - PubMed

Publication types