. 2014 Dec 15;211(13):2507-17.
doi: 10.1084/jem.20140137. Epub 2014 Dec 8.

Thromboxane A2 acts as tonic immunoregulator by preferential disruption of low-avidity CD4+ T cell-dendritic cell interactions

Affiliations

Thromboxane A2 acts as tonic immunoregulator by preferential disruption of low-avidity CD4+ T cell-dendritic cell interactions

Federica Moalli et al. J Exp Med. .

Abstract

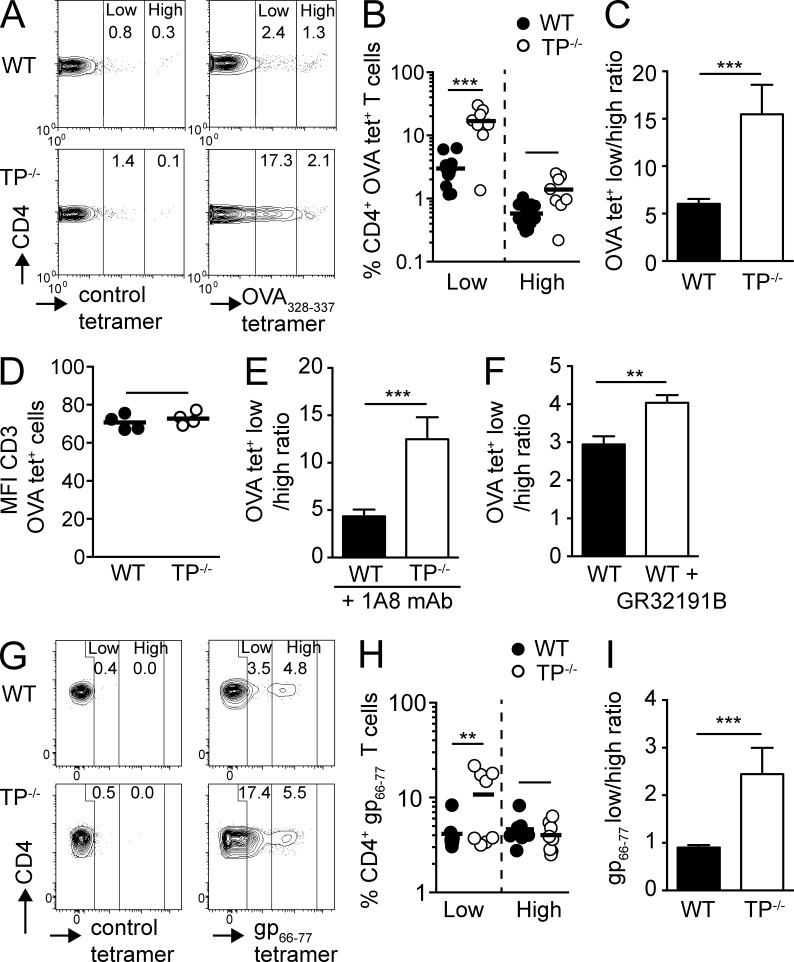
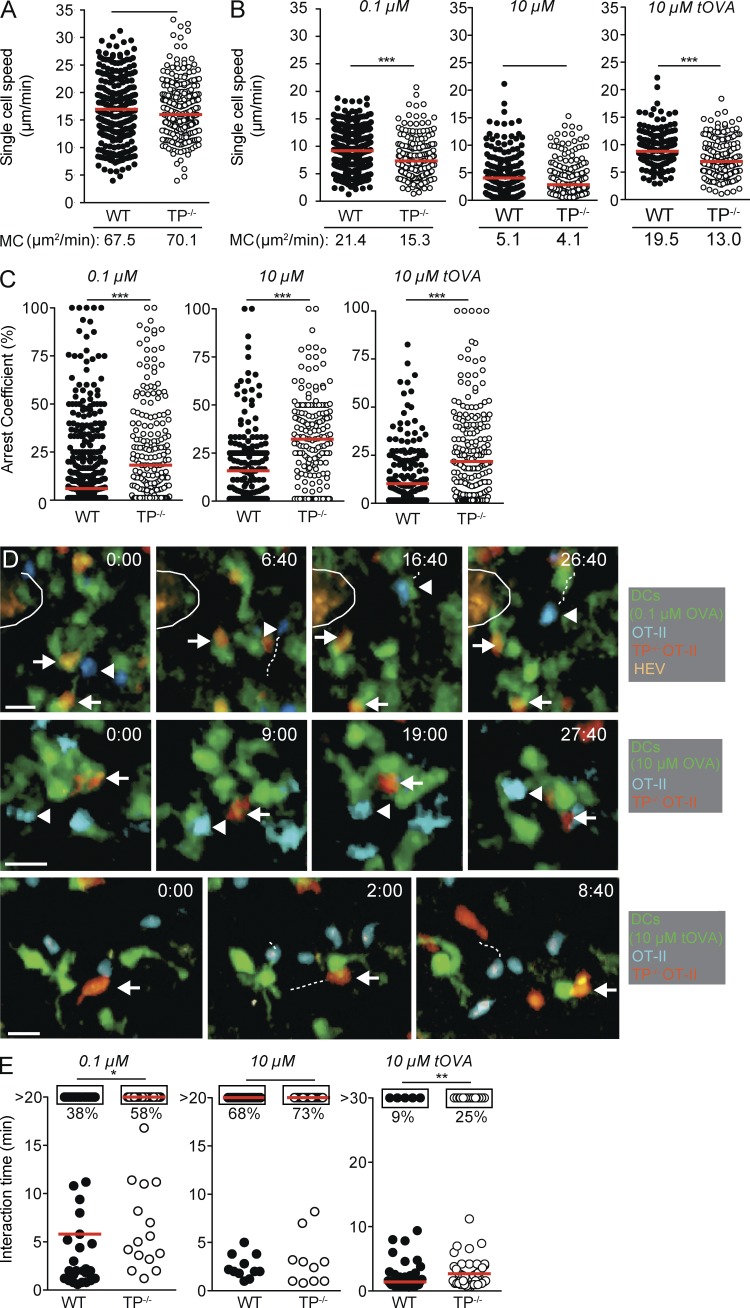
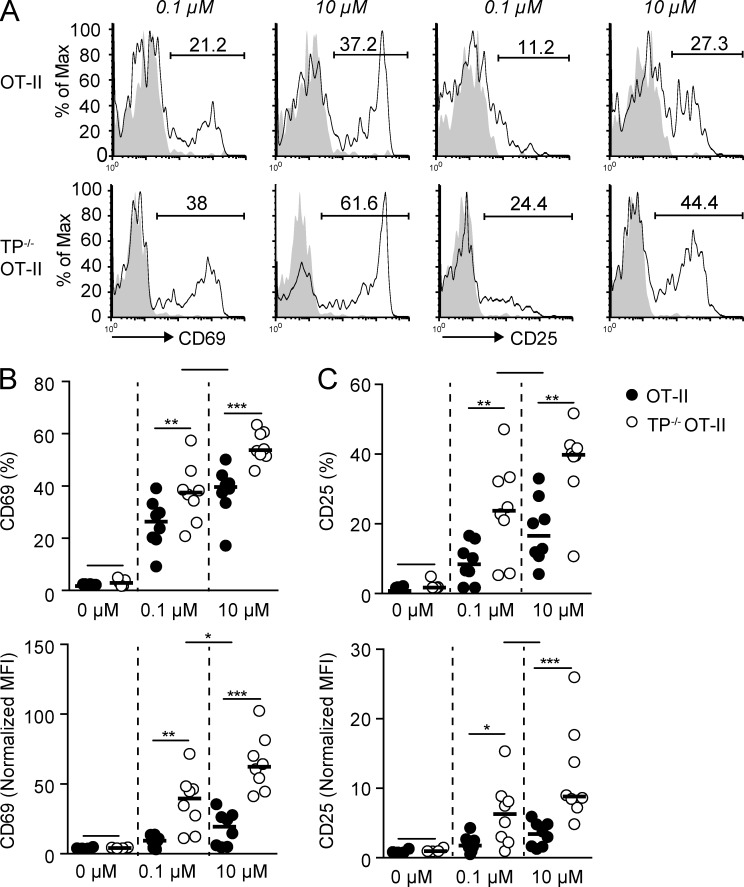
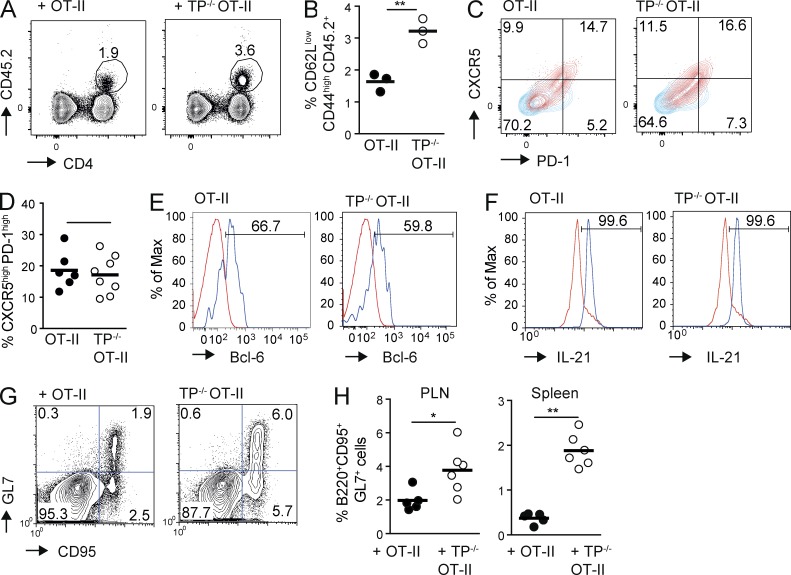
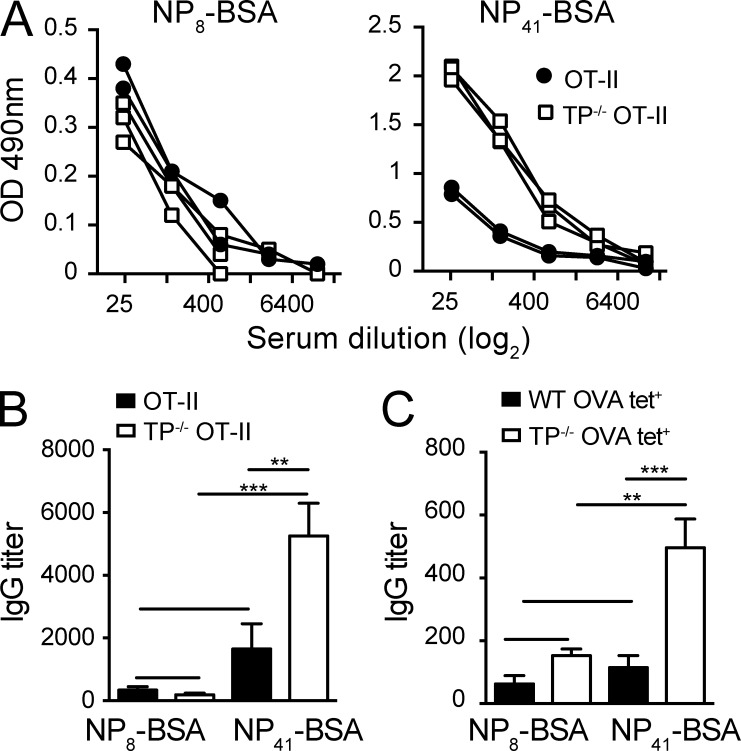
Interactions between dendritic cells (DCs) and T cells control the decision between activation and tolerance induction. Thromboxane A2 (TXA2) and its receptor TP have been suggested to regulate adaptive immune responses through control of T cell-DC interactions. Here, we show that this control is achieved by selectively reducing expansion of low-avidity CD4(+) T cells. During inflammation, weak tetramer-binding TP-deficient CD4(+) T cells were preferentially expanded compared with TP-proficient CD4(+) T cells. Using intravital imaging of cellular interactions in reactive peripheral lymph nodes (PLNs), we found that TXA2 led to disruption of low- but not high-avidity interactions between DCs and CD4(+) T cells. Lack of TP correlated with higher expression of activation markers on stimulated CD4(+) T cells and with augmented accumulation of follicular helper T cells (TFH), which correlated with increased low-avidity IgG responses. In sum, our data suggest that tonic suppression of weak CD4(+) T cell-DC interactions by TXA2-TP signaling improves the overall quality of adaptive immune responses.


Figures

Figure 1.
Figure 1.
Absent TP signaling results in enhanced expansion of low-avidity CD4+ T cells during inflammation. (A–D) WT and TP−/− mice were immunized with OVA/CFA, and OVA-specific CD4+ T cells in the draining peripheral LNs (PLNs) were analyzed on day 8 by tetramer staining. (A) Representative flow cytometry plots of polyclonal WT versus TP−/− CD4+ T cells after gating on CD4+ T cells and staining with control or OVA-specific tetramers. Numbers indicate percentage of CD4+ T cells in low and high tet+ gates. (B) Percentages of low and high OVA tet+ CD4+ T cells. (C) Ratio of low versus high OVA tet+ CD4+ T cells. (D) MFI of CD3 expression on OVA tet+ WT and TP−/− T cells. (E and F) Mice were immunized as in A–D. Neutrophils were depleted by injecting anti-Ly6G antibody (1A8) on day −1 (E) or mice were treated with a selective thromboxane receptor antagonist (GR32191B) for 9 d starting 1 d before immunization (F). Ratio of low versus high OVA tet+ CD4+ T cells in draining PLNs at day 8 are shown. (G–I) WT and TP−/− were infected with LCMV Armstrong, and CD4+ T cells in spleen were analyzed on day 8. (G) Representative flow cytometry plots of control and gp66-77 tet+ CD4+ T cells. Numbers indicate percentage of 7AAD CD4+ T cells in low and high tet+ gates. (H) Percentages of low versus high gp66-77 tet+ CD4+ T cells. (I) Ratio of low versus high gp66-77 tet+ CD4+ T cells. Data in B, C, and E are pooled from two independent experiments with a total of 4–7 mice per condition and combined staining of each sample with two different OVA tetramers, whereas D and F show representative data from one of two independent experiments with comparable results (3–4 mice/group). Data in G–I are pooled from two independent experiments with a total of 8 mice/group. Data in B and H were analyzed using ANOVA with Sidak’s post-test, whereas C–F and I were analyzed using the Mann-Whitney test and are shown ±SEM. **, P < 0.01; ***, P < 0.001.
Figure 2.
Figure 2.
Intravital imaging of WT versus TP−/− OT-II CD4+ T cell interactions with pMHC-loaded DCs. (A–E) Polyclonal WT and TP−/− T cells were adoptively transferred in the absence of s.c. injected DCs (A) or WT and TP−/− OT-II CD4+ T cells were transferred in presence of DCs pulsed with indicated OVA323-339 or turkey (t)OVA324-340 (B–E). Single cell speeds and MC of adoptively transferred cells (A and B), their arrest coefficient (C) and T cell–DC interaction times (E) were monitored by 2PM imaging. D shows representative 2PM images of DC interactions with WT (arrowheads) and TP−/− OT-II CD4+ T cells (arrows). An encircled HEV is seen in the top row. Time is shown in minutes and seconds. Bar, 10 µm. Each dot represents one track (A–C) or interaction (E). Data in A–C and E are pooled from at least two independent experiments and were analyzed by Mann-Whitney test. Red bars indicate median. *, P < 0.05; **, P < 0.01; ***, P < 0.001.
Figure 3.
Figure 3.
TP−/− OT-II CD4+ T cells display increased activation marker expression as compared with WT OT-II CD4+ T cells. (A-C) WT and TP−/− OT-II CD4+ T cells were analyzed by flow cytometry 24 h after adoptive transfer in presence of DCs pulsed with low (0.1 µM) and high (10 µM) OVA323-339 concentrations. A shows representative flow cytometry plots of CD25 and CD69 expression. Numbers indicate percent positive cells. Percentages and normalized MFI of CD69+ (B) and CD25+ (C) transferred WT and TP−/− OT-II CD4+ T cells are shown. Each dot in B and C represents PLNs pooled from one mouse. Data are from 2–3 independent experiments with a total of 6–8 mice and analyzed using repeated measure ANOVA with Bonferroni post-test. Bars indicate mean. *, P < 0.05; **, P < 0.01; ***, P < 0.001.
Figure 4.
Figure 4.
Increased numbers of TFH in the absence of TP in OT-II CD4+ T cells. (A–H) WT and TP−/− OT-II CD4+ T cells were adoptively transferred separately (A–D and F–H) or combined (E) into CD45.1+ WT mice before immunization with OVA/CFA and analyzed on day 8 by flow cytometry. (A) Flow cytometry after pregating on CD44high CD62Llow lymphocytes. Numbers indicate the percentage of circled CD45.2+ cells. (B) Percentage of adoptively transferred CD45.2+ T cells as pregated in A. (C) PD-1 and CXCR5 expression on transferred WT and TP−/− OT-II T cells (red), with numbers indicating percent per quadrant field. CD4+ T cells from a nonimmunized mouse serve as negative control (blue). (D) Percentage of PD-1high CXCR5high CD45.2+ WT or TP−/− OT-II CD4+ T cells on day 8 after OVA/CFA immunization. Shown is one of three experiments, pooling TFH from spleens and PLNs of 3–4 mice on day 8 after OVA/CFA immunization. (E) Flow cytometric analysis of intracellular bcl-6 expression (blue) in PD-1high CXCR5high WT or TP−/− OT-II CD4+ T cells on day 8 after OVA/CFA immunization. As negative control, we plotted the endogenous CD45.1+ CD4+ cell signal (red), which gave an overlapping labeling as the isotype control (not depicted). (F) Flow cytometric analysis of intracellular IL-21 expression (blue) in CXCR5high WT or TP−/− OT-II CD4+ T cells on day 8 after OVA/CFA immunization. As negative control, we plotted the CD45.1+ CD4+ cell signal from a nonimmunized mouse (red), which gave an overlapping labeling as the isotype control (not depicted). (G) Flow cytometry plots of B220+ cells containing GL-7+ CD95+ GC B cells in WT or TP−/− OT-II T cell recipient mice on day 8 after OVA/CFA immunization with numbers indicating percent per quadrant field. (H) Percentage of GC B cells in WT or TP−/− OT-II T cell recipient mice 8 d after OVA/CFA immunization in PLNs and spleen. Each dot represents one mouse. Data are representative of three (A–F) or pooled from two (H) independent experiments with a total of 9–10 and 5–6 mice, respectively, and analyzed using Mann-Whitney test (B, D, and H). Bars indicate mean. *, P < 0.05; **, P < 0.01.
Figure 5.
Figure 5.
TP−/− CD4+ T cells preferentially support low-avidity IgG responses. WT or TP−/− OT-II CD4+ T cells (A and B) or OVA-tet+ WT or TP−/− CD4+ T cells (C) were adoptively transferred into SMARTA recipients before immunization with NP16-OVA/CFA. On day 8 after infection, serum was isolated and IgG titers against NP8-BSA and NP41-BSA were measured in limited dilution assays. (A) Each line presents a dilution series of serum isolated from an individual mouse. (B) IgG titers to NP8- and NP41-BSA after transfer of WT or TP−/− OT-II CD4+ T cells. (C) IgG titers to NP8- and NP41-BSA after transfer of OVA-tet+ WT or TP−/− CD4+ T cells. Data in B and C are pooled from two independent experiments with 4–5 mice/group and analyzed by ANOVA with Sidak’s multiple comparison test. **, P < 0.01; ***, P < 0.001.

Similar articles

Cited by

References

    1. Bajénoff M., and Germain R.N.. 2007. Seeing is believing: a focus on the contribution of microscopic imaging to our understanding of immune system function. Eur. J. Immunol. 37:S18–S33 10.1002/eji.200737663 - DOI - PubMed
    1. Bousso P.2008. T-cell activation by dendritic cells in the lymph node: lessons from the movies. Nat. Rev. Immunol. 8:675–684 10.1038/nri2379 - DOI - PubMed
    1. Cahalan M.D., and Parker I.. 2006. Imaging the choreography of lymphocyte trafficking and the immune response. Curr. Opin. Immunol. 18:476–482 10.1016/j.coi.2006.05.013 - DOI - PMC - PubMed
    1. Fazilleau N., McHeyzer-Williams L.J., Rosen H., and McHeyzer-Williams M.G.. 2009. The function of follicular helper T cells is regulated by the strength of T cell antigen receptor binding. Nat. Immunol. 10:375–384 10.1038/ni.1704 - DOI - PMC - PubMed
    1. Germain R.N.2012. Maintaining system homeostasis: the third law of Newtonian immunology. Nat. Immunol. 13:902–906 10.1038/ni.2404 - DOI - PMC - PubMed

Publication types

MeSH terms