. 2015 Apr 1;24(7):1929-44.
doi: 10.1093/hmg/ddu609. Epub 2014 Dec 8.

A novel manganese-dependent ATM-p53 signaling pathway is selectively impaired in patient-based neuroprogenitor and murine striatal models of Huntington's disease

Affiliations

A novel manganese-dependent ATM-p53 signaling pathway is selectively impaired in patient-based neuroprogenitor and murine striatal models of Huntington's disease

Andrew M Tidball et al. Hum Mol Genet. .

Abstract

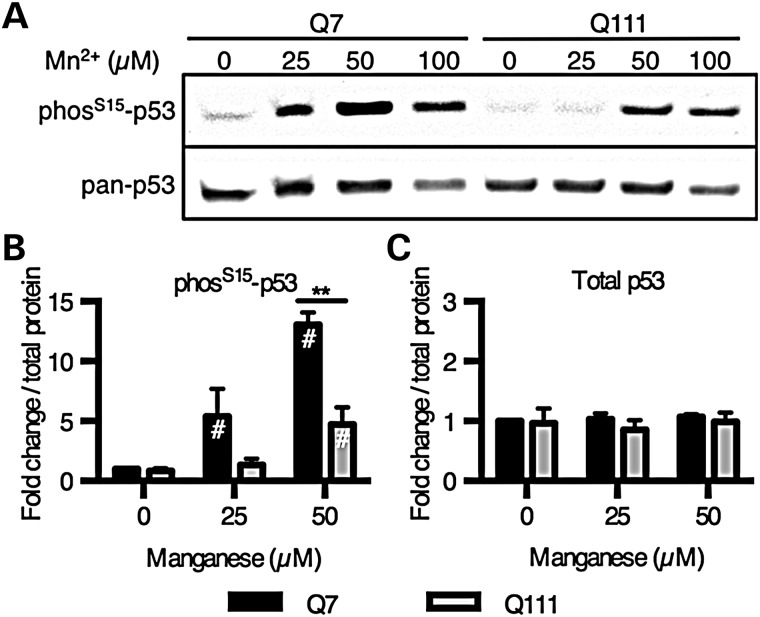
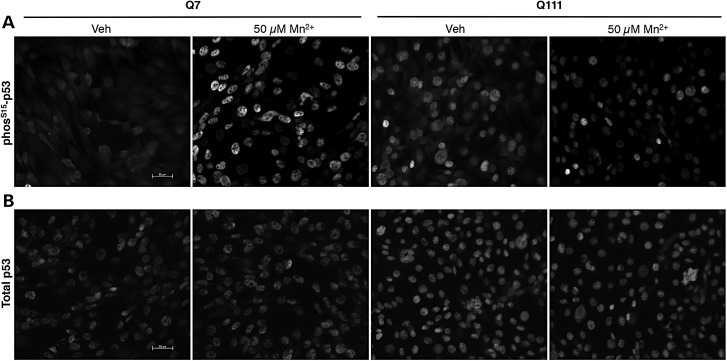
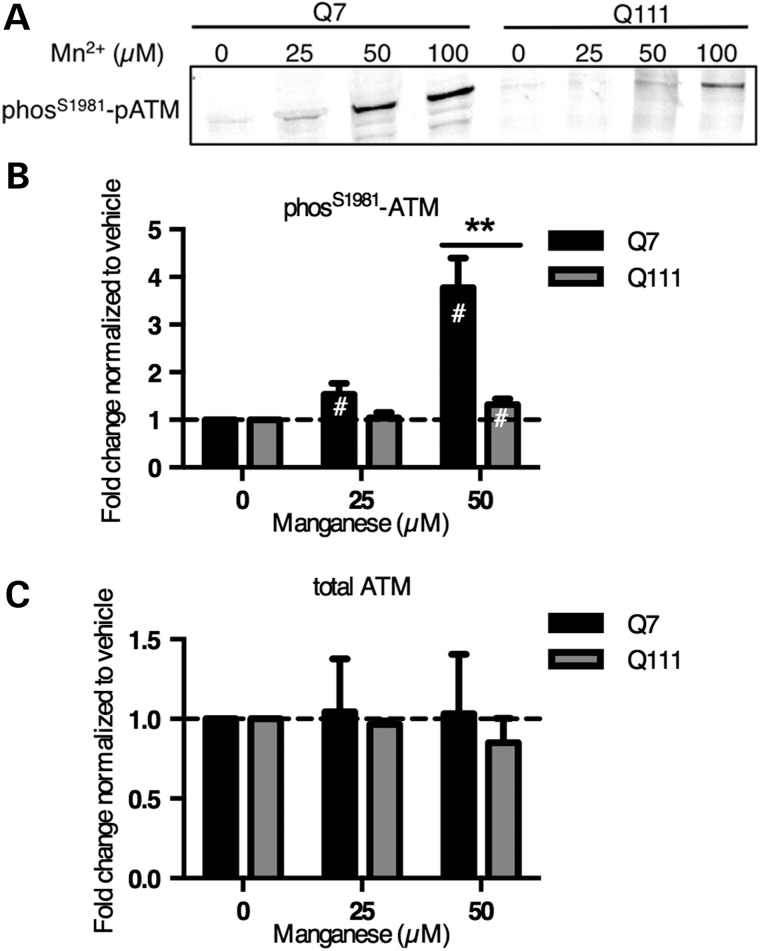
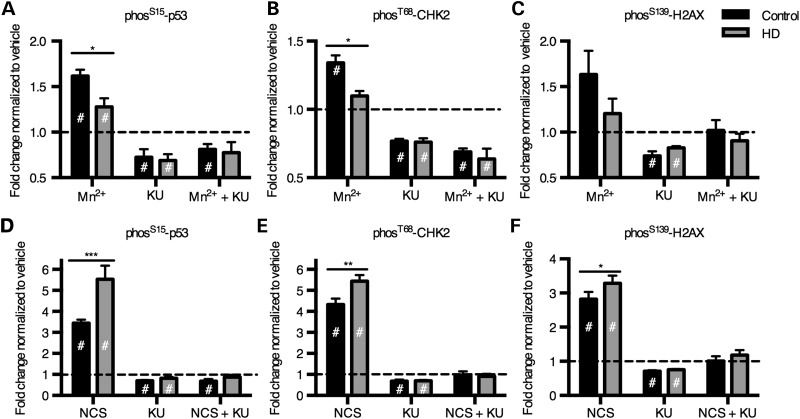
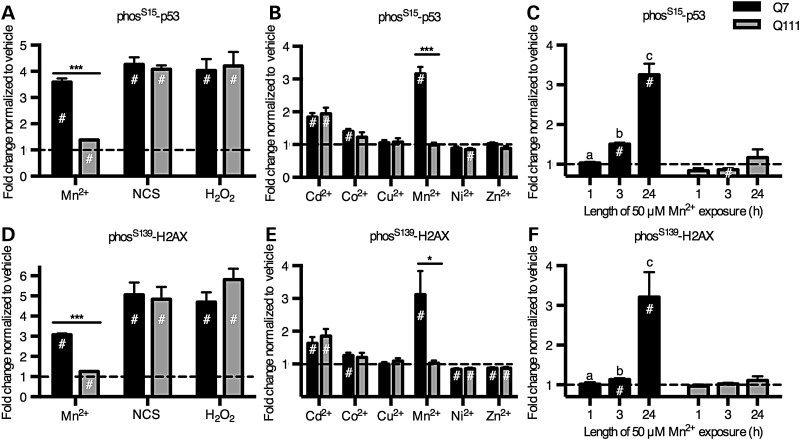
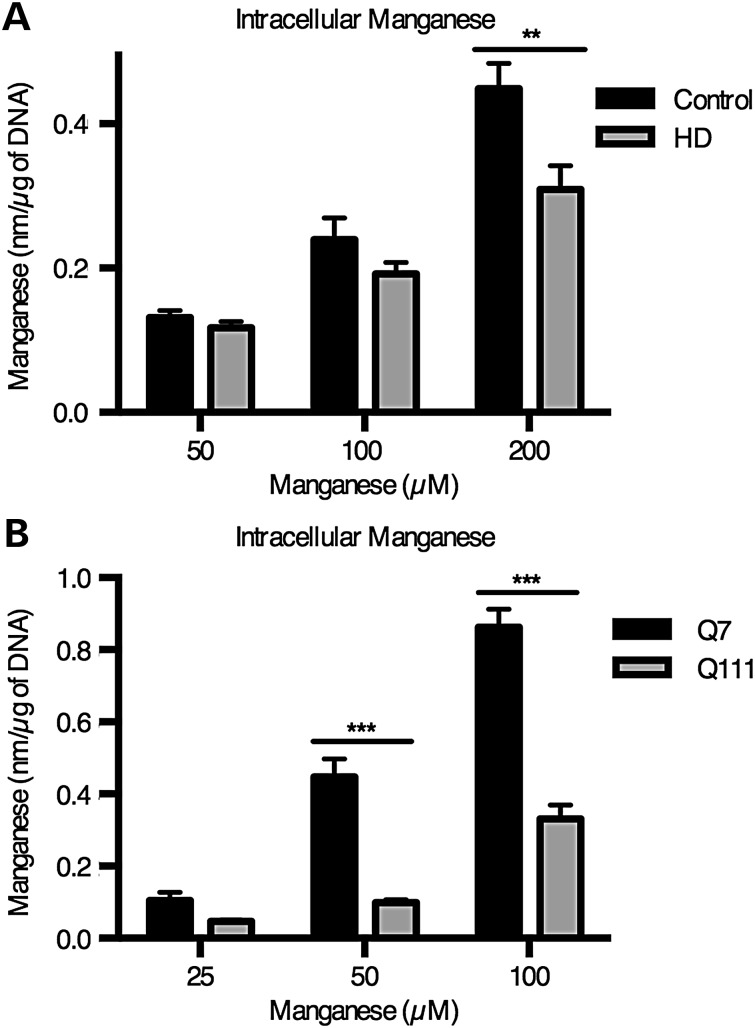
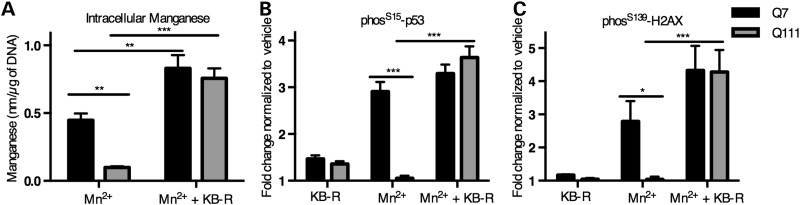
The essential micronutrient manganese is enriched in brain, especially in the basal ganglia. We sought to identify neuronal signaling pathways responsive to neurologically relevant manganese levels, as previous data suggested that alterations in striatal manganese handling occur in Huntington's disease (HD) models. We found that p53 phosphorylation at serine 15 is the most responsive cell signaling event to manganese exposure (of 18 tested) in human neuroprogenitors and a mouse striatal cell line. Manganese-dependent activation of p53 was severely diminished in HD cells. Inhibitors of ataxia telangiectasia mutated (ATM) kinase decreased manganese-dependent phosphorylation of p53. Likewise, analysis of ATM autophosphorylation and additional ATM kinase targets, H2AX and CHK2, support a role for ATM in the activation of p53 by manganese and that a defect in this process occurs in HD. Furthermore, the deficit in Mn-dependent activation of ATM kinase in HD neuroprogenitors was highly selective, as DNA damage and oxidative injury, canonical activators of ATM, did not show similar deficits. We assessed cellular manganese handling to test for correlations with the ATM-p53 pathway, and we observed reduced Mn accumulation in HD human neuroprogenitors and HD mouse striatal cells at manganese exposures associated with altered p53 activation. To determine if this phenotype contributes to the deficit in manganese-dependent ATM activation, we used pharmacological manipulation to equalize manganese levels between HD and control mouse striatal cells and rescued the ATM-p53 signaling deficit. Collectively, our data demonstrate selective alterations in manganese biology in cellular models of HD manifest in ATM-p53 signaling.


Figures

Figure 1.
Figure 1.
Differentiation of iPSCs into early striatal-like neuroprogenitors. (A) Immunofluorescent staining of HD iPSC line HD70-2 for markers of pluripotency. (B) PCR for the Huntingtin gene including the CAG repeat region. The lower bands are the non-pathogenic alleles, and the larger bands are pathogenic. All iPSC lines show similar sizes to the fibroblast lines from which the iPSCs were generated except HD180-6, which shows an expanded CAG repeat size. (C) The PluriTest analysis was used to validate the mRNA microarray profile from our iPSC lines, and all lines (CE-6, CF-1, CF-3, HD70-2, HD180-4, and HD180-6 are plotted here) had similar pluripotency profiles, including a teratoma-validated iPSC line. (CA-6) (D) Control (CA-24) and HD (HD180-2) iPSCs were differentiated to early forebrain neuroprogenitors by the dual-SMAD small molecule technique with and without purmorphamine (SHH agonist) and were immunostained for ISL1 (red), a marker of striatal progenitors, with nuclei labeled with Hoechst dye (blue). (E) Expression of markers of neurodevelopment was measured by qRT-PCR from the CF-3 control cells differentiated with and without purmorphamine. **P < 0.01 and ***P < 0.001 by t-test. N = 4. Mean ± SEM.
Figure 2.
Figure 2.
Manganese-induced loss of viability in human neuroprogenitors is unaffected by mutant Huntingtin and not via apoptotic signaling. (A and B) The cell viability assay, CellTiterBlue, was performed on human neuroprogenitors (A) and mouse STHdh striatal cells (B). The signals were normalized by defining the vehicle-treated cells as 100% viability. Arrowheads denote concentrations chosen for the Pathscan array. (N = 6 for control and 5 for HD in human neuroprogenitors and N = 6 wells in mouse striatal cells). (B) Cleavage of PARP was quantified by the Pathscan Intracellular Signaling array from samples treated with manganese (N = 2 for human and 3 for mouse). (C) Cleavage of Caspase-3 was quantified by the Pathscan Intracellular Signaling array from samples treated with manganese (N = 2 for human and 3 for mouse). Values are relative to vehicle-treated samples. For genotype comparisons ***P < 0.001 by t-test. Bars, mean + SEM (A, C and D) and SD (B).
Figure 3.
Figure 3.
PathScan ELISA array shows manganese-induced phospho-p53(S15) at sub-cytotoxic manganese concentrations. (A) Human cells were exposed for 24 h to 200 µm Mn2+. N = 2 for control (CE-6 and CF-1, once each) and HD (HD70-2 and HD180-6, once each). (B) Mouse STHdh striatal cells (Q7 and Q111) cells were exposed for 24 h to 50 µm Mn2+. (A and B) Phosphorylation and cleavage events were measured by the Fluorescent PathScan Intracellular Signaling Array sandwich ELISA. Background from a no protein sample was subtracted, and signals were divided by the mean of the untreated samples by genotype. The array was imaged and quantified using an Odyssey IR imager. Antibodies whose signal was <4 times the background were not plotted. For both human and STHdh cells this included phosphorylation at Stat1-Tyr701, HSP27-Ser78, p38-Thr180/Tyr182, PARP-1 cleavage and caspase-3 cleavage. For human cells (A) phosphorylation at Stat3-Tyr70 was below detection, and phosphorylation of mTOR-Ser2448, p70 S6 Kinase-Thr389 and SAPK/JNK-Thr183/Tyr185 were below detection for the mouse striatal cells (B). #P < 0.05 compared with vehicle-treated by t-test. For genotype comparisons *P < 0.05 and **P < 0.01 by t-test. Bars, mean + SEM.
Figure 4.
Figure 4.
HD striatal progenitors show reduced manganese-dependent p53(S15) phosphorylation. (A) Human cells exposed to manganese were probed by western blot for phospho-p53(S15) and total p53. (B and C) Western blot data were quantified and demonstrate significant differences in p53 phosphorylation between genotypes. N = 4 for control (CE-6 and CF-1, twice each) and HD (HD70-2 and HD180-4, twice each). #P < 0.05 compared with vehicle-treated by t-test. *P < 0.05 and ***P < 0.001 by t-test. Bars, mean + SEM.
Figure 5.
Figure 5.
HD mouse striatal cells show reduced manganese-dependent p53(S15) phosphorylation. (A) Mouse STHdh striatal cells exposed to manganese for 24 h were probed by western blot for phospho-p53(S15) and total p53. (B and C) Western blot data were quantified and demonstrate significant differences in p53 phosphorylation between genotypes (N = 3). #P < 0.05 compared with vehicle-treated by t-test. The p53 phosphorylation data for 100 µm Mn was not quantified because of increased cell viability loss seen in Figure 2B. **P < 0.01 by t-test. Bars, mean + SEM.
Figure 6.
Figure 6.
HD mouse striatal cells show reduced manganese-dependent p53(S15) phosphorylation by immunostaining with nuclear p53 localization. Mouse STHdh striatal cells were exposed to vehicle or 50 µm manganese for 24 h followed by immunofluorescence for either phos-p53(S15) (A) or total p53 (B).
Figure 7.
Figure 7.
HD mouse striatal cells show reduced manganese-dependent ATM(S1981) phosphorylation. (A) Mouse STHdh striatal cells exposed to manganese for 24 h were probed by western blot for phospho-ATM(S1981). (B) Western blot data were quantified and demonstrate significant differences in ATM phosphorylation between genotypes (N = 6). (C) Western blot quantification of total ATM showed no statistical effect of manganese exposure (N = 3). #P < 0.05 compared with vehicle-treated by t-test. The p53 phosphorylation data for 100 µm Mn was not quantified because of increased cell viability loss seen in Figure 2B. **P < 0.01 by t-test. Bars, mean + SEM.
Figure 8.
Figure 8.
Manganese induces phosphorylation of 3 ATM targets, which is blocked by ATM kinase inhibitor, KU-55933. ‘In-Cell Western’ was performed on human neuroprogenitors for phosS15-p53 (A and D), phosT68-CHK2 (B and E) and phosS139-H2AX (i.e. γ-H2AX) (C and F) with exposure to Mn at 200 µm (A–C) or DNA-damaging agent, neocarzinostatin at 100 ng/ml (NCS) (D–F). The cells were also exposed to ATM inhibitor, KU-55933 at 1 µm. N = 4 for control (CE-6, CF-3; two experiments each) and N = 4 for HD (HD70-2, HD180-4; 2 experiments each). #P < 0.05 compared with vehicle-treated by t-test. *P < 0.05, **P < 0.01 and ***P < 0.001 for t-test between genotypes.
Figure 9.
Figure 9.
Mutant Huntingtin only inhibits manganese-dependent ATM target phosphorylation. (A and D) Mouse STHdh striatal cells (Q7 and Q111) were exposed to manganese (50 µm) for 24 h, neocarzinostatin (NCS, 100 ng/ml) for 1 h or hydrogen peroxide (H2O2, 250 µm) for 1 h. (B and E) Mouse striatal cells were exposed for 24 h to several divalent metal cations all at 50 µm, except 100 µm Cu2+ and 20 µm Cd2+. The means are normalized by the vehicle mean for that line to allow for easier genotype comparisons. (C and F) Mouse striatal cells were also exposed to manganese (50 µm) for increasing amounts of time. Significant differences are designated as: a is significantly different from b and b is significantly different from c. If no letters are listed, then none of the means are significantly different from one another. # indicates significantly different from vehicle treated (P < 0.05 by Tukey's post hoc). N = 3 for means from 3 to 5 wells for independent replicate experiments (A–C). N = 4 for means from 3 to 5 wells for independent replicate experiments (D–F). *P < 0.05 and ***P < 0.001 for t-test between genotypes. Bars, mean ± SEM.
Figure 10.
Figure 10.
Reduced accumulation of manganese in neuroprogenitors expressing mutant Huntingtin. (A) Accumulation of intracellular manganese was quantified by cellular fura-2 manganese extraction assay (CFMEA) in human neuroprogenitors that were exposed for 24 h to manganese. For human N = 4 for control (CE-6 and CF-1, twice each) and HD (HD70-2 and HD180-4, twice each). (B) The same procedure was performed on mouse STHdh cells (Q7 and Q111) with N = 3. For genotype comparisons **P < 0.01 and ***P < 0.001 by t-test. Bars, mean + SEM.
Figure 11.
Figure 11.
Pharmacological equalization of manganese content results in similar p53(S15) and pH2AX(S139) phosphorylation. (A) Mouse STHdh cells (Q7 and Q111) were treated for 24 h with manganese (50 µm) with or without the NCX inhibitor KB-R7943. Intracellular manganese accumulation was measured by the CFMEA technique. N = 3 independent experiments. (B and C) The same treatment paradigm was used for In-Cell Western analysis to quantify the phosphorylation of p53 and H2AX. N = 4 independent experiments for (B) and N = 3 independent experiments for (C). For genotype comparisons *P < 0.05, **P < 0.01 and ***P < 0.001 by t-test. Bars, mean + SEM.

References

    1. Zuccato C., Valenza M., Cattaneo E. Molecular mechanisms and potential therapeutical targets in Huntington’s disease. Physiol. Rev. 2010;90:905–981. - PubMed
    1. Wexler N.S. Venezuelan kindreds reveal that genetic and environmental factors modulate Huntington’s disease age of onset. Proc. Natl. Acad. Sci. U. S. A. 2004;101:3498–3503. - PMC - PubMed
    1. Gusella J.F., MacDonald M.E. Huntington’s disease: the case for genetic modifiers. Genome Med. 2009;1:80. - PMC - PubMed
    1. Georgiou N., Bradshaw J.L., Chiu E., Tudor A., O'Gorman L., Phillips J.G. Differential clinical and motor control function in a pair of monozygotic twins with Huntington’s disease. Mov. Disord. 1999;14:320–325. - PubMed
    1. Anca M., Gazit E., Loewenthal R., Ostrovsky O., Frydman M., Giladi N. Different phenotypic expression in monozygotic twins with Huntington disease. Am. J. Med. Genet. A. 2004;124:89–91. - PubMed

Publication types

MeSH terms

Substances