. 2014 Dec 30;111(52):18428-35.
doi: 10.1073/pnas.1421056111. Epub 2014 Dec 8.

Place cells in the hippocampus: eleven maps for eleven rooms

Affiliations

Place cells in the hippocampus: eleven maps for eleven rooms

Charlotte B Alme et al. Proc Natl Acad Sci U S A. .

Abstract

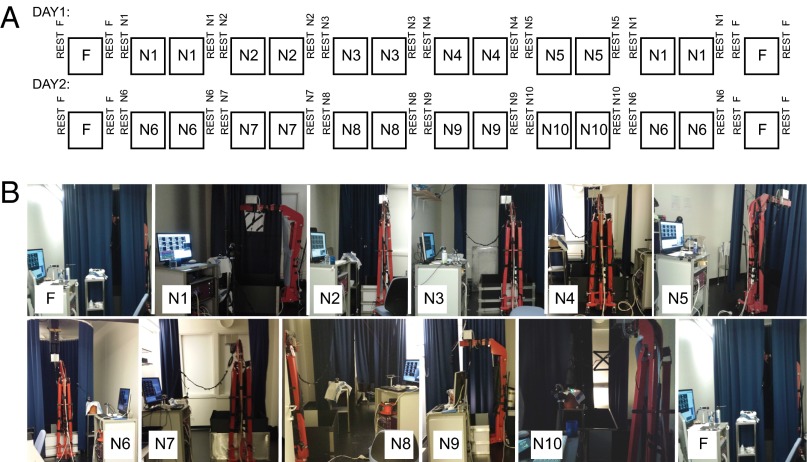
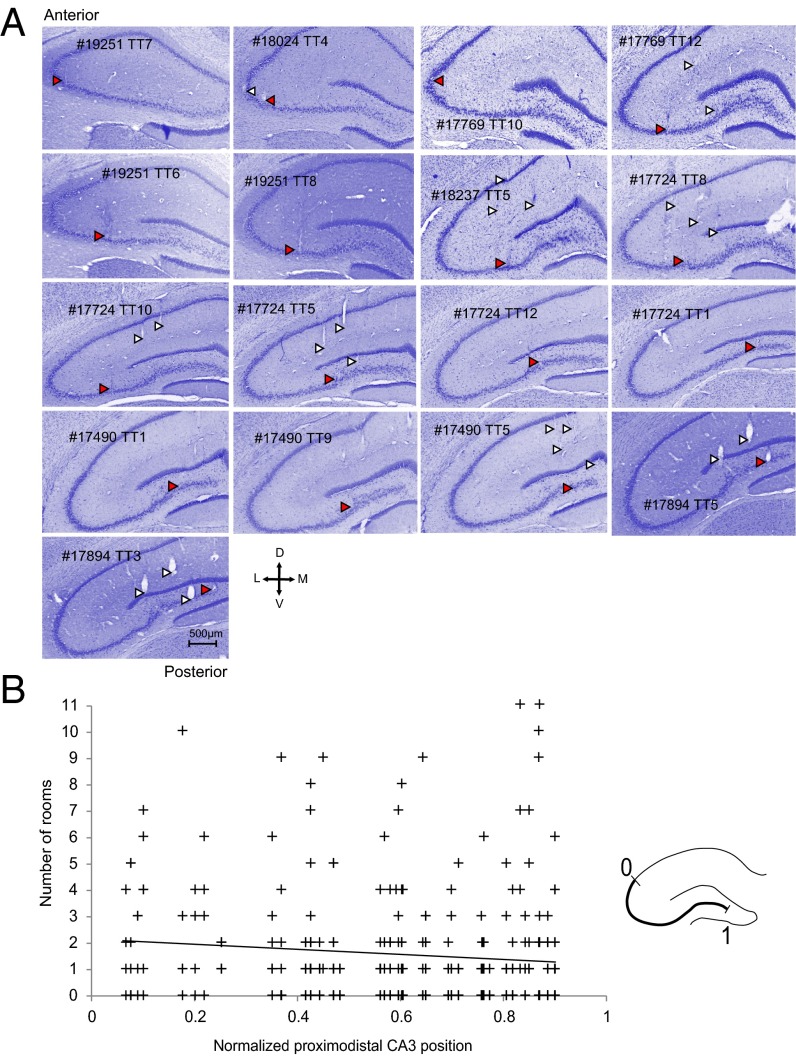
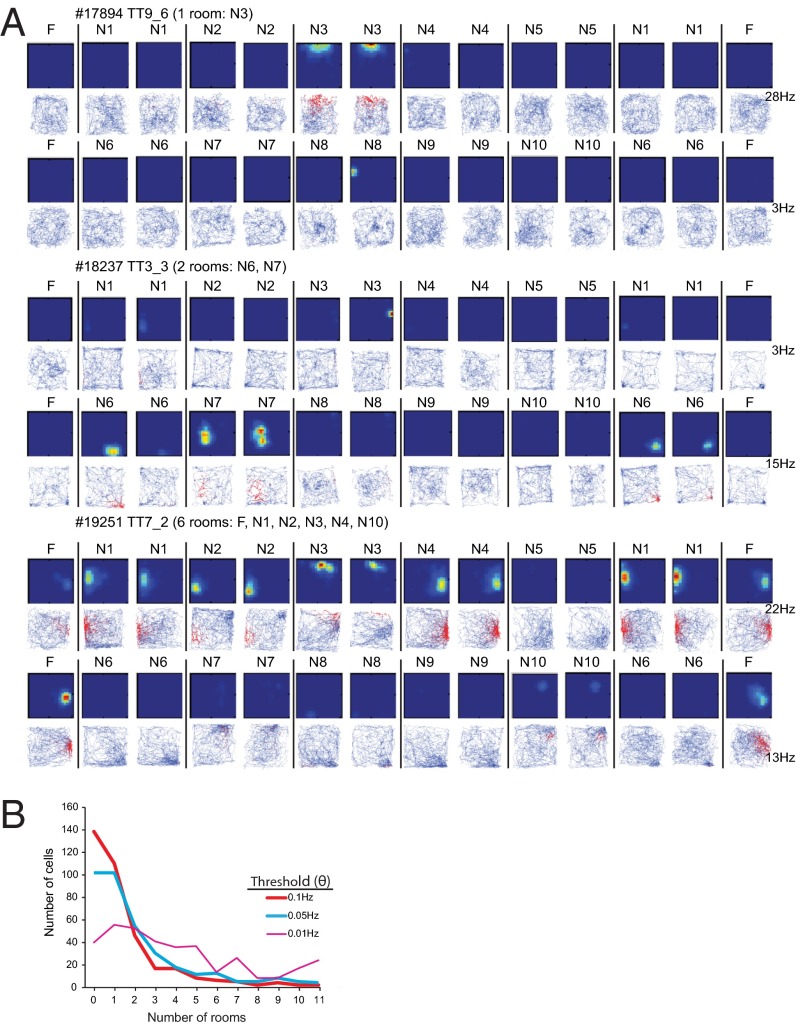
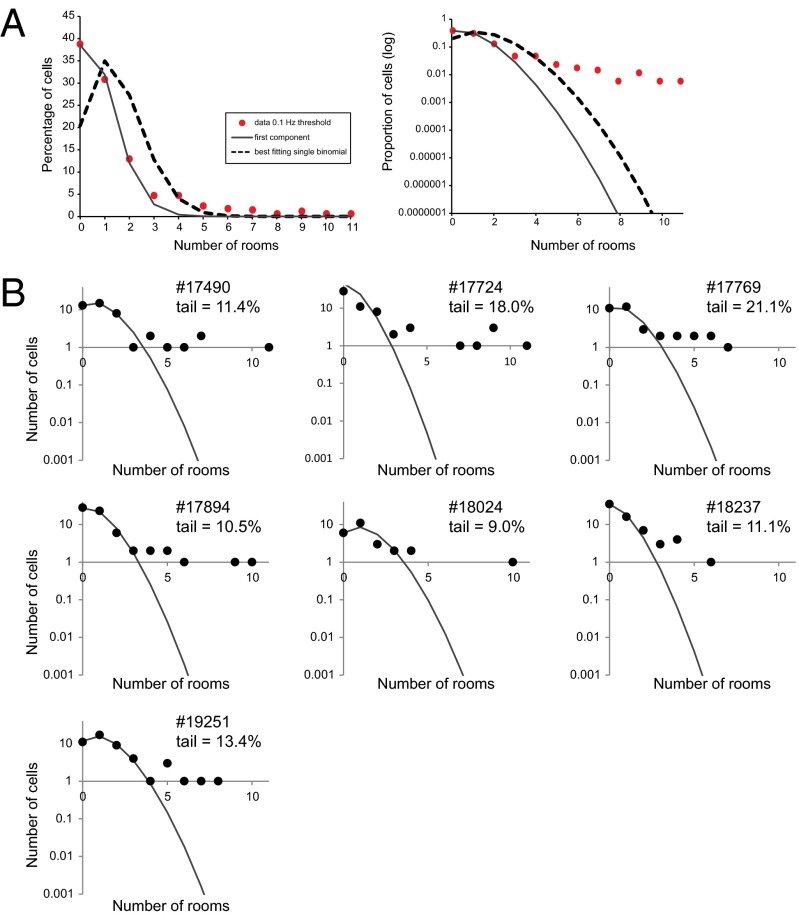
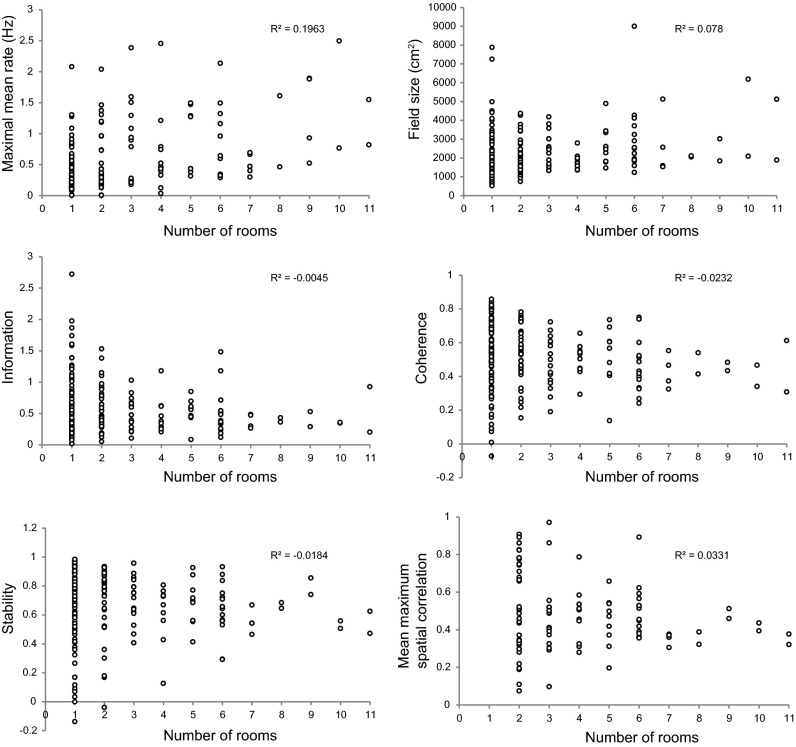
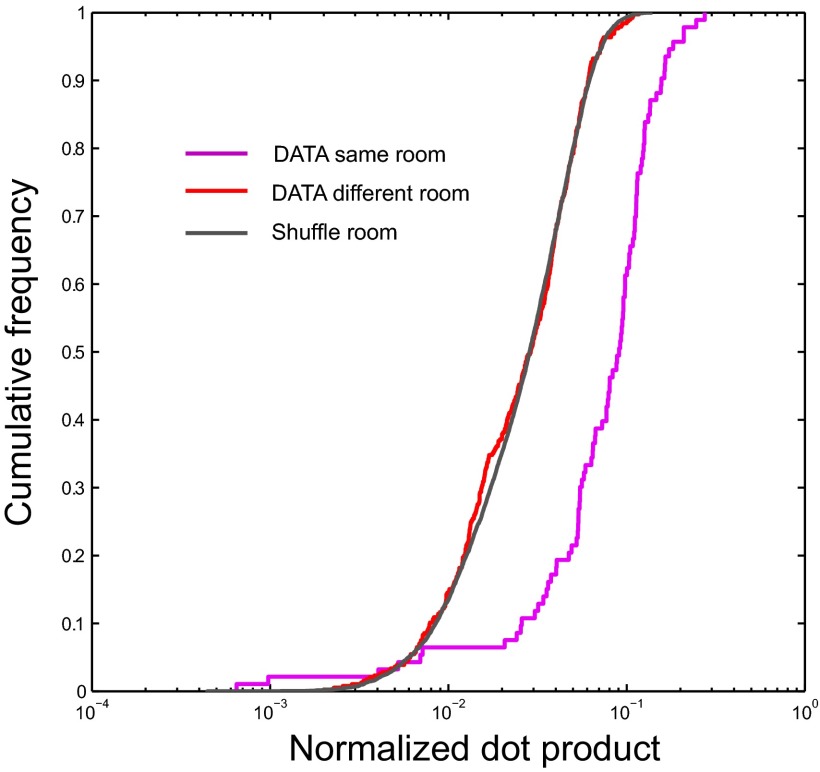
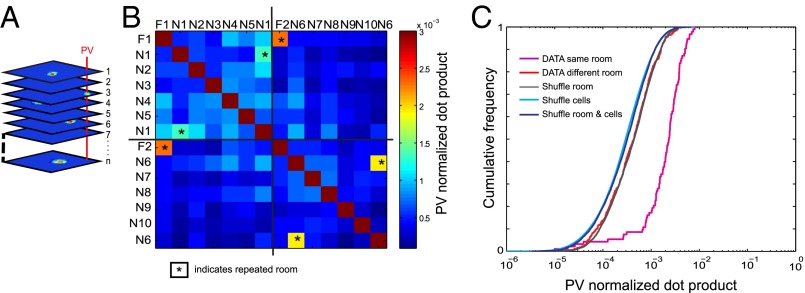
The contribution of hippocampal circuits to high-capacity episodic memory is often attributed to the large number of orthogonal activity patterns that may be stored in these networks. Evidence for high-capacity storage in the hippocampus is missing, however. When animals are tested in pairs of environments, different combinations of place cells are recruited, consistent with the notion of independent representations. However, the extent to which representations remain independent across larger numbers of environments has not been determined. To investigate whether spatial firing patterns recur when animals are exposed to multiple environments, we tested rats in 11 recording boxes, each in a different room, allowing for 55 comparisons of place maps in each animal. In each environment, activity was recorded from neuronal ensembles in hippocampal area CA3, with an average of 30 active cells per animal. Representations were highly correlated between repeated tests in the same room but remained orthogonal across all combinations of different rooms, with minimal overlap in the active cell samples from each environment. A low proportion of cells had activity in many rooms but the firing locations of these cells were completely uncorrelated. Taken together, the results suggest that the number of independent spatial representations stored in hippocampal area CA3 is large, with minimal recurrence of spatial firing patterns across environments.

Keywords: hippocampus; memory; place cells; space.


Conflict of interest statement

The authors declare no conflict of interest.

Figures

Fig. 1.
Fig. 1.
Experimental setup and procedure. (A) Test protocol. On the first test day (DAY1), rats were transported into the familiar room (F), where they rested for 15 min next to the recording arena (REST F) before foraging started in the recording box. Foraging in the familiar environment lasted for 15 min (F). After a second 15-min rest trial (REST F), the rat was moved with the mobile recording rig to novel room 1 (N1) for 15 min of rest (rest N1) followed by 2 × 15 min of foraging (N1) and another rest trial (REST N1). The procedure was repeated across all novel rooms (day 1: N1–N5; day 2: N6–N10). Each day, the recordings in the novel environments were succeeded by a second test in the familiar environment to check for stability. (B) Photographs of all 11 rooms. White squares indicate room number. The mobile recording rig including the red crane (present in all pictures) enabled continuous recording. Different 1- × 1-m recording boxes were used in each of room. Position and location of cue card also varied across rooms.
Fig. 2.
Fig. 2.
Tetrode locations of each animal. (A) Individual panels show Nissl-stained coronal sections through the hippocampus. Rat numbers (five digits) and tetrode numbers (TT) are indicated. Tetrode traces are indicated with arrowheads. Red arrowheads indicate tetrodes with cells that were active in more than five rooms. (Scale bar for all images, 500 µm.) (B) Scatterplot showing number of rooms that a cell was active in as a function of position along the proximodistal axis of CA3. Each cross corresponds to one cell. (Inset) Schematic showing proximodistal axis scaled from 0 to 1. Cells active in multiple rooms were not confined to a specific location on the proximodistal axis (r = −0.09, P > 0.05).
Fig. 3.
Fig. 3.
Activity of three representative CA3 place cells in 11 recording rooms. (A) First row and every second subsequent row: color-coded rate maps showing distribution of firing rate within and between environments (blue, no firing; red, peak firing). Color is scaled to the peak rate (bottom right). Remaining rows: trajectory of the animal with spikes superimposed as red dots on the path. Animal number (five digits) and tetrode number (TT) are indicated. n = novel, F = familiar. The majority of the cells, such as TT9_6 and TT3_3, fire in one or two rooms. A small number of cells, such as TT7_2, fire in many or most rooms. (B) Frequency distribution showing number of cells with activity in successive numbers of rooms (1–11). Number of cells as a function of number of rooms in which the cells were active. Distributions are shown for different rate thresholds (Θ). Most CA3 place cells were silent or active in only 1 or 2 of the 11 rooms when Θ = 0.05 Hz or 0.10 Hz.
Fig. 4.
Fig. 4.
The number of cells that were active in any number of rooms does not follow the binomial distribution expected if all cells had the same a priori probability λ of being active in a room. (A) Entire data sample. The dashed curve is the binomial distribution with λ = 0.14. The first few data points are much better fit by a binomial with λ = 0.07 (solid curve), which accounts for a fraction a0 = 85% of the cells, leaving the remaining 15% in the tail extending to high n values. The semilog scale to the right emphasizes this tail. Data and fits are for the 0.10-Hz threshold, but similar results hold for other threshold values. (B) The same data for individual animals, showing that a tail of overactive cells is present in all cases. Each panel shows for one animal the distribution of the number of cells active in any number n of rooms, on a semilog scale and with a 0.10-Hz activity threshold. The solid curve is the best binomial fit to the first three data points, those for n = 0, 1, and 2, and the fraction of cells not accounted for by these fits is indicated. Proportions of cells in tail are indicated.
Fig. 5.
Fig. 5.
Place-cell characteristics for all CA3 cells that were active in at least one room (N = 210). Mean firing rate, field size, spatial information, spatial coherence, stability within rooms and maximal spatial correlation across rooms are plotted against the number of rooms a cell was active in. Mean firing rate is the maximum of room-specific mean rates across all rooms. Field size, information, coherence, and stability, in contrast, are averaged over all rooms in which the cell passed a rate threshold of Θ = 0.10 Hz. For spatial correlation across rooms, only cell pairs that passed the 0.10-Hz threshold in both rooms were used (N = 99). Maximal correlation was determined by rotating each map in steps of 90° and selecting the maximum correlation value.
Fig. 6.
Fig. 6.
Similarity of firing rates between each of the 55 combinations of rooms. For each pair of rooms, the overlap of activity was defined as the mean product, across cells, of the mean firing rates of each cell in the two rooms, divided by the maximal mean rate of that cell across all rooms. Overlaps between different rooms (red line) are contrasted to overlaps between repeated exposures to the same room (pink line). Note the strong similarity between observed data across rooms and distributions of shuffled data where each rate map is assigned randomly to one of the 11 rooms (black line), suggesting that the distribution of active cells across rooms is close to orthogonal.
Fig. 7.
Fig. 7.
Dot product between population vectors across all combinations of test rooms. (A) Definition of population vectors. The rates of all recorded CA3 cells were stacked into 400 composite population vectors (PVs), one for each of the 20 × 20 pixels of the recording box. Population vectors with the local rates of each neuron were defined for each pixel. (B) Color-coded matrix showing average dot product values for population vectors between rooms (all 55 room pairs), including repeated exposures to the familiar room (F) and rooms N1 and N6, which were presented twice. Repeated trials are indicated by asterisks. (C) Distributions of shuffled data obtained either by random assignment of rate maps across rooms (shuffle room) or by shuffling of cell identities within rooms (shuffle cells) or by combining the two procedures (shuffle room and cells). Note the low dot product between all different pairs of rooms but significantly higher dot products between repeated trials in the same environment (DATA same room; first and second half of recording).

References

    1. Marr D. Simple memory: A theory for archicortex. Philos Trans R Soc Lond B Biol Sci. 1971;262(841):23–81. - PubMed
    1. McNaughton BL, Morris RG. Hippocampal synaptic enhancement and information storage within a distributed memory system. Trends Neurosci. 1987;10:408–415.
    1. Treves A, Rolls ET. Computational analysis of the role of the hippocampus in memory. Hippocampus. 1994;4(3):374–391. - PubMed
    1. Leutgeb JK, Leutgeb S, Moser MB, Moser EI. Pattern separation in the dentate gyrus and CA3 of the hippocampus. Science. 2007;315(5814):961–966. - PubMed
    1. Treves A, Rolls ET. Computational constraints suggest the need for two distinct input systems to the hippocampal CA3 network. Hippocampus. 1992;2(2):189–199. - PubMed

Publication types

LinkOut - more resources