. 2014 Dec 9:5:5662.
doi: 10.1038/ncomms6662.

Resolving cancer-stroma interfacial signalling and interventions with micropatterned tumour-stromal assays

Affiliations

Resolving cancer-stroma interfacial signalling and interventions with micropatterned tumour-stromal assays

Keyue Shen et al. Nat Commun. .

Abstract

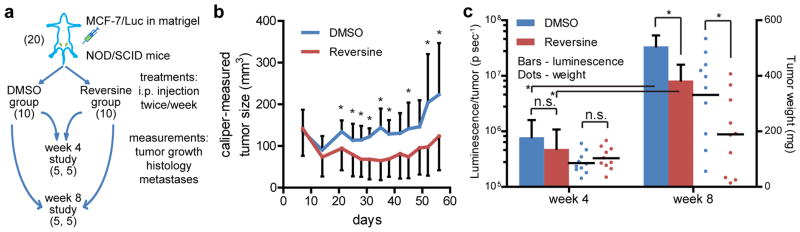
Tumour-stromal interactions are a determining factor in cancer progression. In vivo, the interaction interface is associated with spatially resolved distributions of cancer and stromal phenotypes. Here, we establish a micropatterned tumour-stromal assay (μTSA) with laser capture microdissection to control the location of co-cultured cells and analyse bulk and interfacial tumour-stromal signalling in driving cancer progression. μTSA reveals a spatial distribution of phenotypes in concordance with human oestrogen receptor-positive (ER+) breast cancer samples, and heterogeneous drug activity relative to the tumour-stroma interface. Specifically, an unknown mechanism of reversine is shown in targeting tumour-stromal interfacial interactions using ER+ MCF-7 breast cancer and bone marrow-derived stromal cells. Reversine suppresses MCF-7 tumour growth and bone metastasis in vivo by reducing tumour stromalization including collagen deposition and recruitment of activated stromal cells. This study advocates μTSA as a platform for studying tumour microenvironmental interactions and cancer field effects with applications in drug discovery and development.


Conflict of interest statement

Competing Financial Interests

K.S. and B.P. are listed as inventors for a patent application disclosing μTSA, which includes data described in the manuscript.

Figures

Figure 1
Figure 1. Heterotypic cell-cell interactions are precisely controlled in micropatterned tumor stromal assay (μTSA)
(a) Schematics of the μTSA fabrication process. (b) μTSA co-culture of MDA-MB-231 (expressing GFP) breast cancer cell with normal human dermal fibroblasts (NHDF) (stained for fibroblast-specific protein-1, FSP-1). Scale bars: 100 μm. (c) 48-hour IL-6 and CCL5 secretion in MDA and NHDF mono-cultures, random and μTSA co-cultures with 4 different micropattern designs. n.s.: not significant; *: p<0.05, by one-way ANOVA. (c) n=3. Error bars: standard deviation (SD).
Figure 2
Figure 2. Ki-67 expression in MDA-MB-231 cells is spatially regulated and inhibited by NHDF cells in micropatterned cultures
(a) Images of Ki-67 staining in MDA mono-culture and co-culture with NHDF over 6 days. (b) Image analysis of Ki-67 positivity in μTSA. r: radial distance r of a cancer cell from the center of micropattern; rmax center-to-edge distance along the same vector direction; dash line: r/rmax=0.5 separates cancer cell region into central and edge areas (see Methods). (c) Cellular Ki-67 staining intensities were plotted against normalized distances, and threshold into positive and negative cells. (d) Percentage of Ki-67+ MDA cells in micropatterns in absence (blue) and presence (red) of surrounding NHDF cells over 6 days. (e) The ratio of the Ki-67+ MDA cell density between micropattern edge (area outside dash line) and center (area within dash line). (f) MDA cell growth in micropatterns without or with NHDF cells, measured by total GFP intensity in each micropattern area. Scale bars: 500 μm. (d~f) n.s.: not significant; *: p<0.05 by Student’s t-test. (d~e) n=3 per condition per day; (f) n=6 per condition. Error bars: SD.
Figure 3
Figure 3. Laser capture microdissection (LCM) uncovers spatial phenotypic heterogeneity in μTSA and concordance in human breast cancer tissue
(a) μTSA co-culture of MCF-7 (green: pan-cytokeratin) and bone marrow derived mesenchymal stromal cell (BMSC; red: vimentin). Nuclei were counterstained with DAPI (blue). Inset: line scan of green and red channels from the center of micropattern into the bulk of BMSC. Scale bar: 500 μm. (b) Four categorical cell regions IE, OE, IS, and OS in μTSA (locations: Inner and Outer; cell components: Epithelium and Stroma) (c) A μTSA co-culture of MCF-7 and BMSC cells after LCM capture of interfacial cancer cells (H&E). Inset: Captured cells on a thermoplastic membrane. Scale bars: 500 μm and 100 μm (inset). (d) Average ribonucleic acid (RNA) yield from four regions of a single 4-island μTSA co-culture. n.s.: not significant by Student t-test. (e) Percent of genes with ≥2-fold expression change in MCF-7 cells out of the 11 genes examined when co-cultured with normal breast fibroblast (NBF), cancer-associated fibroblast (CAF) and BMSC in μTSA. n.s.: not significant; *: p<0.05, by one-way ANOVA; **: p<0.05, by Student’s t-test. (f) Relative gene expression change in interface vs. bulk in cancer cells. (g) Clinical specimen of human breast cancer (a case of IDC) and bulk (IE) & interfacial (OE) regions used for LCM and gene expression analysis. Scale bar: 100 μm. (h) Relative expression (−ΔΔ Ct) of the 11 genes in OE versus IE were plotted in the same way as (f). (i) Direction-weighted, stacked numbers of cases for each gene with significant (p<0.05) up- or down-regulations, or no change (p ≥0.05). Centroids (diamond) indicate overall direction of gene expression by simple case majority in up- and down-regulations. Underlined genes (7 out of 11, or 63.6%) have matched directions (including no change by p-value) in μTSA. (f, h) *: p<0.05 by Student’s t-test, samples had significant changes in gene expression; all other conditions: no significance in gene expression change. (d) n=5~6; (e) n=6; (f, h) n=3. (d~f, h) Error bars: SD.
Figure 4
Figure 4. Reversine is selected in spatially-resolved μTSA drug test with gene expression as readout
(a) Gene expressions in IE, OE, IS and OS were compared between drug treated and non-treated co-cultures of MCF-7 and BMSC in μTSA. (b) A collection of six drugs were tested on the μTSA platform and the scores sorted from negative (cancer-inhibiting) to positive (cancer-promoting), where reversine stood out as the top candidate. Scores from individual regions were plotted in color bars. n.s.: not significant between the indicated groups; *: p<0.05, by one-way ANOVA. Gene expression changes in (c) IE and OE and (d) IS and OS caused by reversine treatment. *: p<0.05 by Student’s t-test, samples had significant changes in gene expression; all other conditions: no significance in gene expression change. (b~d) n=6. Error bars: SD.
Figure 5
Figure 5. Reversine treatment inhibits in vivo tumor growth in a MCF-7 tumor model
(a) MCF-7 cells expressing luciferase were implanted in NOD/SCID mammary fatpads in a total of 20 mice, and monitored for tumor growth with (N=10) and without (N=10) reversine treatment. (b) Tumor growth by caliper measurements. *: p<0.05 by Student’s t-test; all others: not significant. (c) ex vivo bioluminescent signal and tumor weights measured from extracted tumors at week 4 and 8 (N=5 from each group, respectively). n.s.: not significant; *: p<0.05 by Student’s t-test. (b~c) Error bars: SD.
Figure 6
Figure 6. Tumor stromalization is reduced by reversine treatment
(a) Masson’s trichrome staining, (b) quantification of collagen density, (c) immunohistochemical α-smooth muscle actin (αSMA) staining, and (d) percentage of areas occupied by αSMA+ cells in each field of view. Evaluations were made in tumor areas dominated by cancer cells at week 4 and 8 in the control and reversine treatment groups. Images were taken at 20x magnification representing 5 tumors per group. Image numbers analyzed (week 4 DMSO, week 4 Reversine, week 8 DMSO, week 8 Reversine): n=21, 22, 27, and 24 for collagen density; n=35, 55, 129, and 92 for SMA. (a, c) Scale bars: 100 μm. (b, d) Error bars: SD. n.s.: not significant; *: p<0.05 by Student’s t-test.

References

    1. Sgroi DC. Preinvasive breast cancer. Annu Rev Pathol. 2010;5:193–221. - PMC - PubMed
    1. Allinen M, et al. Molecular characterization of the tumor microenvironment in breast cancer. Cancer Cell. 2004;6:17–32. - PubMed
    1. Ma XJ, Dahiya S, Richardson E, Erlander M, Sgroi DC. Gene expression profiling of the tumor microenvironment during breast cancer progression. Breast Cancer Res. 2009;11:R7. - PMC - PubMed
    1. De Wever O, et al. Molecular and pathological signatures of epithelial – mesenchymal transitions at the cancer invasion front. Histochem Cell Biol. 2008;130:481–494. - PMC - PubMed
    1. Gao MQ, et al. Stromal fibroblasts from the interface zone of human breast carcinomas induce an epithelial-mesenchymal transition-like state in breast cancer cells in vitro. J Cell Sci. 2010;123:3507–3514. - PubMed

Publication types

MeSH terms