. 2014 Dec 9:3:e04288.
doi: 10.7554/eLife.04288.

Spatial quality control bypasses cell-based limitations on proteostasis to promote prion curing

Affiliations

Spatial quality control bypasses cell-based limitations on proteostasis to promote prion curing

Courtney L Klaips et al. Elife. .

Erratum in

Abstract

The proteostasis network has evolved to support protein folding under normal conditions and to expand this capacity in response to proteotoxic stresses. Nevertheless, many pathogenic states are associated with protein misfolding, revealing in vivo limitations on quality control mechanisms. One contributor to these limitations is the physical characteristics of misfolded proteins, as exemplified by amyloids, which are largely resistant to clearance. However, other limitations imposed by the cellular environment are poorly understood. To identify cell-based restrictions on proteostasis capacity, we determined the mechanism by which thermal stress cures the [PSI(+)]/Sup35 prion. Remarkably, Sup35 amyloid is disassembled at elevated temperatures by the molecular chaperone Hsp104. This process requires Hsp104 engagement with heat-induced non-prion aggregates in late cell-cycle stage cells, which promotes its asymmetric retention and thereby effective activity. Thus, cell division imposes a potent limitation on proteostasis capacity that can be bypassed by the spatial engagement of a quality control factor.

Keywords: S. cerevisiae; amyloid; cell biology; chaperone; prion; protein misfolding.


Conflict of interest statement

The authors declare that no competing interests exist.

Figures

Figure 1.
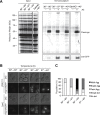
Figure 1.. Thermal stress induces curing through resolution of Sup35 amyloid.
(A) [PSI+]Strong (SLL2606) and [PSI+]Weak (SLL2600) cultures were incubated for 30 min at the indicated temperatures before plating on rich medium at 30°C to analyze curing by colony color phenotype, as described in the text. (B) Quantification of [PSI+]Weak (SLL2600) colony color phenotypes following treatment as described in (A). Colonies were scored as completely [psi] (black), or sectored (partially [psi], white). Data represent averages; error bars represent standard deviations; n = 3. (C) Semi-native lysates of [psi] (SLL2119), [PSI+]Weak (SLL2600), and [PSI+]Strong (SLL2606) cultures were analyzed by semi-denaturing detergent agarose gel electrophoresis (SDD-AGE) and immunoblotting for Sup35 after treatment as described in (A). (D) Sup35 released from amyoid aggregates in a [PSI+]Weak strain (SLL2600) following treatment as described in (A) and recovery at 30°C in the presence of cycloheximide was determined by treating lysates with 2% SDS at 53°C, followed by SDS-PAGE and quantitative immunoblotting for Sup35. Lines represent medians; boxes represents upper and lower quartiles, and whiskers represent maximum and minimum; n = 5; *p = 0.02, **p = 0.01 by paired t-test. DOI: http://dx.doi.org/10.7554/eLife.04288.003
Figure 1—figure supplement 1.
Figure 1—figure supplement 1.. Characterization of thermal stress effects.
(A). Exponentially growing [PSI+]Weak cultures (SLL2600) were incubated at 30°C, 37°C, 40°C, or 37°C before 40°C for 30 min and plated to YPD at 30°C to quantify colony forming units. Data represent means; error bars represent standard deviations; n ≥ 3. (B) [PSI+]Weak cultures (SLL2600) grown exponentially for 2 hr after dilution from a saturated overnight culture (left) or for at least 24 hr (right) were incubated at 40°C for 30 min and allowed to recover for 2 hr at 30°C. Lysates isolated from these cultures were analyzed by SDD-AGE and immunoblotting for Sup35. DOI: http://dx.doi.org/10.7554/eLife.04288.004
Figure 2.
Figure 2.. Curing is mediated by Hsp104 and depends upon propagation efficiency.
(A) [PSI+]Weak cultures (SLL2600) were incubated at 40°C for 30 min in the absence (untreated) or presence of guanidine HCl (GdnHCl) and plated on YPD to quantify prion loss by colony color phenotype. Data represent means; error bars represent standard deviations; n = 3; p = 0.0004 by unpaired t-test. (B) A WT (HSP104/+; SY945) and a heterozygous disruption (HSP104/Δ; SY591) [PSI+]Weak diploid strain were incubated at 40°C for 90 min and plated on YPD to quantify prion loss by colony color phenotype. Data represent means; error bars represent standard deviations; n = 3; p < 0.0001 by unpaired t-test. (C) [PSI+]Strong strains expressing an extra copy of either WT (SY1646) or G58D (SY1648) Sup35 were incubated at 40°C for 90 min and plated on YPD to quantify prion loss by colony color phenotype. Data represent means; error bars represent standard deviations; n = 4; p < 0.0001 by unpaired t-test. (D) A WT (SUP35/+; SLL3071) and a heterozygous disruption (SUP35/Δ; SY957) diploid [PSI+]Strong strain were incubated at 40°C for 90 min and plated on YPD to quantify prion loss by colony color phenotype. Data represent means; error bars represent standard deviations; n = 3; p < 0.0001 by unpaired t-test. DOI: http://dx.doi.org/10.7554/eLife.04288.005
Figure 3.
Figure 3.. Heat-induced aggregate accumulation but not chaperone levels correlate with temperature.
(A) A [PSI+]Weak strain (SLL2600) was incubated at 30°C, 37°C, 40°C, or 37°C before 40°C for 30 min, and lysates were prepared and analyzed by SDS-PAGE and quantitative immunoblotting for Hsp104 (black), Ssa1 (gray), and Sis1 (white). Data represent means; error bars represent standard deviations; n ≥ 3. (B) Aggregates from lysates of a [PSI+]Weak strain (SLL2600) following treatment as described in (A) were prepared and analyzed by differential centrifugation and Bradford assay. Data represent means; error bars represent standard error; n = 6; *p = 0.0014, **p = 0.0052 by paired t-test. DOI: http://dx.doi.org/10.7554/eLife.04288.006
Figure 3—figure supplement 1.
Figure 3—figure supplement 1.. Effects of thermal stress and Hsp104 on protein accumulation.
(A) Lysates were isolated from [PSI+]Weak strains (SLL2600) incubated at 30°C, 37°C, 40°C, or 37°C before 40°C for 30 min and analyzed by SDS-PAGE and quantitative immunoblotting for Sup35. Data represent means; error bars represent standard deviations; n = 4. (B) Lysates were isolated from [PSI+]Weak strains (SLL2600) incubated at 30°C, 37°C, 40°C, or 37°C before 40°C for 30 min and analyzed by SDS-PAGE and quantitative immunoblotting for Hsp104, Ssa1, Sis1 or phosphoglycerate kinase (PGK) as a loading control (representative blot; see Figure 3A for quantification). (C) Lysates were isolated from a [PSI+]Weak strain containing a galactose-inducible HSP104 at the endogenous locus (SY1749) after galactose treatment and Hsp104 protein was quantified by SDS-PAGE and immunoblotting. Data represent means; error bars represent standard deviations; n = 3. (D) Galactose-inducible HSP104 [PSI+]Weak strains (SY1749) were grown in the presence of galactose for various times and plated on YPD for analysis of [PSI+] phenotype. Data represent means; error bars represent standard deviation; n = 3. (E) Lysates isolated from galactose-inducible HSP104 [PSI+]Strong (SY1748) or [PSI+]Weak (SY1749) cultures treated as described in (D) were analyzed by SDD-AGE and immunoblotting for Sup35. (F) Lysates were isolated from [PSI+]Strong (black) (SLL2606) and [psi] (white) (SLL2119) strains that were treated as described in (B), and heat-induced protein aggregates were quantified following differential centrifugation and Bradford assay. Data represent means; error bars represent standard errors; n ≥ 5. (G) Lysates were isolated from a [PSI+]Weak strain (SLL2600) that was incubated at 30°C or 40°C for 30 min in the absence (untreated) or presence of GdnHCl, and heat-induced protein aggregates were quantified following differential centrifugation and Bradford assay. Data represent means; error bars represent standard error; n = 3. DOI: http://dx.doi.org/10.7554/eLife.04288.007
Figure 4.
Figure 4.. Hsp104 engages heat-induced substrates upon thermal stress.
(A) A [PSI+]Weak strain with a GFP-tagged endogenous Hsp104 (SY2126) was incubated at 30°C, 37°C, 40°C, or 40°C with GdnHCl for 30 min, and immunocapture in the presence (+) or absence (−) of anti-GFP antibodies (Ab) was performed on native lysates. Proteins were analyzed by SDS-PAGE and general protein staining (Flamingo, top), or immunoblotting for GFP (bottom). (B) [PSI+]Weak (SY2126) or [psi] (SY2125) HSP104GFP strains were incubated at 30°C, 37°C, 40°C, or 37°C before 40°C for 90 min, and the pattern of Hsp104-GFP fluorescence was examined by microscopy. Scale bar = 1 μm. (C) Quantification of Hsp104-GFP fluorescence pattern in [PSI+]Weak (SY2126) cells, treated as described in (B): no localization (white); single dot (light gray); faint aggregate (medium gray); bright aggregate (dark gray); multiple bright aggregates (black); n > 25. DOI: http://dx.doi.org/10.7554/eLife.04288.008
Figure 4—figure supplement 1.
Figure 4—figure supplement 1.. Characterization of HSP104GFP strain.
(A) [PSI+]Weak (SLL2600) and [PSI+]Weak HSP104GFP (SY2126) strains were grown at 30°C, plated on YPD, and incubated at 30°C for analysis of [PSI+] colony color phenotype. (B) [PSI+]Weak (SLL2600, gray) and [PSI+]Weak HSP104GFP (SY2126, white) strains were incubated at 40°C for the indicated times and plated on YPD at 30°C for analysis of prion curing by colony color phenotype. Data represent means; error bars represent standard deviations; n = 3.(C) Lysates were isolated from WT (SLL2600) or HSP104GFP (SY2126) [PSI+]Weak strains that were incubated at 30°C or 40°C for 30 min, and heat-induced protein aggregates were quantified by differential centrifugation and Bradford assay. Data represent means; error bars represent standard error; n = 3. (D) Quantitative western blotting for Hsp104 was performed on lysates from [PSI+]Weak (SLL2600) and [PSI+]Weak HSP104GFP (SY2126) strains after incubation at 40°C for the indicated times. Data represent means; error bars represent standard deviations; n = 3. (E) Hsp104GFP and an mCherry-tagged firefly-luciferase (FFLmCh) reporter were visualized in a [PSI+]Weak strain (SY2802) by microscopy following incubation at 30°C or after a 30-min recovery from an incubation at 40°C for 90 min (30°C→40°C). Scale bar = 1 μm. (F) Hsp104GFP was visualized in a [PSI+]Weak strain (SY2126) by microscopy after a 90-min recovery from incubation at 40°C for 90 min in the absence (40°C) or presence of GdnHCl added before (GdnHCl→40°C) or after (40°C→GdnHCl) heat treatment. Scale bar = 1 μm. (G) [PSI+]Weak HSP104GFP cultures (SY2126) treated as described in (F) were plated on YPD and incubated at 30°C for analysis of [PSI+] colony color phenotype. Data represent means; error bars represent standard deviations; n = 3; *p = 0.0001,**p = 0.0089. DOI: http://dx.doi.org/10.7554/eLife.04288.009
Figure 5.
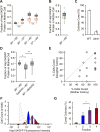
Figure 5.. Curing results from the asymmetric localization of Hsp104 following thermal stress.
(A) A [PSI+]Weak HSP104GFP culture (SY2126) was imaged over time in a microfluidics chamber at 30°C after a 30 min incubation at 30°C, 37°C, 40°C, or 37°C before 40°C. Fluorescence intensity in daughter and mother cells was quantified at the first cell division in cells that were budded (gray) or unbudded (orange) after thermal stress. Lines represent medians; boxes represent upper and lower quartiles, and whiskers represent maximum and minimum. All pairwise comparisons are significantly distinct, with a p < 0.015, except where indicated (N.S.), by unpaired t-test; n ≥ 10. (B) A [PSI+]Weak HSP104GFP WT (SY2126, gray) or BNI1 deletion strain (Δbni1) (SY2486, green) was imaged over time in a microfluidics chamber at 30°C after a 30 min incubation at 40°C. Fluorescence intensity in daughter and mother cells was quantified at the first cell division. Lines represent medians; boxes represent upper and lower quartiles; and whiskers represent maximum and minimum; n ≥ 14; p = 0.0075 by unpaired t-test. (C) [PSI+]Weak WT (SLL2600) or Δbni1 strains (SY1888), treated as described in (B), were plated on YPD to analyze curing by colony color phenotype. Data represent means; error bars represent standard deviations; n = 3; p < 0.0001 by unpaired t-test. (D) A [PSI+]Weak HSP104GFP strain (SY2126) was imaged over time in a microfluidics chamber at 30°C after a 30 min incubation at 40°C and with GdnHCl added before or after the 40°C incubation. Fluorescence intensity in daughter and mother cells was quantified at the first cell division. Lines represent medians; boxes represent upper and lower quartiles; and whiskers represent maximum and minimum; n > 11; *p = 0.0003, **p = 0.0026 by unpaired t-test. (E) A [PSI+]Weak strain (SLL2600) was incubated at 40°C for 30 min and plated on rich medium. Mother and daughter pairs were separated by micromanipulation and allowed to form colonies, which were then dispersed to YPD for analysis of curing by colony color phenotype. n = 15. (F) A [PSI+]Weak HSP104GFP culture (SY2126) was incubated at 30°C (dotted) or at 40°C for 30 min and allowed to recover for 30 min at 30°C (solid) before analysis of GFP fluorescence intensity by flow cytometry. Based on these intensities, cells were sorted into four fractions (orange, blue, purple, red) by FACS. (G) Cells collected in (F) were plated on YPD to analyze curing by colony color phenotype. Data represent means; error bars represent standard deviations; n = 2; *p = 0.02 by paired t-test. DOI: http://dx.doi.org/10.7554/eLife.04288.010
Figure 5—figure supplement 1.
Figure 5—figure supplement 1.. Characterization of chaperone asymmetric retention following thermal stress.
(A) A [psi] strain expressing heat-inducible untagged GFP (SY2091) was imaged over time in a microfluidics chamber at 30°C after 30 min incubation at 40°C (red) or 30°C (gray). Fluorescence intensity in daughter and mother cells was quantified at the first cell division in budded cells. Lines represent medians, boxes represent upper and lower quartiles, and whiskers represent maximum and minimum; n ≥ 11. (B) A [PSI+]Weak strain expressing a GFP-tagged endogenous Ssa1 and DsRedNLS (SY2659) was imaged after a 90 min incubation at 30°C, 37°C, 40°C, or 37°C before 40°C. Scale bar = 2 μm. (C) A [PSI+]Weak strain expressing a GFP-tagged endogenous Sis1 and DsRedNLS (SY2485) was imaged after a 90-min incubation at 30°C, 37°C, 40°C, or 37°C before 40°C. Scale bar = 2 μm. (D) A [PSI+]Weak SSA1GFP culture (SY2658) was imaged over time in a microfluidics chamber at 30°C after a 30 min incubation at 40°C (red) or 30°C (gray). Fluorescence intensity in daughter and mother cells was quantified at the first cell division in budded cells. Lines represent medians, boxes represent upper and lower quartiles, and whiskers represent maximum and minimum; n > 15. (E) A [PSI+]Weak SIS1GFP culture (SY2447) was imaged over time in a microfluidics chamber at 30°C after a 30 min incubation at 40°C (red) or 30°C (gray). Fluorescence intensity in daughter and mother cells was quantified at the first cell division in budded cells. Lines represent medians, boxes represent upper and lower quartiles, and whiskers represent maximum and minimum; n ≥ 7. (F) Quantitative immunoblotting for Hsp104 was performed on lysates from WT (SLL2600) or Δbni1 (SY1888) [PSI+]Weak cultures treated at 30°C (black) and 40°C (white) for 30 min following SDS-PAGE. Data represent means; error bars represent standard deviations; n = 3. (G) Lysates were isolated from WT (SLL2600) or Δbni1 (SY1888) [PSI+]Weak strains that were incubated at 30°C or 40°C for 30 min, and heat-induced protein aggregates were analyzed by differential centrifugation and Bradford assay. Data represent means; error bars represent standard error; n = 3. DOI: http://dx.doi.org/10.7554/eLife.04288.011
Figure 6.
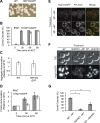
Figure 6.. Efficient curing occurs in late cell-cycle staged cells following thermal stress.
(A) Single cells from an asynchronous WT [PSI+]Weak culture (SLL2600) were scored for morphology following bright-field imaging by microscopy: unbudded (black), tiny bud (dark gray), small bud (gray), medium bud (light gray), large bud (white). n = 153. (B) α-factor-arrested cultures were analyzed as in (A) over time after release. n ≥ 250. (C) Nocodazole-arrested cultures were analyzed as in (A) over time after release. n ≥ 175. (D) A [PSI+]Weak HSP104GFP strain (SY2126) released from α-factor arrest was incubated at 40°C (solid black lines) for 30 min before analysis by flow cytometry. 100,000 cells were analyzed per sample. (E) A [PSI+]Weak HSP104GFP strain (SY2126) released from nocodazole arrest was incubated at at 40°C (black lines) for 30 min before analysis by flow cytometry. 100,000 cells were analyzed per sample. (F) α-factor-arrested cultures (SLL2600) were incubated at 40°C for 30 min immediately or 30 min after release, and curing was quantified by colony color phenotype after plating on YPD at 30°C. Data represent means; error bars represent standard deviations; n = 3; p = 0.0255 by unpaired t-test. (G) Nocodazole-arrested cultures (SLL2600) were incubated at 40°C for 30 min immediately or 30 min after release, and curing was quantified colony color phenotype after plating on YPD at 30°C. Data represent means; error bars represent standard deviations; n = 3; p = 0.0263 by unpaired t-test. DOI: http://dx.doi.org/10.7554/eLife.04288.013
Figure 6—figure supplement 1.
Figure 6—figure supplement 1.. Characterization of chaperone accumulation and engagement in arrested cultures.
(A) Lysates were isolated from asynchronous, α-factor-arrested, or nocodazole-arrested [PSI+]Weak cultures (SLL2600) following incubation at 30°C (black) or 40°C (white) for 30 min, and the levels of Hsp104 were determined by quantitative immunoblotting following SDS-PAGE. Data represent means; error bars represent standard deviations; n = 3. (B) Asynchronous, α-factor-arrested, and nocodazole-arrested [PSI+]Weak HSP104GFP (SY2126) cultures were treated for 90 min at 30°C or 40°C and imaged by microscopy. Scale bar = 2 μm. DOI: http://dx.doi.org/10.7554/eLife.04288.014
Figure 7.
Figure 7.. Substrate–chaperone engagement must exceed time to cell division to induce curing.
(A) The number of [PSI+]Weak HSP104GFP (SY2126) cells containing fluorescent foci was quantified in cultures recovering at 30°C over time following a 90 min incubation at 40°C (white). Colony forming units in these cultures were quantified by plating (black). Data represent means; error bars represent standard deviations; n = 3. (B) [PSI+]Weak HSP104GFP cells (SY2126) treated for 30 min at 40°C and imaged over time in a microfluidics chamber are shown. Cells that were budded at the time of thermal stress are outlined in white, while unbudded cells are outlined in orange. Solid lines mark mothers, and dotted lines mark daughters. Scale bar = 1 µm. (C) A [PSI+]Weak HSP104GFP strain (SY2126) was imaged over time in a microfluidics at 30°C after a 30 min incubation at 40°C chamber. Budded or unbudded cells were scored at the first cell division for the presence or absence of fluorescent aggregates. Data represent means; error bars represent standard deviations; n = 3; p = 0.0005 by unpaired t-test. DOI: http://dx.doi.org/10.7554/eLife.04288.015
Figure 8.
Figure 8.. Model for Sup35 amyloid resolubilization and curing upon thermal stress.
Upon thermal stress, cellular proteins (green) misfold and aggregate, leading to the induction and recruitment of Hsp104 (barrel). If thermal stress occurs in unbudded cells (1), these aggregates are resolved prior to cell division, allowing the partitioning of Hsp104 to both mother (black) and daughter (gray) cells (left). If thermal stress occurs in budded cells (2), heat-induced aggregates persist upon cell division (3), leading to the asymmetric retention of Hsp104 in mother cells. Both heat-induced aggregates (green) and Sup35 amyloid (blue corkscrews) are resolved in cells accumulating high levels of Hsp104, leading to curing (red, 4). DOI: http://dx.doi.org/10.7554/eLife.04288.016

Similar articles

Cited by

References

    1. Aguilaniu H, Gustafsson L, Rigoulet M, Nyström T. Asymmetric inheritance of oxidatively damaged proteins during cytokinesis. Science. 2003;299:1751–1753. doi: 10.1126/science.1080418. - DOI - PubMed
    1. Amon A. Synchronization procedures. Methods in Enzymology. 2002;351:457–467. doi: 10.1016/S0076-6879(02)51864-4. - DOI - PubMed
    1. Bagriantsev SN, Gracheva EO, Richmond JE, Liebman SW. Variant-specific [PSI+] infection is transmitted by Sup35 polymers within [PSI+] aggregates with heterogeneous protein composition. Molecular Biology of the Cell. 2008;19:2433–2443. doi: 10.1091/mbc.E08-01-0078. - DOI - PMC - PubMed
    1. Broadley SA, Hartl FU. The role of molecular chaperones in human misfolding diseases. FEBS Letters. 2009;583:2647–2653. doi: 10.1016/j.febslet.2009.04.029. - DOI - PubMed
    1. Carmichael J, Chatellier J, Woolfson A, Milstein C, Fersht AR, Rubinsztein DC. Bacterial and yeast chaperones reduce both aggregate formation and cell death in mammalian cell models of Huntington's disease. Proceedings of the National Academy of Sciences of USA. 2000;97:9701–9705. doi: 10.1073/pnas.170280697. - DOI - PMC - PubMed

Publication types

LinkOut - more resources