

Maximally informative foraging by Caenorhabditis elegans
- PMID: 25490069
- PMCID: PMC4358340
- DOI: 10.7554/eLife.04220
Maximally informative foraging by Caenorhabditis elegans
Abstract
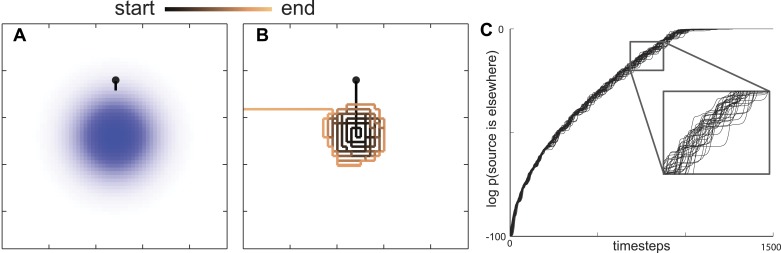
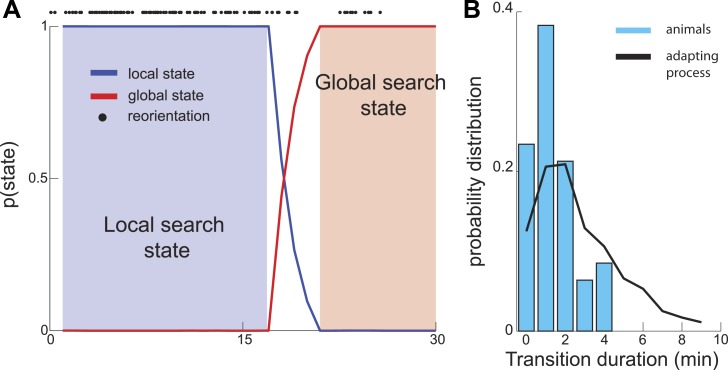
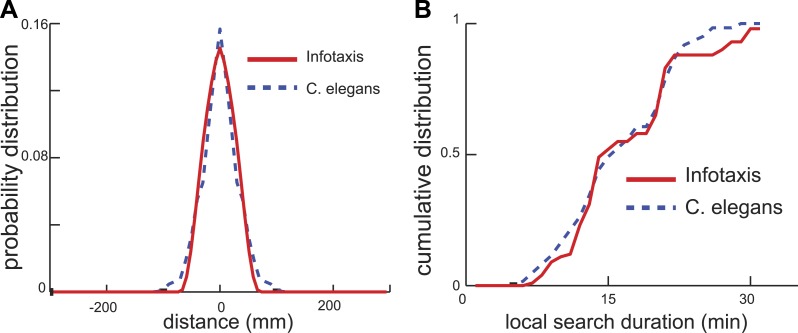
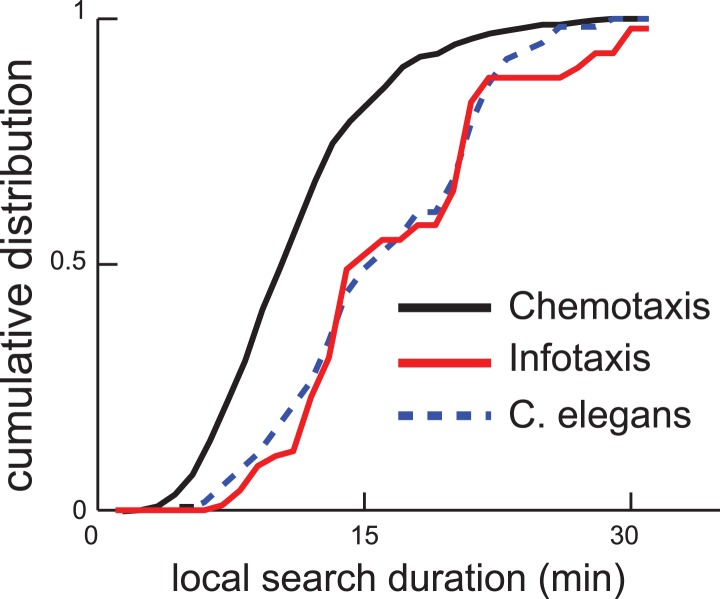
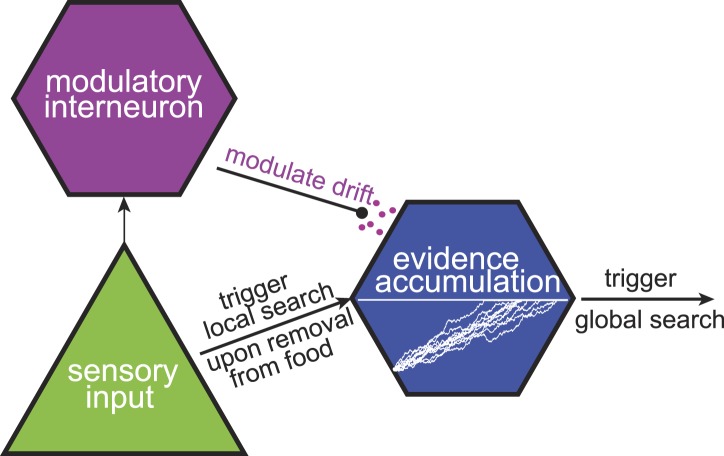
Animals have evolved intricate search strategies to find new sources of food. Here, we analyze a complex food seeking behavior in the nematode Caenorhabditis elegans (C. elegans) to derive a general theory describing different searches. We show that C. elegans, like many other animals, uses a multi-stage search for food, where they initially explore a small area intensively ('local search') before switching to explore a much larger area ('global search'). We demonstrate that these search strategies as well as the transition between them can be quantitatively explained by a maximally informative search strategy, where the searcher seeks to continuously maximize information about the target. Although performing maximally informative search is computationally demanding, we show that a drift-diffusion model can approximate it successfully with just three neurons. Our study reveals how the maximally informative search strategy can be implemented and adopted to different search conditions.
Keywords: C. elegans; decision making; drift-diffusion model; information theory; neuroscience.
Conflict of interest statement
The authors declare that no competing interests exist.
Figures


Similar articles
-
C. elegans foraging as a model for understanding the neuronal basis of decision-making.Cell Mol Life Sci. 2024 Jun 8;81(1):252. doi: 10.1007/s00018-024-05223-1. Cell Mol Life Sci. 2024. PMID: 38849591 Free PMC article. Review.
-
Food Search Strategy Changes in Caenorhabditis elegans under Chronic Starvation Conditions.J Exp Zool A Ecol Genet Physiol. 2016 Aug;325(7):409-14. doi: 10.1002/jez.2025. Epub 2016 Jul 21. J Exp Zool A Ecol Genet Physiol. 2016. PMID: 27439355
-
Neural Mechanisms for Evaluating Environmental Variability in Caenorhabditis elegans.Neuron. 2015 Apr 22;86(2):428-41. doi: 10.1016/j.neuron.2015.03.026. Epub 2015 Apr 9. Neuron. 2015. PMID: 25864633 Free PMC article.
-
Dietary choice behavior in Caenorhabditis elegans.J Exp Biol. 2006 Jan;209(Pt 1):89-102. doi: 10.1242/jeb.01955. J Exp Biol. 2006. PMID: 16354781 Free PMC article.
-
Nematode memory: now, where was I?Curr Biol. 2005 May 24;15(10):R374-5. doi: 10.1016/j.cub.2005.05.005. Curr Biol. 2005. PMID: 15916936 Review.
Cited by
-
Multi-camera field monitoring reveals costs of learning for parasitoid foraging behaviour.J Anim Ecol. 2021 Jul;90(7):1635-1646. doi: 10.1111/1365-2656.13479. Epub 2021 May 21. J Anim Ecol. 2021. PMID: 33724445 Free PMC article.
-
Mechanisms of Variability Underlying Odor-Guided Locomotion.Front Behav Neurosci. 2022 May 4;16:871884. doi: 10.3389/fnbeh.2022.871884. eCollection 2022. Front Behav Neurosci. 2022. PMID: 35600988 Free PMC article. Review.
-
Behavioral control by depolarized and hyperpolarized states of an integrating neuron.Elife. 2021 Nov 5;10:e67723. doi: 10.7554/eLife.67723. Elife. 2021. PMID: 34738904 Free PMC article.
-
Farming and public goods production in Caenorhabditis elegans populations.Proc Natl Acad Sci U S A. 2017 Feb 28;114(9):2289-2294. doi: 10.1073/pnas.1608961114. Epub 2017 Feb 9. Proc Natl Acad Sci U S A. 2017. PMID: 28183799 Free PMC article.
-
Continuous, long-term crawling behavior characterized by a robotic transport system.bioRxiv [Preprint]. 2023 Feb 28:2023.02.27.530235. doi: 10.1101/2023.02.27.530235. bioRxiv. 2023. Update in: Elife. 2023 Aug 03;12:e86585. doi: 10.7554/eLife.86585. PMID: 36909608 Free PMC article. Updated. Preprint.
References
-
- Barbieri C, Cocco S, Monasson R. On the trajectories and performance of infotaxis: an information-based greedy search algorithm. Europhysics Letters. 2011;94:20005. doi: 10.1209/0295-5075/94/20005. - DOI
-
- Benedix J. Area-restricted search by plains pocket gopher (Geormys bursarisus) in tall grass prairie habitat. Behavioral Ecology. 1993;4:318–324. doi: 10.1093/beheco/4.4.318. - DOI
