An official website of the United States government
The .gov means it’s official.
Federal government websites often end in .gov or .mil. Before
sharing sensitive information, make sure you’re on a federal
government site.
The site is secure.
The https:// ensures that you are connecting to the
official website and that any information you provide is encrypted
and transmitted securely.
Membrane constriction is a prerequisite for cell division. The most common membrane constriction system in prokaryotes is based on the tubulin homologue FtsZ, whose filaments in E. coli are anchored to the membrane by FtsA and enable the formation of the Z-ring and divisome. The precise architecture of the FtsZ ring has remained enigmatic. In this study, we report three-dimensional arrangements of FtsZ and FtsA filaments in C. crescentus and E. coli cells and inside constricting liposomes by means of electron cryomicroscopy and cryotomography. In vivo and in vitro, the Z-ring is composed of a small, single-layered band of filaments parallel to the membrane, creating a continuous ring through lateral filament contacts. Visualisation of the in vitro reconstituted constrictions as well as a complete tracing of the helical paths of the filaments with a molecular model favour a mechanism of FtsZ-based membrane constriction that is likely to be accompanied by filament sliding.
Keywords:
C. crescentus; E. coli; FtsZ; bacterial cytoskeleton; cell biology; cell division; cytokinesis; electron tomography; infectious disease; microbiology.
The authors declare that no competing interests exist.
Figures
Figure 1.. FtsZ forms bands of filaments…
Figure 1.. FtsZ forms bands of filaments completely encircling C. crescentus and E. coli division…
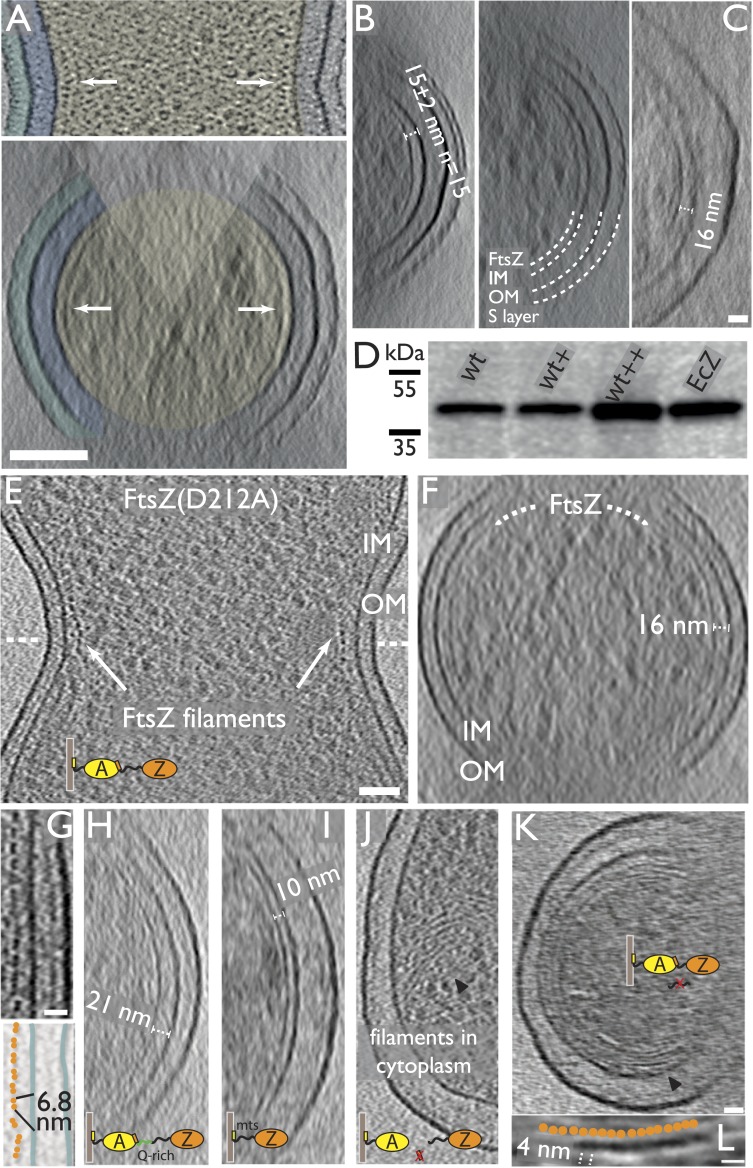
Figure 1.. FtsZ forms bands of filaments completely encircling C. crescentus and E. coli division sites, as visualised by electron cryotomography.
(A) C. crescentus NA1000/CB15N division
site with filaments near the inner membrane IM (top panel, black dots
highlighted by arrow, see also Video
1). Bottom panel shows the same cell rotated 90° around
the short axis of the cell. The Z ring (arrow) is continuous and only
invisible where there is no image because of the missing wedge (shaded
triangle) (see Figure 1—figure
supplement 1 for more details on the missing wedge problem).
The cytoplasm (beige), periplasm (blue), and space between the OM and S
layer (cyan) have been coloured for clarity. (B) More
examples of continuous FtsZ rings found in C. crescentus
cells. The filaments were on average 15 nm from the inner membrane.
(C) Electron cryotomographic slice of the constriction
site of a B/r H266 E. coli cell visualised perpendicular
to the longitudinal axis, showing very similar FtsZ filaments when
compared to C. crescentus (Figure 1A,B) and FtsZ(D212A) expressing E.
coli cells (Figure 1F)
and having roughly the same distance (16 nm) to the IM. Video 2 demonstrates the likely
helical nature of the arrangement of the FtsZ filaments (see also Figure 1—figure supplement
2). (D) Western blot showing total FtsZ levels in
cells used in (E–G) are about 2.5×
that of wild-type cells. (+) refers to un-induced, (++)
was induced by 0.02% arabinose. EcZ is purified E. coli
FtsZ protein. (E–G) 10-nm thick electron
cryotomographic slices of E. coli cells expressing
FtsZ(D212A) protein in a wild-type B/r H266 background. See also Figure 1—figure supplement
3. (E) E. coli division site showing
the cross-section of FtsZ filaments (single row of black dots) at the
constriction site. See Video
3. (F) Visualisation of the same cell along the
longitudinal axis shows that FtsZ filaments are located ∼16 nm
from the inner membrane (IM). (G) Closer examination of the
constriction site of another cell with higher expression level reveals
FtsZ filaments form pairs, appearing as doublets of dark dots (upper) and
orange spheres in the schematic illustration, on average 6.8 nm apart
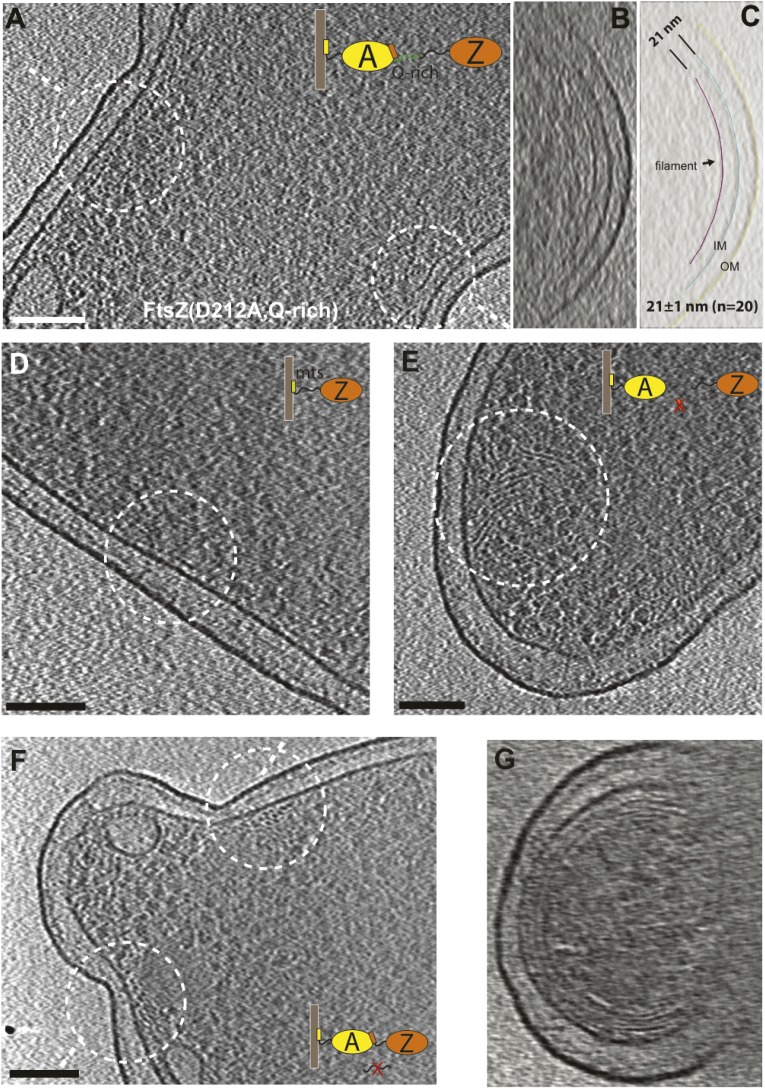
within the doublets (lower). (H–K) 10-nm
thick electron cryotomographic slices of E. coli cells
expressing engineered protein constructs based on FtsZ(D212A) (see also
Figure 1—figure
supplements 3,5 and Supplementary file 1, Table B). (H)
Extending the C-terminal linker of FtsZ by inserting a linker sequence
pushes the filaments further away from the IM (distance changed from 16
nm to a somewhat variable 16–21 nm). (I) Replacing
the C-terminal FtsA-binding sequence of FtsZ with a membrane-targeting
sequence (mts) makes FtsZ directly bind to the IM and results in FtsZ
filaments closer to IM (distance changed from 16 nm to 10 nm). No cell
constrictions were observed with this construct. (J)
Removing the C-terminal FtsA-binding sequence of FtsZ renders it unable
to maintain a fixed distance to the IM and FtsZ filaments that were
observed within the cytoplasm. (K) Removing the C-terminal
flexible linker of FtsZ makes it prone to form multiple layers of
filaments that form complete rings or helices. Tomography using this
construct works better because it produces small minicells.
(L) A closer inspection of the area marked with the black
arrowhead in G shows beads along the filament as illustrated by the
schematic drawing with a repeat distance of 4 nm as expected for FtsZ
filaments. IM: inner membrane; OM: outer membrane; WT: wild-type; Q-rich:
FtsN-derived flexible linker; mts: membrane-targeting sequence. Scale
bars: 100 nm in (A) and (B), 50 nm in
(E, F, H, I,
J), 20 nm in (C, G,
K), 10 nm in (H), 20 nm in
(L). DOI:http://dx.doi.org/10.7554/eLife.04601.003
Figure 1—figure supplement 1.. The missing wedge…
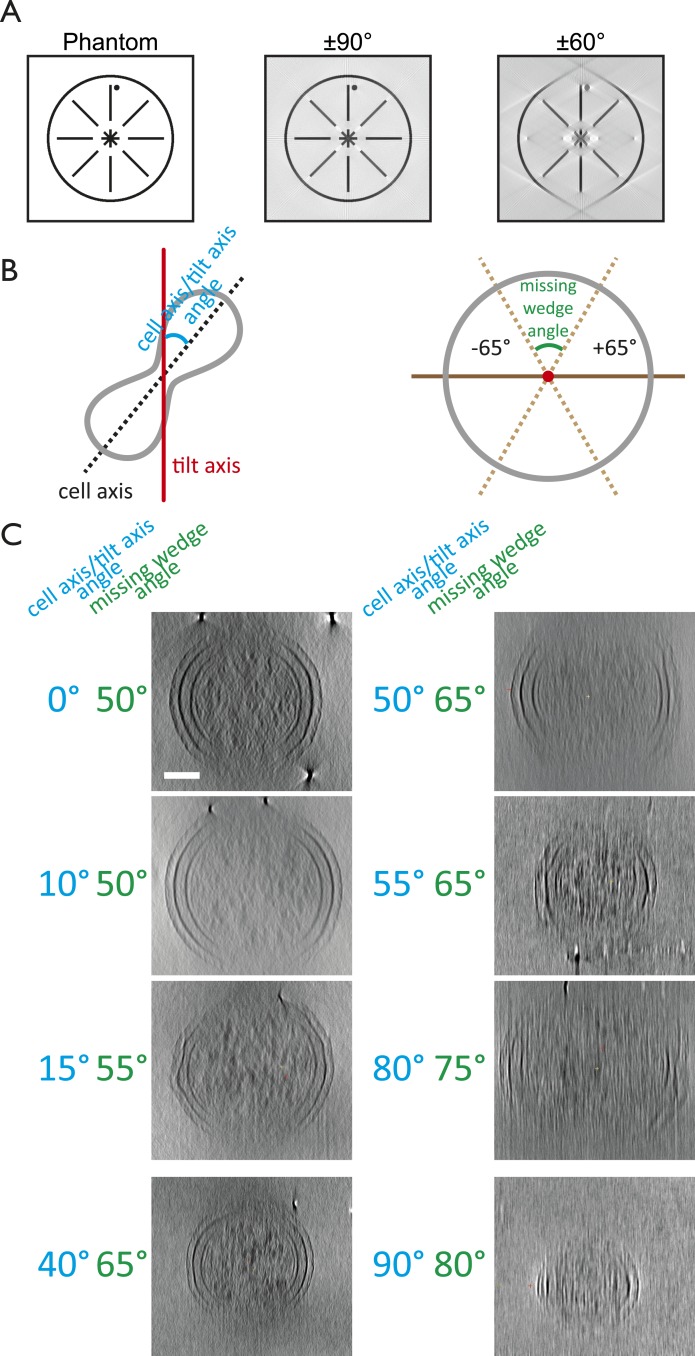
Figure 1—figure supplement 1.. The missing wedge problem in cellular electron cryotomography.
Since it is…
Figure 1—figure supplement 1.. The missing wedge problem in cellular electron cryotomography.
Since it is impossible to tilt the sample support (EM grids) from
−90° to +90° and because the thickness of the ice
film increases at high tilt angles, electron tomograms miss significant
amounts of data. (A) Simulation of the effects of the
missing wedge. Modified from Palmer and
Löwe, (2013). A phantom image resembling a cell envelope
was reconstructed for a full ±90° range and a ±60°
range, the latter being typical for tilt series acquisition.
(B) Schematic drawings explaining the angle (blue)
between the tilt axis (red) and the cell axis (black dashed line) and the
missing wedge angle (green). The former can be anything between 0 and
90°, whereas the latter can be anything between 0 and 180°.
Tilt series for the C. crescentus study (Figure 1A–B) were obtained
using the ±65° range. (C) Examples of the effects
of different orientations of cells in the microscope with respect to the
tilt axis on the missing wedge. Cells that were aligned with the tilt
axis produced the most complete tomograms since the cell thickness stayed
constant over the angular range. High tilts of those perpendicular to the
tilt axis did not provide any useful information since the effective cell
thickness in the electron beam increased. Shown are projections along the
long axis of the cell. It is important to note that the angle between the
tilt axis and the longitudinal axis of the cell is crucial in order to
obtain high quality tilt series, other factors such as cell thickness,
ice thickness, and membrane invagination progression also affect the
quality of the resulting tomograms significantly. Scale bar: 100 nm. DOI:http://dx.doi.org/10.7554/eLife.04601.004
Figure 1—figure supplement 2.. Electron cryotomograms of…
Figure 1—figure supplement 2.. Electron cryotomograms of wild-type E. coli cells show filaments at the…
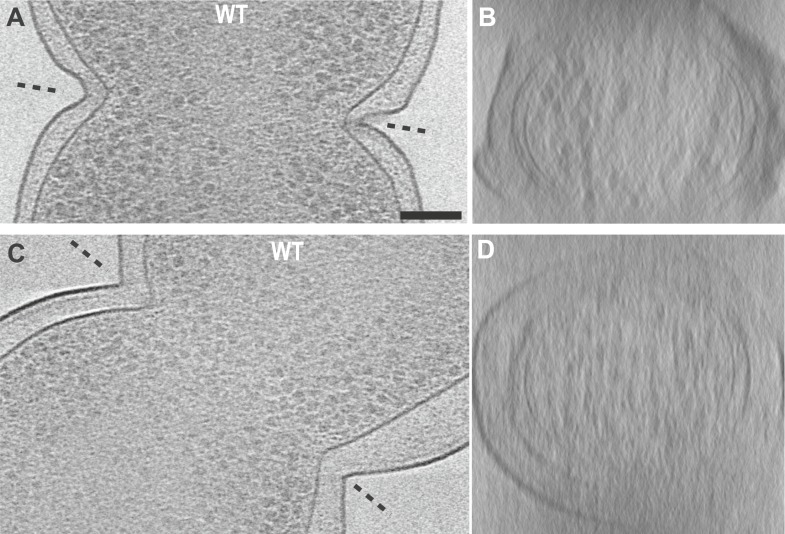
Figure 1—figure supplement 2.. Electron cryotomograms of wild-type E. coli cells show filaments at the constriction sites.
(A, C) 10-nm thick tomographic slices of two
cells showing black dots near the constriction sites corresponding to
cross-sections of filaments. Filaments are difficult to discern in this
viewing direction because of the thick E. coli cells (B,
D) Filaments are better visualised when viewed
perpendicular to the constriction planes showing filaments near the IM.
These images, together with Video
2, suggest that FtsZ forms a closed ring with slight helicity
near the constriction site. DOI:http://dx.doi.org/10.7554/eLife.04601.005
Figure 1—figure supplement 3.. FtsZ forms bands…
Figure 1—figure supplement 3.. FtsZ forms bands of filaments at constriction sites in E. coli …
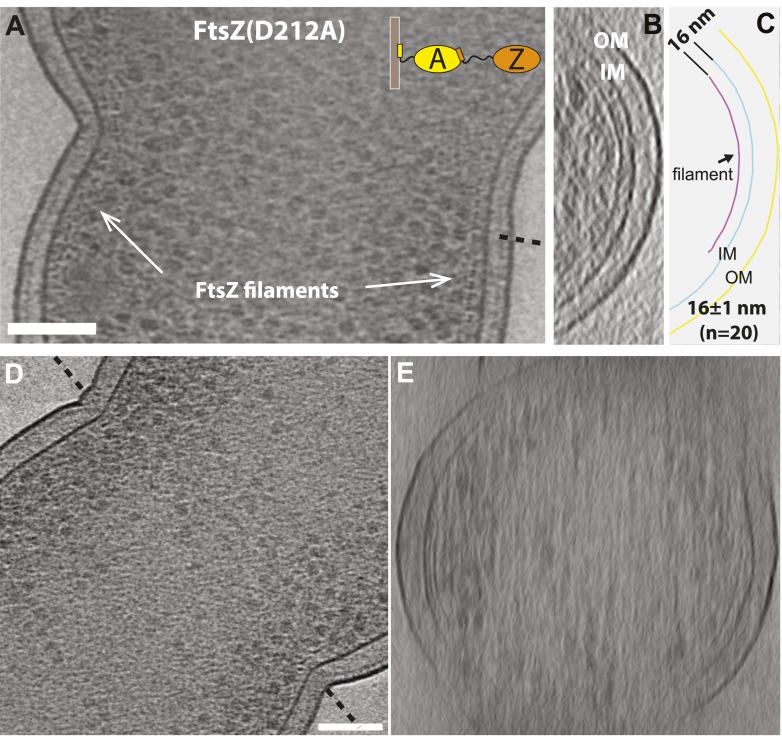
Figure 1—figure supplement 3.. FtsZ forms bands of filaments at constriction sites in E. coli cells.
(A) 10 nm electron cryotomographic slice of a cell
expressing more FtsZ(D212A) protein than in Figure 1E (corresponds to Figure 1G), oriented parallel to the longitudinal
axis, showing one layer of dots near the constriction site, corresponding
to cross-sections of FtsZ filaments that are 16 nm away from the IM.
(B) Electron cryotomographic slice of the cell viewed
perpendicular to the dashed line in (A). FtsZ filaments and
their relative position to the IM are illustrated with the schematic
representation of the tomographic slice in (C).
(D–E) 10 nm electron cryotomographic
slices of a cell with very low level expression of FtsZ(D212A) protein
(un-induced) viewed parallel to the longitudinal axis in (D)
and perpendicular to the dashed line in (D), showing similar
architecture of FtsZ filaments at the constriction site. Scale bars: 100
nm. DOI:http://dx.doi.org/10.7554/eLife.04601.006
Figure 1—figure supplement 4.. Engineered FtsZ proteins form filaments with altered localisation patterns in E.…
Figure 1—figure supplement 4.. Engineered FtsZ proteins form filaments with altered localisation patterns in E. coli cells.
(A) Extending the C-terminal flexible linker of FtsZ(D212A)
makes the protein form filaments further away from the membrane with a
distance to IM increased from 16 nm to 21 nm; (B) and
(C) are tomographic slices of the cell viewed
perpendicular to the dashed lines in (A) and segmentation
illustrating the relative positions of FtsZ filaments and the IM;
(D) cells expressing a membrane-binding FtsZ construct
produced by fusing the E. coli MinD membrane-targeting
sequence (mts) to the C-terminus of FtsZ produce filaments that are 10 nm
away from IM; (E) removing the C-terminal FtsA-binding
sequence of FtsZ gives filaments further away from the IM;
(F) FtsZ without the C-terminal flexible linker tends to
form multiple layers of filaments near the constriction site, and
(G) such filaments appear to form complete rings or
helices when viewed perpendicular to the plane of cell constriction.
Scale bars: 100 nm. DOI:http://dx.doi.org/10.7554/eLife.04601.007
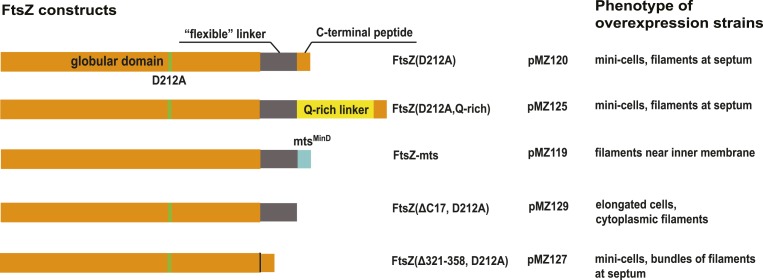
Figure 1—figure supplement 5.. Overview of FtsZ…
Figure 1—figure supplement 5.. Overview of FtsZ constructs used for in vivo tomography.
Please also…
Figure 1—figure supplement 5.. Overview of FtsZ constructs used for in vivo tomography.
Please also consult Supplementary file 1A,B. DOI:http://dx.doi.org/10.7554/eLife.04601.008
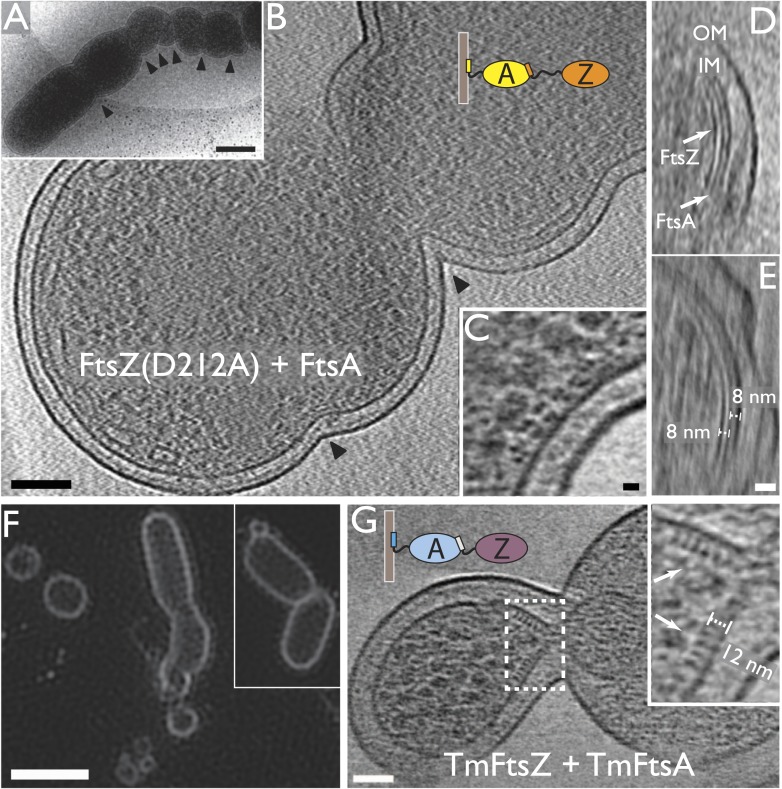
Figure 2.. Co-expression of FtsZ and FtsA…
Figure 2.. Co-expression of FtsZ and FtsA in E. coli cells leads to extra septa.
Figure 2.. Co-expression of FtsZ and FtsA in E. coli cells leads to extra septa.
(A) A low-magnification 2D electron cryomicrograph
(transmission) showing multiple constriction sites (marked with black
arrowheads) along the cell. (B–E) 10-nm
thick electron cryotomographic slices of cells co-expressing FtsZ(D212A) and
FtsA (bicistronic, 1:1). Two layers of dots are visible at constriction
sites in (B) and (C), corresponding to FtsZ
filaments and FtsA filaments, respectively, as labelled in the orthogonal
view along the long axis of the cell (D). FtsA filaments are
almost in the middle between FtsZ filaments and the IM, at a distance of 8
nm from both FtsZ filament and IM as indicated in (E).
(F) Structured illumination microscopy images of cells
expressing FtsZ(D212A) and FtsA, showing cell division and minicell
formation, proving that the extra septa function to completion.
(G) 10-nm thick electron cryotomographic slice of an
E. coli minicell formed from cells expressing
Thermotoga maritima FtsZ and FtsA proteins, with a
deeply constricted area showing cross-sections of FtsZ and FtsA filaments
(black dots marked with white arrows). Distance between FtsZ filaments and
IM is around 12 nm (inset in G). The view highlights striking
similarities to the in vitro reconstruction shown in Figure 3H–J & 5C. IM: inner membrane;
OM: outer membrane. Scale bars: 500 nm in (A), 100 nm in
(B), 10 nm in (C, and also for inset in
G), 20 nm in (E, and also for D),
2 μm in (F). DOI:http://dx.doi.org/10.7554/eLife.04601.012
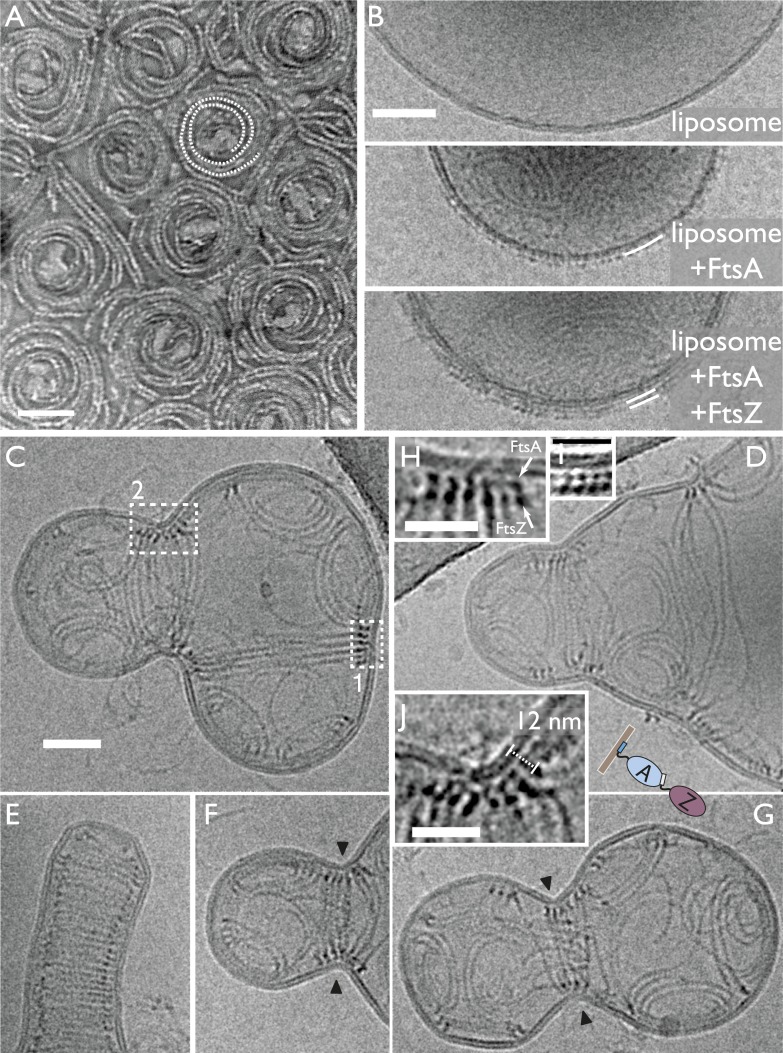
Figure 3.. In vitro reconstitution of bacterial…
Figure 3.. In vitro reconstitution of bacterial cell membrane constriction by the FtsZ ring from…
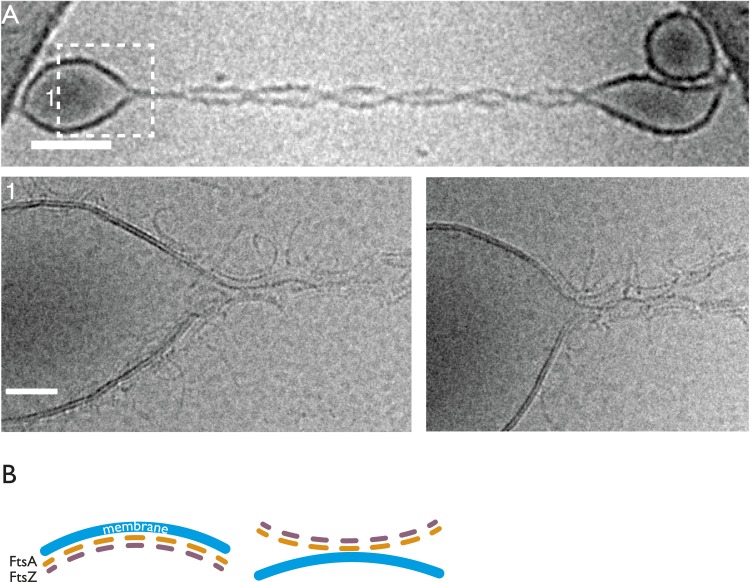
Figure 3.. In vitro reconstitution of bacterial cell membrane constriction by the FtsZ ring from purified components.
(A) Thermotoga maritima FtsA (TmFtsA) and
Thermotoga maritima FtsZ (TmFtsZ) form spirals on a
flat lipid monolayer, as indicated by a white dotted line. The filaments
tend to appear as double strands (doublets). Negative-stain electron
microscopy. (B) Transmission electron cryomicroscopy allows
resolution of the inner and outer leaflet of undisturbed liposomes (top
panel). When TmFtsA is added to the outside, an additional layer of
density corresponding to FtsA becomes apparent (middle panel).
Recruitment of TmFtsZ by TmFtsA leads to the formation of two layers
(bottom panel). Taken together, we conclude that FtsA is sandwiched
between the membrane and FtsZ filaments (bottom panel). See also Figure 3—figure supplement 1
and Figure 3—figure supplement
2. (C–G) Constriction sites
are efficiently formed when TmFtsA and TmFtsZ are encapsulated in
liposomes that have sizes comparable to bacterial cells. Five
representative liposomes are shown using transmission electron
cryomicroscopy (hence are 2D projections of 3D objects). Importantly,
constriction sites are only formed where a ring made of the two proteins
is present (black arrowheads) and not at other sites where filaments are
located. The TmFtsA and TmFtsZ layers are clearly visible (inset
H, same as boxed area ‘1’ in
C; inset J, same as boxed area
‘2’ in C and inset I, which is
from Figure 4 electron
cryotomography data) and the protein's organisation mirrors that present
in E. coli cells (compare with Figure 2C). The distance of 12 nm between TmFtsZ and
the membrane (inset J) resembles that found in
over-expressing cells (see Figure
2G and also Figure 5C).
(E) Intriguingly, liposomes are being constricted
(partially) in the absence of added nucleotide. Scale bars: 50 nm in
(A–C), 25 nm for insets. DOI:http://dx.doi.org/10.7554/eLife.04601.013
Figure 3—figure supplement 1.. TmFtsZ and TmFtsA…
Figure 3—figure supplement 1.. TmFtsZ and TmFtsA on the outside of liposomes and in the…
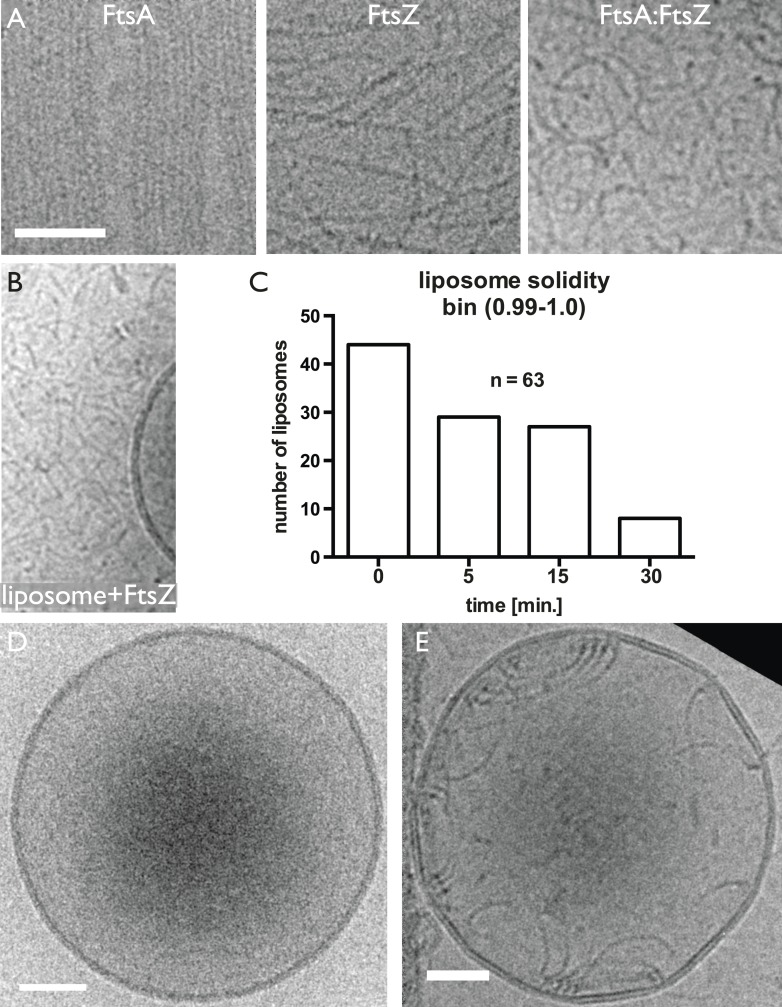
Figure 3—figure supplement 1.. TmFtsZ and TmFtsA on the outside of liposomes and in the presence of GMPCPP deform liposomes.
(A) Low-magnification (upper panel). More detailed snapshots
(lower panel) show that the filaments are on the outside; however, they
do not form rings but curved structures that are positioned in areas of
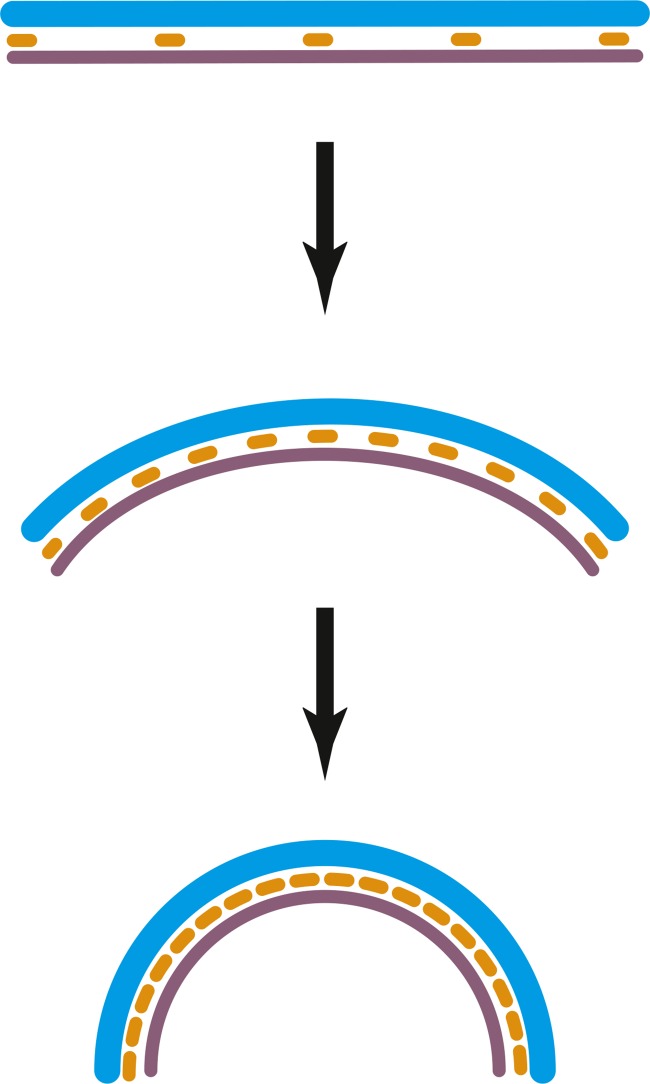
negative membrane curvature that they probably induce. (B)
Schematic representation of the curvature produced by co-polymerisation
of FtsA and FtsZ, which have differing repeat distances of 5 and 4 nm,
respectively. Since FtsA binds to the membrane, this arrangement will
lead to negative curvature. Hence, the intrinsic, negative curvature of
the FtsA:FtsZ filaments fits the curvature of the membrane on the inside.
However, on the outside, the membrane curvature is positive, as is also
shown in Figure 4—figure
supplement 1. DOI:http://dx.doi.org/10.7554/eLife.04601.014
Figure 3—figure supplement 2.. Control experiments showing…
Figure 3—figure supplement 2.. Control experiments showing that both TmFtsA and TmFtsZ form straight filaments…
Figure 3—figure supplement 2.. Control experiments showing that both TmFtsA and TmFtsZ form straight filaments when polymerised separately. And liposomes deform mostly after dilution.
(A) When mixed, FtsA and FtsZ form curved filaments (right
panel). (B) TmFtsZ does not bind to liposomes on its own.
Random electron cryomicroscopy images taken immediately after detergent
dilution were analysed for liposome deformations. The plot in
(C) shows the number of liposomes, out of 63, that are
perfectly round (as per solidity quantity, defined in (ImageJ)). Clearly,
liposomes become more deformed over a 30-min period after dilution.
(D) Shows a spherical liposome without proteins added and
(E) at time point 0 min, right after dilution. Scale bars
50 nm. DOI:http://dx.doi.org/10.7554/eLife.04601.015
Figure 4.. Electron cryotomography of liposomes constricted…
Figure 4.. Electron cryotomography of liposomes constricted in vitro by rings of TmFtsA and TmFtsZ.
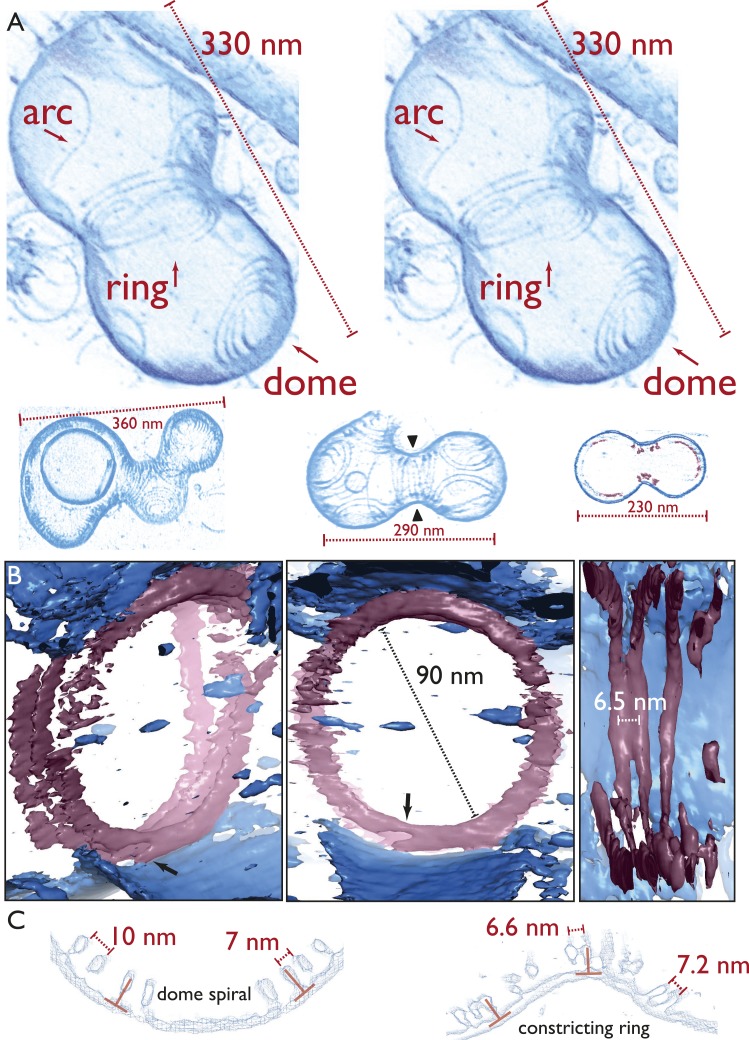
Figure 4.. Electron cryotomography of liposomes constricted in vitro by rings of TmFtsA and TmFtsZ.
(A) Stereo view of a representative liposome highlighting
three different structures made by the enclosed TmFtsA and TmFtsZ
proteins. Note that our images derived from tomographic volume data have
not been segmented, they are volume representations of the actual 3D
tomographic data. Arcs (also on the outside) are filaments made of both
FtsA and FtsZ, whose curvature is determined by the mismatch in TmFtsA
and TmFtsZ polymers subunit spacing (5 nm vs 4 nm, see also Figure 3—figure supplement 1
& Figure 4—figure
supplement 2). Dome-like structures are slightly helical
spirals of condensing TmFtsZ filaments attached to the membrane by
TmFtsA. Importantly, only complete rings seem capable of constriction
force generation. The ring might consist of overlapping filaments (as in
the stereo view and Video 10)
or maybe a continuous helix of double filaments (bottom panel, middle
liposome with black arrowheads, see also Figure 4—figure supplement 1 and Video 6). The bottom panel
depicts more examples of different liposome shapes and sizes. The
cross-section (right) shows the distribution of filaments (red) inside a
liposome (membrane in blue) (bottom right). Video 4 shows a complete 3D volume in grey scale.
Video 5 shows a slice view
at high magnification, demonstrating the excellent contrast these
specimens generate, making it possible to see individual subunits and
complete filament traces. Videos 6–9 show 3D
views of several constricted liposomes. Figure
4—source data 1 enables 3D viewing of a liposome volume
with PyMOL. (B) Close-up view of the FtsZ ring (purple)
attached to the membrane (blue), here shown as single-threshold surface
representations (these are not automatic or manual segmentations). The
filaments overlap and interact laterally (left panel). View along the
long axis shows that the ring is a perfect closed circle (middle panel).
The black arrow points to where TmFtsZ and TmFtsA filaments are fully
detached from each other. Individual filaments are resolved (right
panel). Video 10 shows a 3D
walk-through the liposome, highlighting most features on the way.
(C) Comparison of filament arrangements and geometries
within the dome-like structures (left panel) and ring-like structures
(right panel). Cross-sections demonstrate that in both cases, the TmFtsAZ
filaments are positioned close to perpendicular with respect to the
membrane (red symbols). However, the constriction force is generated only
in the rings (see Figure 5D for
explanation). DOI:http://dx.doi.org/10.7554/eLife.04601.016
Figure 4—figure supplement 1.. Constrictions occur only at the site of filament ring formation.
A…
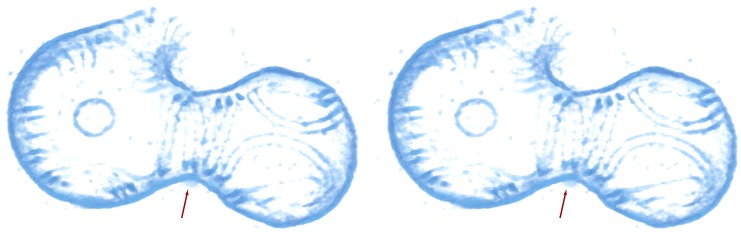
Figure 4—figure supplement 1.. Constrictions occur only at the site of filament ring formation.
A stereo view of the liposome marked with the black arrowheads in Figure 4A (bottom middle panel). A
single helix made of filament doublets is marked with red arrow. Video 6 shows its architecture in
more detail and in 3D. DOI:http://dx.doi.org/10.7554/eLife.04601.018
Figure 4—figure supplement 2.. A mechanism explaining…
At some stages of constriction, the ratio of FtsZ to FtsA in the ring may
be higher than one. Normally, there is around five times more FtsZ in
cells than FtsA, therefore only a few FtsA molecules may be sandwiched in
between the IM and FtsZ filaments (which form more easily than FtsA
filaments), upper panel. As curvature increases, the mismatch of the FtsA
(orange) and FtsZ (grey) repeats (5 vs 4 nm, respectively) makes it
possible to add more FtsA since the double filament ‘wants’
to bend. Full occupancy of both FtsA and FtsZ in the double filament
leads to a curvature of about 60 nm. This mechanism could be another
source of energy for constriction in addition to or alternative to the
condensation energy gained from filament overlap (mechanism
B) in the discussion. DOI:http://dx.doi.org/10.7554/eLife.04601.019
Figure 5.. Visualising the FtsZ ring at…
Figure 5.. Visualising the FtsZ ring at the molecular level.
( A ) A semi-atomic…
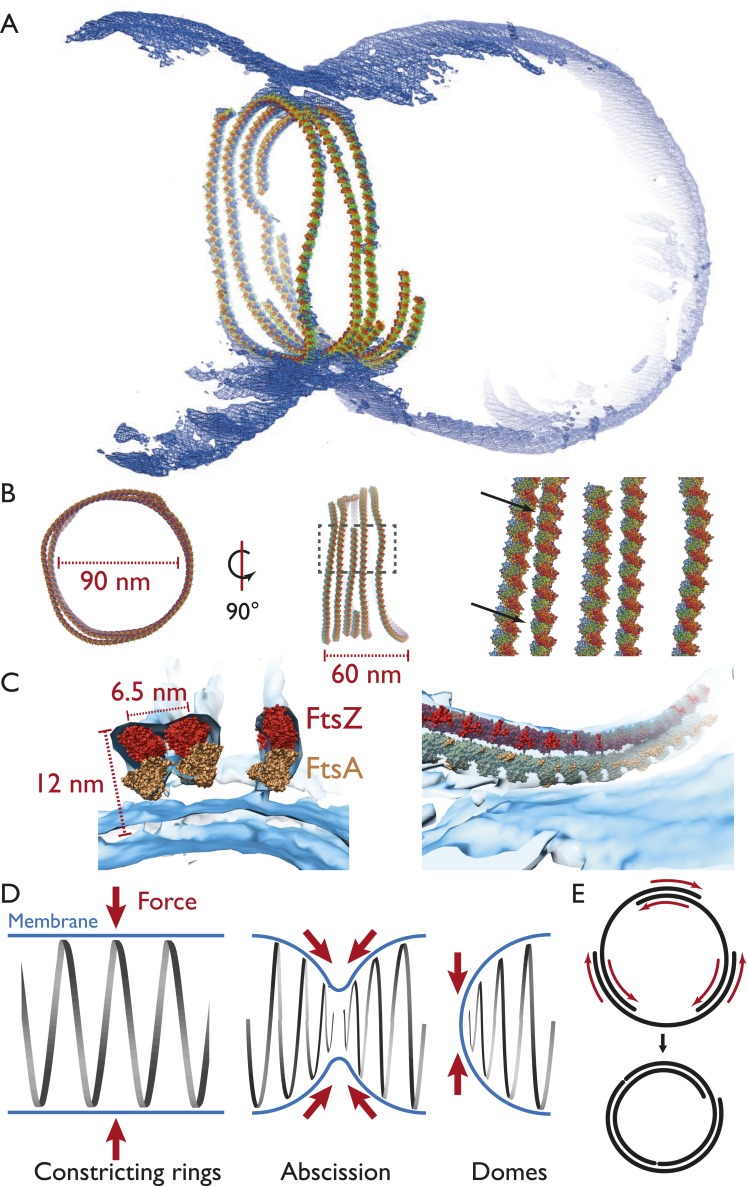
Figure 5.. Visualising the FtsZ ring at the molecular level.
(A) A semi-atomic model of the FtsZ ring constricting a
liposome. 294 monomers of S. aureus FtsZ have been roughly
positioned using a spline-fitting approach (PDB 3VO8 (Matsui et al., 2012)). This uses the same tomography
data as Figure 4A. (B)
The ring is 90 nm in diameter (left) and 60-nm thick (middle). It consists
of at least four individual filaments (right, atoms shown as spheres) with
varying lateral interfilament distances (right, atoms shown as spheres,
black arrows). (C) FtsZ filaments are single protofilaments,
but they tend to pair in doublets. A precision manual fit of the TmFtsA
polymer crystal structure (PDB 4A2B) (Szwedziak et al., 2012) in addition to 3VO8 FtsZ polymer crystal
structure was performed in a region of very good density. The fit is
excellent and dimensions and distances match well with CcFtsZ, EcFtsZ, and
TmFtsAZ in vivo situations (Figure
1A,E, 2E,G). (D) Left: in the ring-like structures
(black), force (red arrows) is perpendicular to the membrane (blue), leading
to constriction. Middle: during constriction, the ring develops into two
helical spirals, leading to forces pushing membrane inwards, and this might
explain how abscission is accomplished since membranes will presumably not
fuse while the protein filaments are in between (see Figure 4A bottom right and Video 9 for an example of this in liposomes). Right:
the domes we observed do not deform liposomes because the force generated is
almost perfectly tangential to the membrane. (E) Constriction
force generation and filament sliding. In the discussion, three different
energy sources for constriction are listed: maximising filament overlap,
repeat mismatch within FtsA–FtsZ copolymers (Figure 4—figure supplement 2) and filament
shortening and turnover due to nucleotide hydrolysis by FtsAZ. While it is
currently not obvious which of these or if a combination of the three
mechanisms drives constriction, it seems clear to us that constriction, at
least in the liposome reconstitution experiments, requires filaments to
slide past each other as is depicted in two dimensions. Since also
unmodified wild-type cells (Figure 1)
show closed continuous rings at division sites, we would assume the same
holds true in vivo. Filament sliding can also explain the spirals on lipid
monolayers (Figure 3A) and spirals in
the dome-like structures with liposomes (Figure 4A). The schematic drawn is a simplification into two
dimensions, of course, in vivo and in vitro FtsZ filaments overlap in the
third dimension, forming single-layered bands since each filament is
anchored to the membrane. DOI:http://dx.doi.org/10.7554/eLife.04601.027
Adams DW, Errington J. Bacterial cell division: assembly, maintenance and disassembly of the Z ring. Nature Reviews. Microbiology. 2009;7:642–653. doi: 10.1038/nrmicro2198.
-
DOI
-
PubMed
Agulleiro JI, Fernandez JJ. Fast tomographic reconstruction on multicore computers. Bioinformatics. 2011;27:582–583. doi: 10.1093/bioinformatics/btq692.
-
DOI
-
PubMed
Amat F, Moussavi F, Comolli LR, Elidan G, Downing KH, Horowitz M. Markov random field based automatic image alignment for electron tomography. Journal of Structural Biology. 2008;161:260–275. doi: 10.1016/j.jsb.2007.07.007.
-
DOI
-
PubMed
Begg K, Nikolaichik Y, Crossland N, Donachie WD. Roles of FtsA and FtsZ in activation of division sites. Journal of Bacteriology. 1998;180:881–884.
-
PMC
-
PubMed
Bernhardt TG, de Boer PA. SlmA, a nucleoid-associated, FtsZ binding protein required for blocking septal ring assembly over Chromosomes in E. coli. Molecular Cell. 2005;18:555–564. doi: 10.1016/j.molcel.2005.04.012.
-
DOI
-
PMC
-
PubMed