. 2014 Dec 9:3:e04531.
doi: 10.7554/eLife.04531.

RNA virus attenuation by codon pair deoptimisation is an artefact of increases in CpG/UpA dinucleotide frequencies

Affiliations

RNA virus attenuation by codon pair deoptimisation is an artefact of increases in CpG/UpA dinucleotide frequencies

Fiona Tulloch et al. Elife. .

Abstract

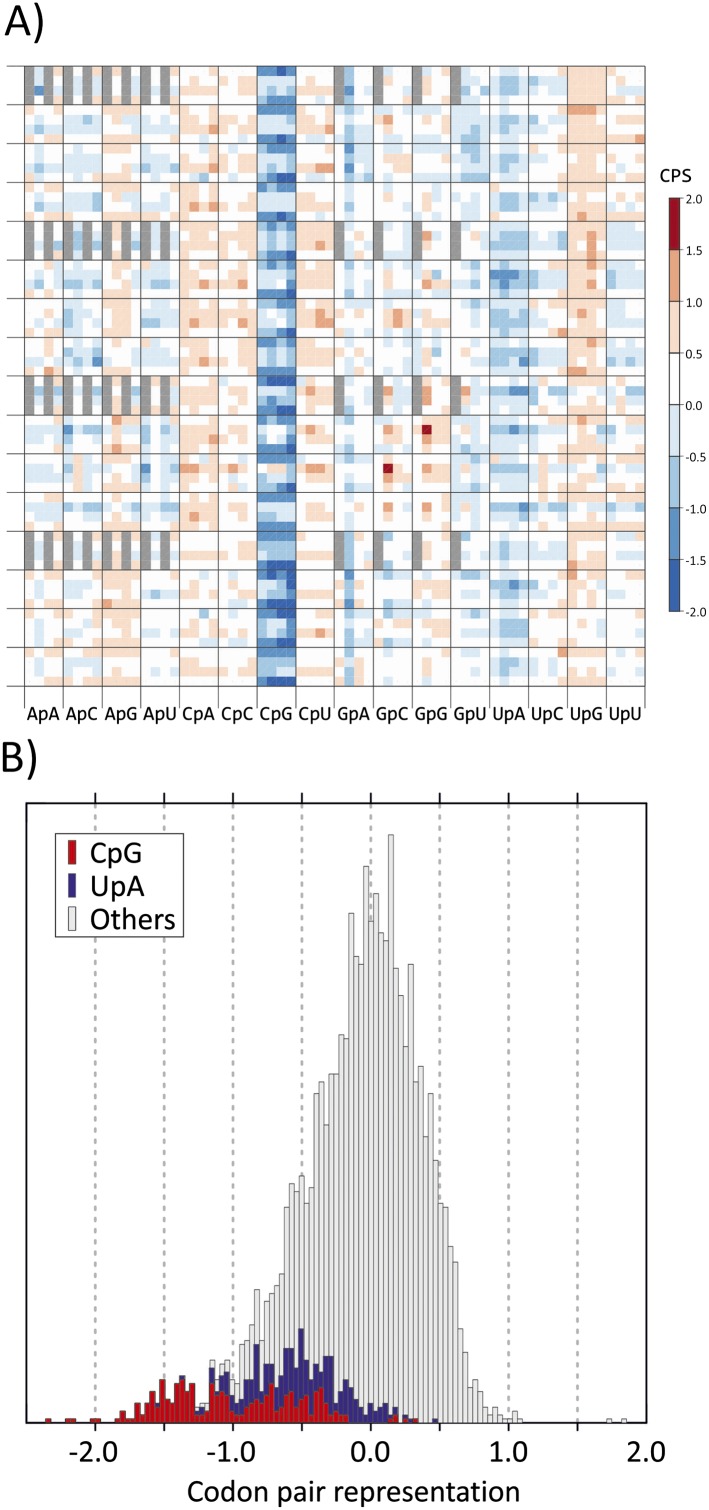
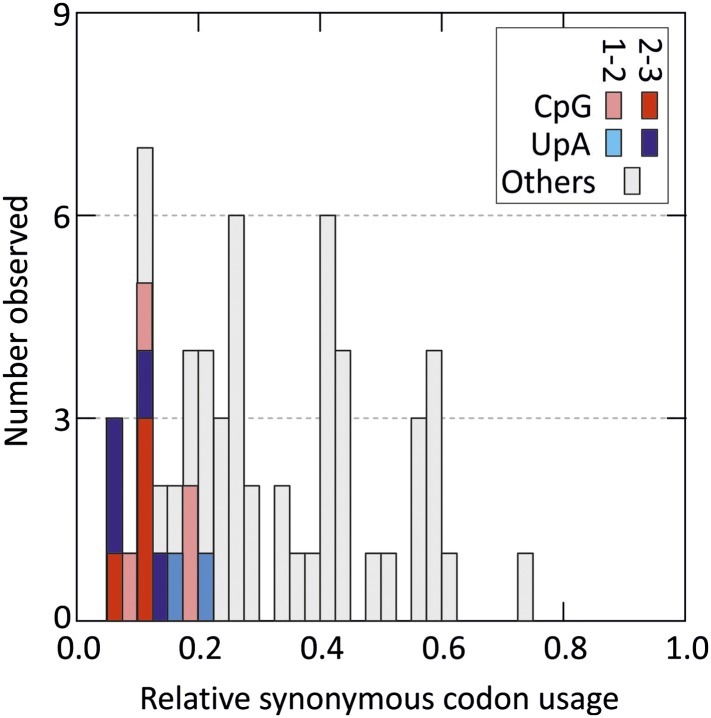
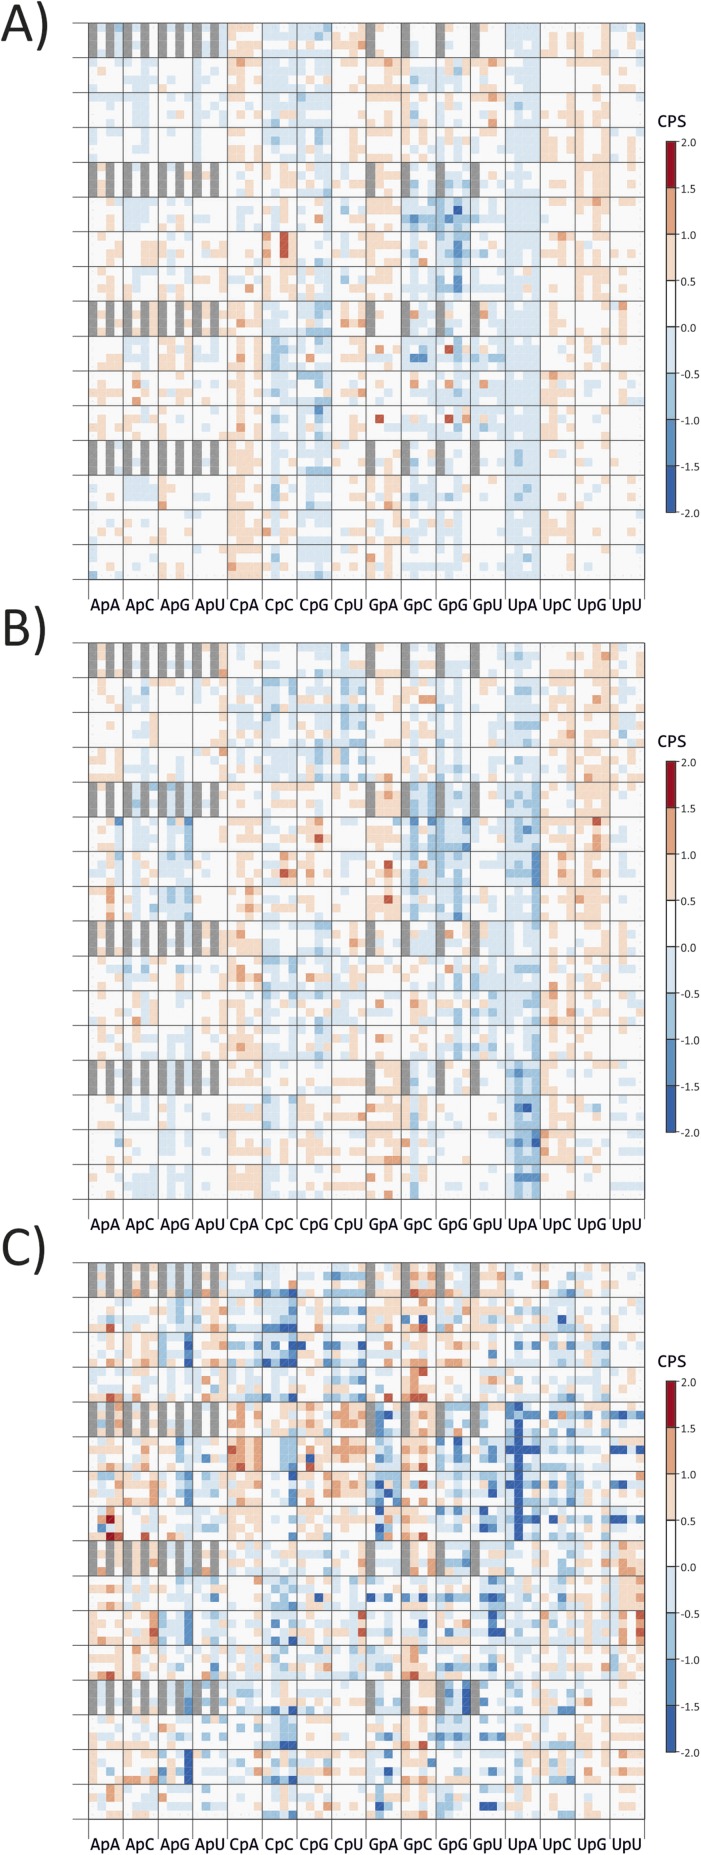
Mutating RNA virus genomes to alter codon pair (CP) frequencies and reduce translation efficiency has been advocated as a method to generate safe, attenuated virus vaccines. However, selection for disfavoured CPs leads to unintended increases in CpG and UpA dinucleotide frequencies that also attenuate replication. We designed and phenotypically characterised mutants of the picornavirus, echovirus 7, in which these parameters were independently varied to determine which most influenced virus replication. CpG and UpA dinucleotide frequencies primarily influenced virus replication ability while no fitness differences were observed between mutants with different CP usage where dinucleotide frequencies were kept constant. Contrastingly, translation efficiency was unaffected by either CP usage or dinucleotide frequencies. This mechanistic insight is critical for future rational design of live virus vaccines and their safety evaluation; attenuation is mediated through enhanced innate immune responses to viruses with elevated CpG/UpA dinucleotide frequencies rather the viruses themselves being intrinsically defective.

Keywords: CpG; E. coli; arabidopsis; codon pair bias; dinucleotide; echovirus 7; evolutionary biology; genomics; human; infectious disease; microbiology; picornavirus; vaccine; viruses.


Conflict of interest statement

The authors declare that no competing interests exist.

Figures

Figure 1.
Figure 1.. (A) CP usage in human coding sequences arranged in a 64 x 64 grid.
CP frequencies relative to those expected from nucleotide and amino acid frequencies (CP bias) are colour coded in a heat map. The primary division on the x-axis is by identity of the 3–1 dinucleotide as annotated. Within these, further divisions within each of the 16 columns show the identity of the nucleotide at position 2 (A, C, G or U). The y-axis records nucleotides at positions 4 (4 main divisions on the y-axis), 1 (4 subdivisions of position 4) and 6 (4 subdivisions of position 1). Positions of unused codon pairs containing a 5′ stop codon (translated as *|x) are shaded in grey. CP usage heat maps for A. thaliana, C. elegans and E. coli coding sequences are shown in Figure 1—figure supplement 2A–2C. (B) Distribution of codon pair bias scores in human coding sequences; separate labelling of the 64 codon pairs with CpG (red) or UpA (blue) across the codon junction (3–1) demonstrates their consistent under-representation based on their component nucleotide and amino acid frequencies. The distribution of codon pair scores for A. thaliana, C. elegans and E. coli are shown in Figure 1—figure supplement 3A–3C. Correlations between codon pair scores between human coding sequences and those of A. thaliana, C. elegans and E. coli are shown in Figure 1—figure supplement 4. DOI: http://dx.doi.org/10.7554/eLife.04531.004
Figure 1—figure supplement 1.
Figure 1—figure supplement 1.. Distribution of relative synonymous codon usage values for degenerate codons in the human genome (stop codons were excluded).
Codons with CpG and UpA at the 1–2 or 2–3 codon position are shaded as indicated in the key (data derived from http://bioinformatics.weizmann.ac.il/databases/codon). DOI: http://dx.doi.org/10.7554/eLife.04531.005
Figure 1—figure supplement 2.
Figure 1—figure supplement 2.. CP scores of codon pairs of (A) A. thaliana, (B) C. elegans and (C) E.coli ORFeomes.
The primary division on the x-axis is by identity of the 3–1 dinucleotide (labelled on y-axis), divisions within each column show the identity of codon position 2. The y-axis records codon positions 5 (1 cycle), 1 (4 cycles) and 6 (16 cycles). Positions of codon pairs translated as *|x are shaded grey. DOI: http://dx.doi.org/10.7554/eLife.04531.006
Figure 1—figure supplement 3.
Figure 1—figure supplement 3.. Distribution of codon pair scores for other organisms-(A) A thaliana, (B) C. elegans and (C) E. coli, with separate representation of codon pairs with CpG and UpA across the codon junction.
DOI: http://dx.doi.org/10.7554/eLife.04531.007
Figure 1—figure supplement 4.
Figure 1—figure supplement 4.. Correlation between representations of human codon pairs (x-axis) with those of other organisms-(A) A thaliana, (B) C. elegans and (C) E. coli (y-axis).
DOI: http://dx.doi.org/10.7554/eLife.04531.008
Figure 2.
Figure 2.. Codon pair scores and numbers of CpG and UpA dinucleotides in native (WT) and mutated regions of E7.
Mean CP scores for Regions 1 and 2 combined are shown on the x-axis; the total numbers of CpG and UpA dinucleotides in each sequence are shown on the y-axis. The histogram shows CP scores for the 35,170 human mRNA sequences >200 bases in length (mean 0.072; standard deviation ±0.031). DOI: http://dx.doi.org/10.7554/eLife.04531.009
Figure 3.
Figure 3.. Replication of WT and mutants of E7 with altered CP and dinucleotide frequencies.
Bars are shaded diagrammatically based on their relative CpG/UpA composition. RD cells were infected with E7 WT, at an MOI of 0.03 and infectious titres quantified at 8, 18 and 30 hr time points post inoculation (p.i.) by TCID50 determination. Results are the mean of three biological replicates; error bars show standard errors of the mean. DOI: http://dx.doi.org/10.7554/eLife.04531.011
Figure 4.
Figure 4.. RD cells were co-infected with pairs of WT (W|W) and E7 mutants at equal MOI and the supernatant serially passaged through cells after development of CPE. RNA was isolated and the composition of each virus determined through selective restriction digests using enzymes listed in Table 3.
(A) Examples of three competition assays showing cleavage patterns of individual viruses (lanes 1, 2), the starting inoculum (lane 3) and two biological replicates after 10 (panels 1, 2) or 5 (panel 3) passages in lanes 4 and 5. Results from the other competition assays are shown in Figure 4—figure supplement 1. (B) Summary of pairwise fitness comparisons of viruses with outcomes for the viruses listed in columns at passages 5 and 10 indicated by colour shading. For example, Min-E and WT showed equal fitness (yellow shading) and cu|cu outcompeted WT by passage 5 (red) and Max-U by passage 10. DOI: http://dx.doi.org/10.7554/eLife.04531.012
Figure 4—figure supplement 1.
Figure 4—figure supplement 1.. Competition assays between E7 mutants showing competing variants (lanes 1 and 2) andout at indicated passage number (lane 3) for each.
DOI: http://dx.doi.org/10.7554/eLife.04531.013
Figure 5.
Figure 5.. Translation of RNA templates generated from WT and mutant E7 cDNAs in a rabbit reticulocyte cell free assay.
Assignments of bands to E7 proteins were based on molecular weights on SDS-PAGE. A comparison of densitometry values for viral proteins is shown in Figure 5—figure supplement 1. DOI: http://dx.doi.org/10.7554/eLife.04531.016
Figure 5—figure supplement 1.
Figure 5—figure supplement 1.. Translation efficiencies estimated by densitometry of band intensities of viral proteins translated in a rabbit reticulocyte cell free assay.
Translation efficiencies of mutant E7 cDNAs were quantified relative to expression from the WT template. Bars show mean values for seven viral proteins; error bars show standard errors of the mean. DOI: http://dx.doi.org/10.7554/eLife.04531.017
Figure 6.
Figure 6.. Comparison of codon pair scores generated by SSE using a dataset of 35,770 human mRNA sequences (y-axis) with those used in a previous analysis (Coleman et al., 2008).
DOI: http://dx.doi.org/10.7554/eLife.04531.018

References

    1. Atkinson NJ, Witteveldt J, Evans DJ, Simmonds P. The Influence of CpG and UpA dinucleotide frequencies on RNA virus replication and characterisation of the innate cellular pathways underlying virus attenuation and enhanced replication. Nucleic Acids Research. 2014;42:4527–4545. doi: 10.1093/nar/gku075. - DOI - PMC - PubMed
    1. Bennetzen JL, Hall BD. Codon selection in yeast. The Journal of Biological Chemistry. 1982;257:3026–3031. - PubMed
    1. Beutler E, Gelbart T, Han JH, Koziol JA, Beutler B. Evolution of the genome and the genetic code: selection at the dinucleotide level by methylation and polyribonucleotide cleavage. Proceedings of the National Academy of Sciences of USA. 1989;86:192–196. doi: 10.1073/pnas.86.1.192. - DOI - PMC - PubMed
    1. Boycheva S, Chkodrov G, Ivanov I. Codon pairs in the genome of Escherichia coli. Bioinformatics. 2003;19:987–998. doi: 10.1093/bioinformatics/btg082. - DOI - PubMed
    1. Buchan JR, Aucott LS, Stansfield I. tRNA properties help shape codon pair preferences in open reading frames. Nucleic Acids Research. 2006;34:1015–1027. doi: 10.1093/nar/gkj488. - DOI - PMC - PubMed

Publication types