. 2014 Dec 8;31(5):572-85.
doi: 10.1016/j.devcel.2014.10.025.

Microtubules regulate focal adhesion dynamics through MAP4K4

Affiliations

Microtubules regulate focal adhesion dynamics through MAP4K4

Jiping Yue et al. Dev Cell. .

Abstract

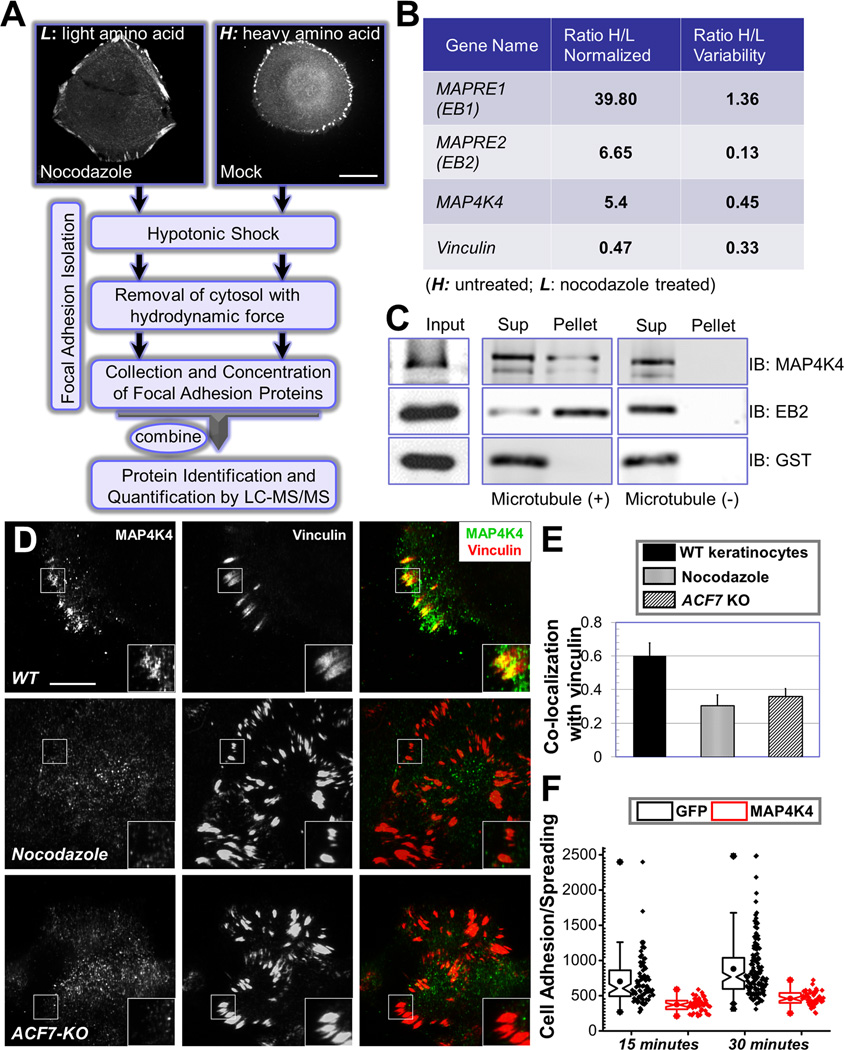
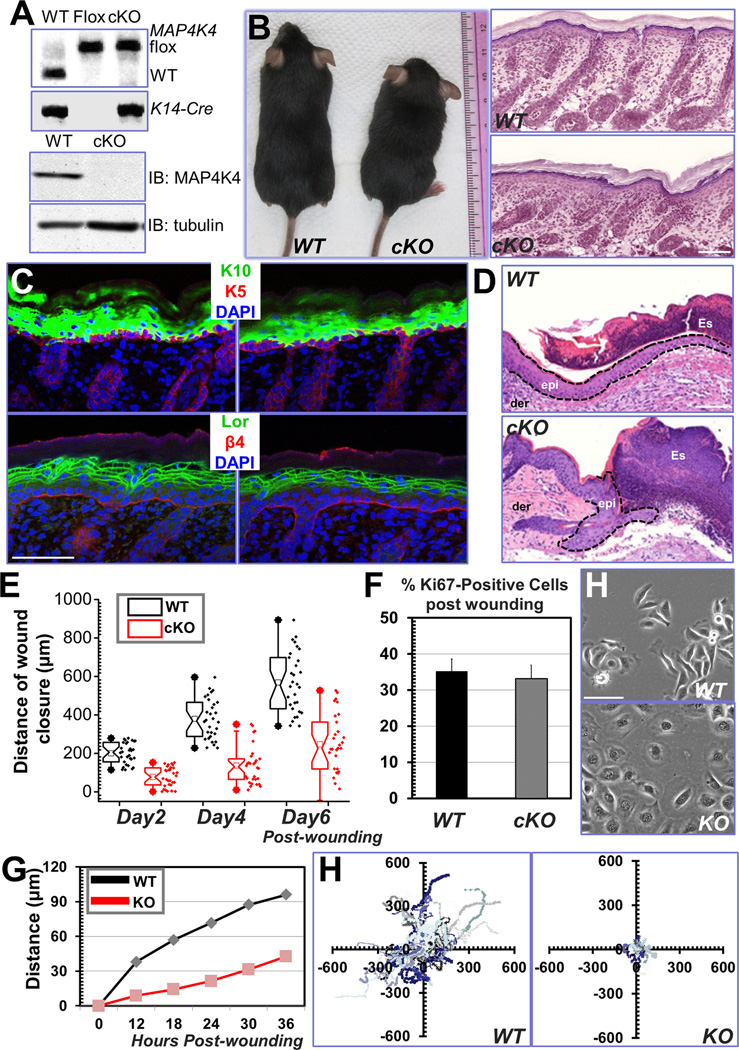
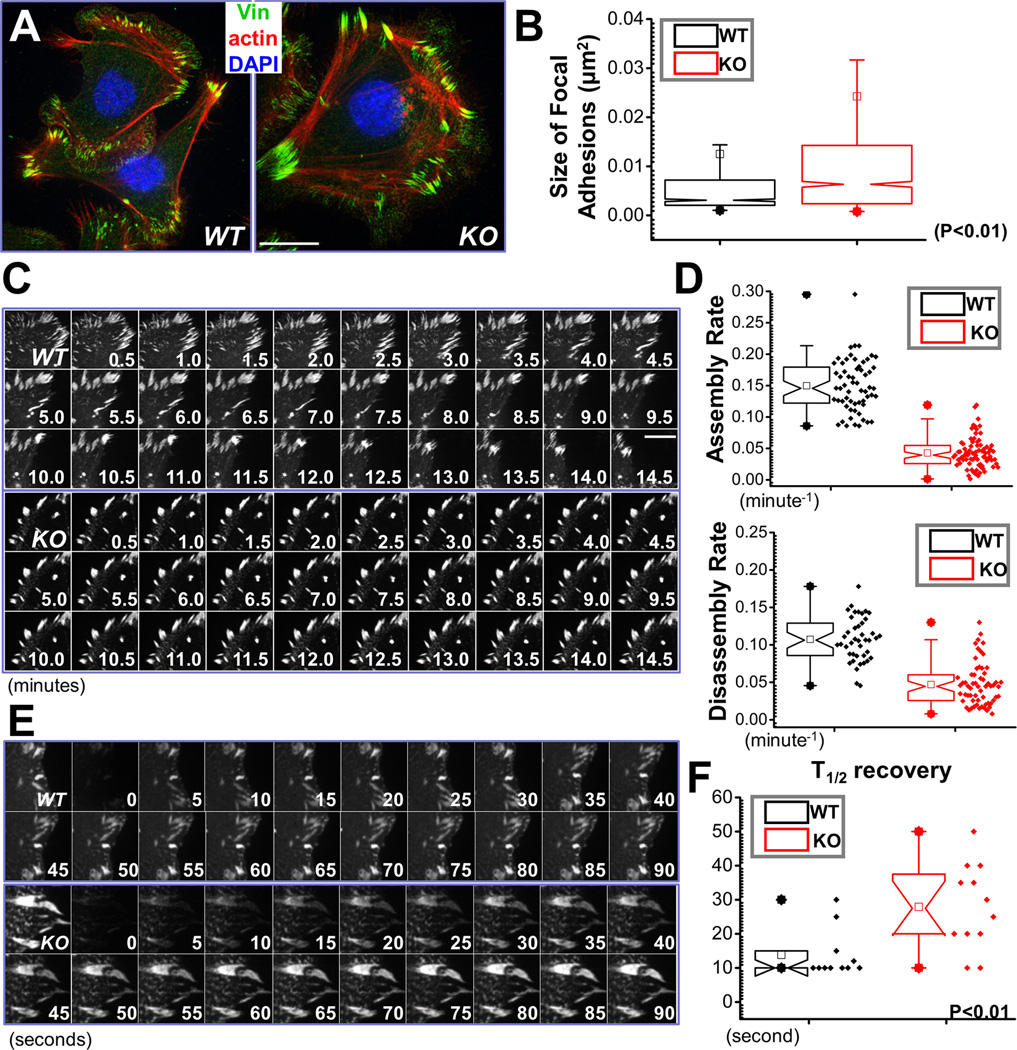
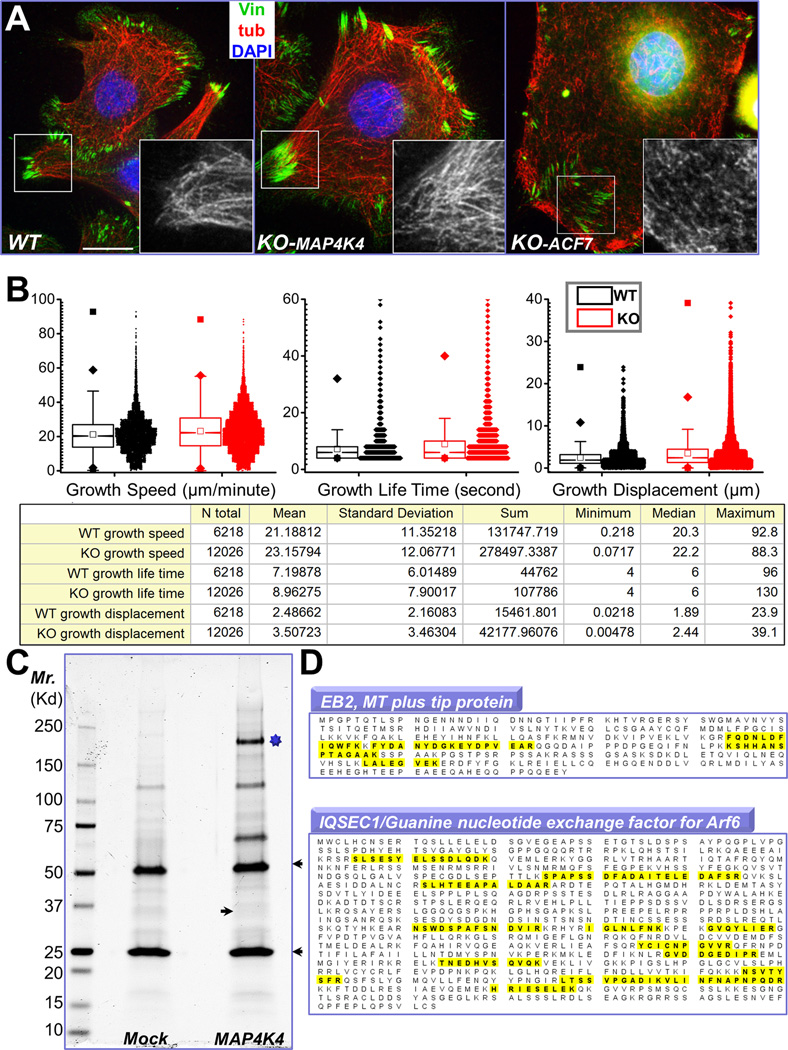
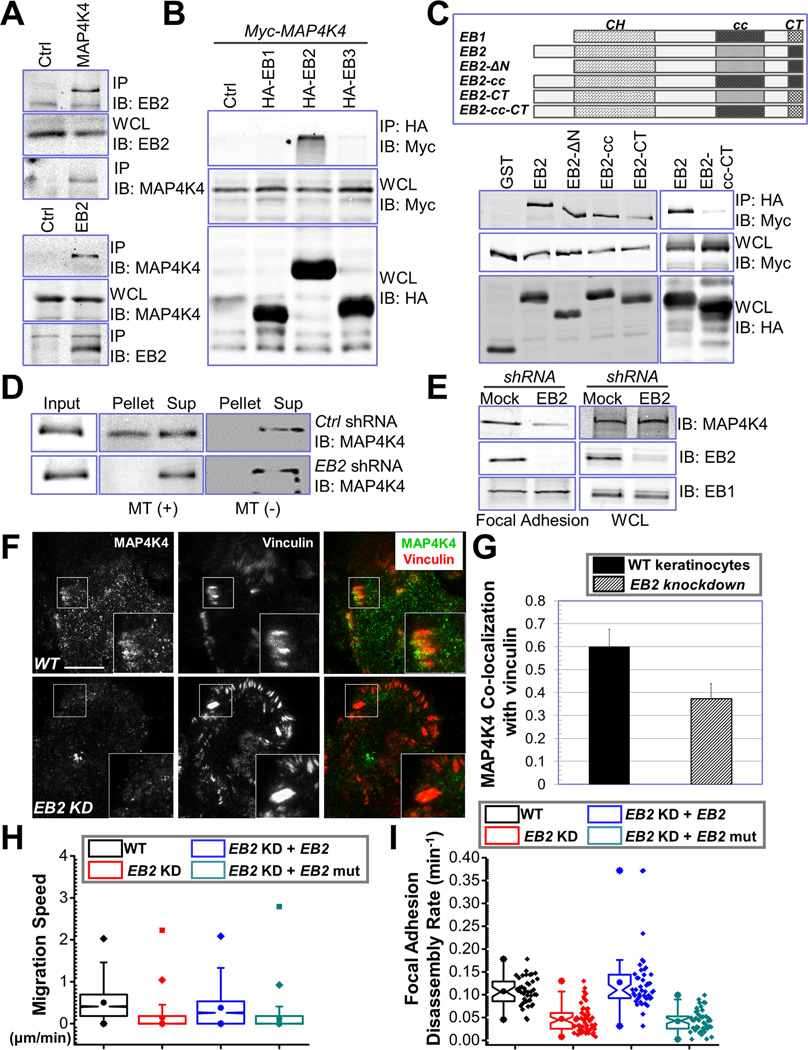
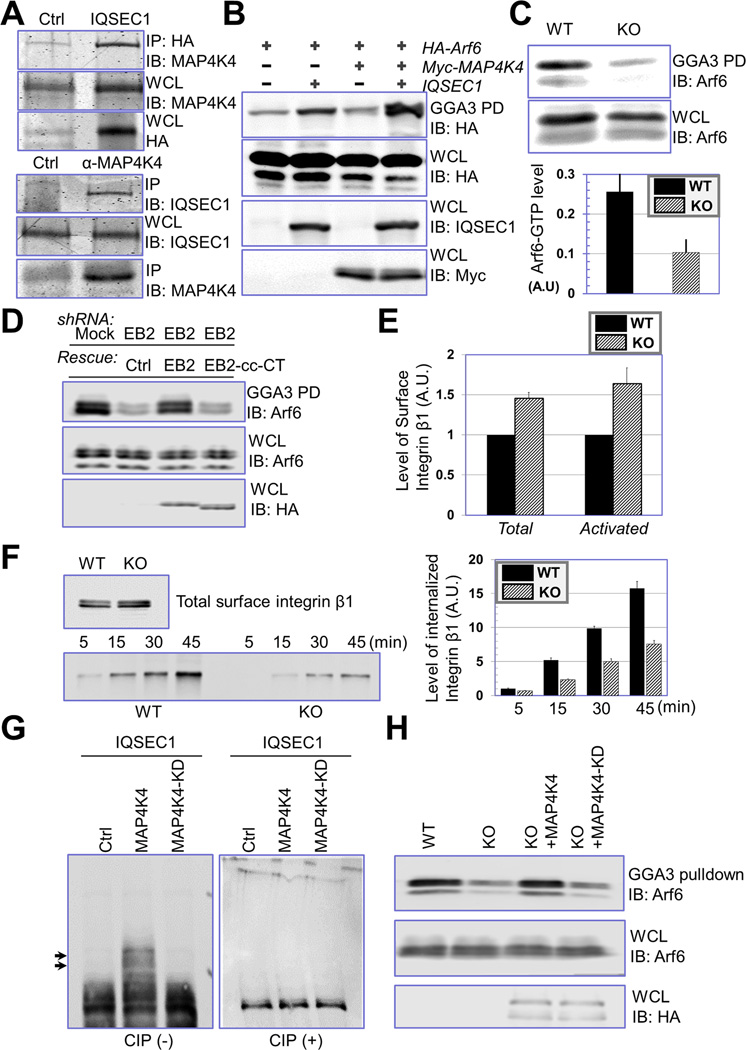
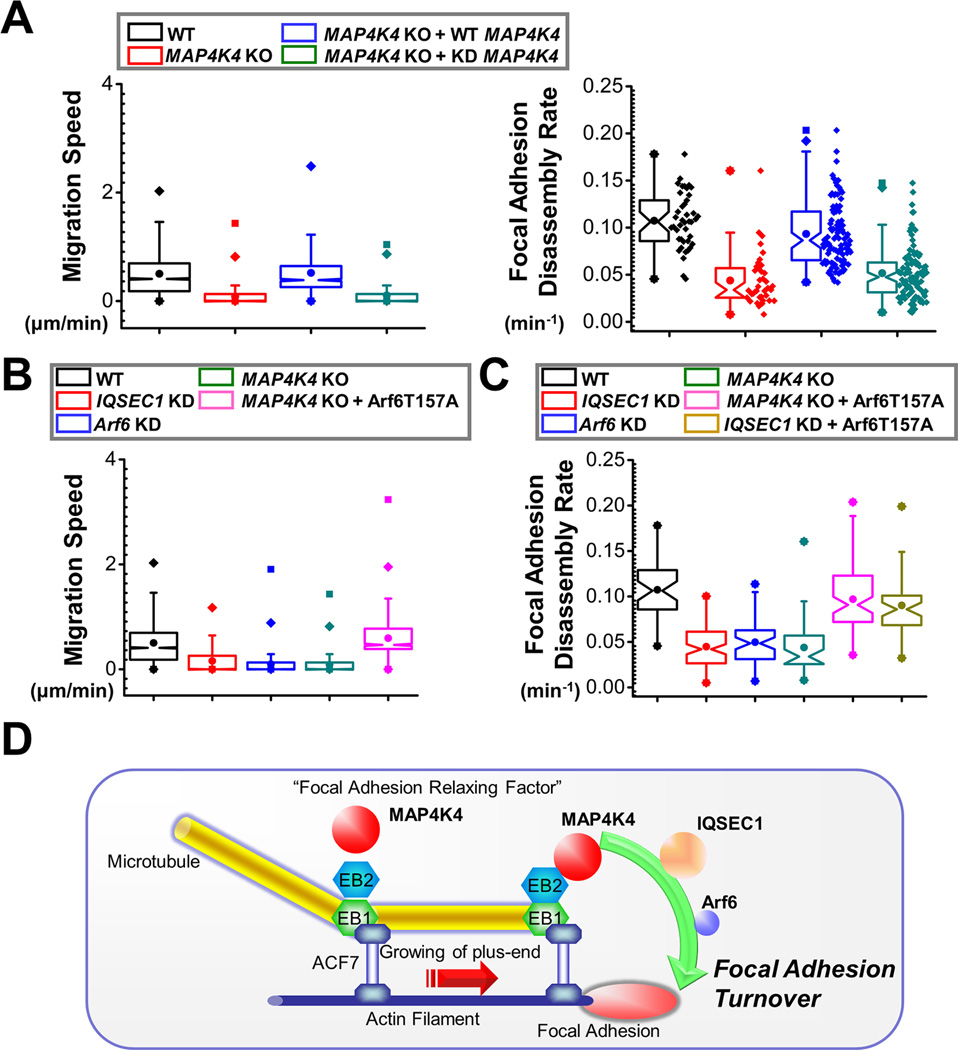
Disassembly of focal adhesions (FAs) allows cell retraction and integrin detachment from the extracellular matrix, processes critical for cell movement. Growth of microtubules (MTs) can promote FA turnover by serving as tracks to deliver proteins essential for FA disassembly. The molecular nature of this FA "disassembly factor," however, remains elusive. By quantitative proteomics, we identified mitogen-activated protein kinase kinase kinase kinase 4 (MAP4K4) as an FA regulator that associates with MTs. Knockout of MAP4K4 stabilizes FAs and impairs cell migration. By exploring underlying mechanisms, we further show that MAP4K4 associates with ending binding 2 (EB2) and IQ motif and SEC7 domain-containing protein 1 (IQSEC1), a guanine nucleotide exchange factor specific for Arf6, whose activation promotes integrin internalization. Together, our findings provide critical insight into FA disassembly, suggesting that MTs can deliver MAP4K4 toward FAs through EB2, where MAP4K4 can, in turn, activate Arf6 via IQSEC1 and enhance FA dissolution.


Figures

Figure 1
Figure 1. Identification of MAP4K4 as a MT-dependent FA protein
(A) Flow diagram of the protocol used to isolate FA proteins for SILAC analysis. HaCaT cells were stained with α-vinculin antibody to visualize FAs (top two panels). Scale bar = 20 µm. (B) Candidates that exhibit most significant changes in protein levels upon nocodazole treatment. Ratios of each candidate protein retrieved from heavy or light cells (H/L) were shown together with the ratio variability. MAPRE1 or 2: microtubule associated protein, RP/EB family member 1 or 2. The level change of vinculin is included as a control. (C) Interaction with MTs was examined by co-sedimentation assay. Presence of protein in the original lysate (input), pellet of centrifugation as well as supernatant was determined by immunoblot with different antibodies as indicated. (D) WT mouse primary keratinocytes treated with or without nocodazole and ACF7 KO keratinocytes were fixed and subjected to immunofluorescence staining with different antibodies as indicated. Stained cells were examined by TIRF microscopy. Scale bar = 20 µm. (E) Co-localization between MAP4K4 and FAs was determined by Pearson correlation coefficient. N=10, and P<0.01. (F) GFP or GFP-MAP4K4 cells were harvested and replated onto fibronectin-coated surface for 15 or 30 minutes. Cells were then fixed and stained. Adhesion and spreading of cells (cell area) were quantified with Image J and shown as Box and Whisker plots. Box and whisker plots indicates the mean (empty square within the box), 25th percentile (bottom line of the box), median (middle line of the box), 75th percentile (top line of the box), 5th and 95th percentile (whiskers), 1st and 99th percentile (solid diamonds) and minimum and maximum measurements (solid squares), with actual data points shown at right. N>50 for each group, and P<0.01 between GFP and MAP4K4 for each time point.
Figure 2
Figure 2. Cell migration defects in MAP4K4-deficient keratinocytes
(A) PCR genotyping of MAP4K4 cKO mouse DNAs (top panel; WT: wildtype, Flox: MAP4K4fl/fl; cKO: MAP4K4fl/fl: K14-Cre). Immunoblot analysis of P0 epidermal extracts (20 µg total protein) probed with different antibodies as indicated. (B) MAP4K4 cKO mice can grow to adulthood (left panel). Histological analysis (hematoxylin/eosin staining) confirms rather normal skin and hair follicles in cKO skin (right panel). Scale bar = 50 µm. (C) Dorsal skins of neonatal mice were immunostained with different antibodies as indicated (K5: keratin 5, K10: keratin 10, Lor: Loricrin, β4: β4-integrin, CD104). Scale bar=50 µm. (D) Wound healing as monitored by histological staining of skin sections at the wound edges 4 days after injury. Halves of wound sections are shown. Epi: epidermis; der: dermis; Es: eschar. Dotted lines denote dermal–epidermal boundaries. Scale bar = 50 µm. (E) Quantification of the length of hyperproliferative epidermis generated at times indicated after wounding. Number of biological replicates (N) =30 for each group. P<0.01 for each time point. (F) Quantification of Ki67-positive cells present in wound HE. Error bars represent standard deviations (SD). N=10, P=0.22. (H) Morphology of primary keratinocytes isolated from WT or MAP4K4 cKO skin. Scale bar = 50 µm. (G) Migration of confluent monolayers of mouse keratinocytes cultured from MAP4K4 cKO and WT littermates was assessed by in vitro scratch-wound assays. The kinetics of in vitro wound healing was quantified. N=3, P<0.01. (H) Movements of individual keratinocytes were traced by videomicroscopy. Migration tracks of multiple cells for each group (WT or KO) are shown here as scatter plots. N=30.
Figure 3
Figure 3. MAP4K4 regulates FA dynamics
(A) Immunolabeling of WT and MAP4K4 null cells for F-actin (red), nuclei (DAPI; blue), and FA marker vinculin (Vin; green). Scale bar = 20 µm. (B) Box and whisker plot indicating the size distribution of FAs in WT and KO cells. N>300, and P<0.01. (C) Representative time-lapse images (montages) of DsRed-Zyxin expressing keratinocytes. Note formation and dissolution of FAs in WT cells and very static FAs in KO cells. Scale bar = 10 µm. (D) Box and whisker plots revealing slow assembly and disassembly rates of FAs in MAP4K4 KO cells relative to their WT counterparts. N>50 for each group, and P<0.01. (E) Fluorescence recovery after photobleaching (FRAP) was used to visualize reduced dynamics of FAs in MAP4K4 KO vs WT cells. Representative time-lapse images (montage) of FAs are shown. Scale bar = 5 µm. (F) Box-and-whisker diagram quantifying the differences in half-time (T1/2) of FRAP between WT and KO cells. N>10, and P<0.01.
Figure 4
Figure 4. Identification of MAP4K4 binding partners by tandem affinity purification
(A) Immunofluorescence for MTs (red), FAs (vinculin, green), and nuclei (DAPI, blue) shows altered MT organization in ACF7 KO cells but not in MAP4K4 deficient cells. Boxed areas are magnified as insets, where only MT staining is shown. Note bundled MT filaments merge toward peripheral FAs in WT and MAP4K4 KO cells. Scale bar = 20 µm. (B) Box and whisker plots for EB1 plus end dynamics in WT and MAP4K4 KO cells. Descriptive statistics of all the results, including mean and standard deviation, were shown in the table below. (C) MAP4K4 and its associated proteins were isolated by tandem affinity purification and resolved by SDS-PAGE. IgG heavy chain and light chain are marked by arrowheads. The putative band for MAP4K4 is marked by star. Putative band for EB2 is marked by an arrow. (D) Both EB2 and IQSEC1 were found as MAP4K4 binding proteins. Identified peptides for each protein were highlighted (yellow).
Figure 5
Figure 5. EB2 recruits MAP4K4 to MTs and promotes FA dynamics
(A) Keratinocyte lysate was immunoprecipitated with α-EB2 or α-MAP4K4 antibodies. Immunoprecipitate (IP) as well as whole cell lysate (WCL, 10 µg total protein) was subjected to immunoblot with different antibodies as indicated. (B) HEK293T cells were transfected with different plasmids as indicated. Cell lysates were immunoprecipitated with α-HA antibody and immunoblotted with different antibodies as indicated. For WCL, 10 µg total proteins were used. Note only EB2 specifically pulls down MAP4K4. (C) Schematic representation of EB1, EB2, and various EB2 mutants used for coimmunoprecipitation assays (top panel). CH: calponin homology domain; cc: coiled-coil domain; CT: acidic C terminus. Association of EB2 or EB2 mutants with MAP4K4 was determined by coimmunoprecipitation as described above (lower panel). For WCL, 10 µg total proteins were used. (D) Control or EB2 knockdown cells were transfected with plasmid encoding MAP4K4. MT binding was examined by co-sedimentation assay. Pellet and supernatant as well as an aliquot of pre-cleared cell lysate (input) were immunoblotted to assess the level of MAP4K4. (E) Presence of MAP4K4, EB2, and EB1 in isolated FAs or whole cell lysate (WCL, 20 µg) from control or EB2-shRNA treated cells was determined by immunoblots. (F–G) WT keratinocytes and EB2 knockdown (KD) cells were subjected to immunofluorescence staining and examined by TIRF microscopy (F). Co-localization between MAP4K4 and vinculin was determined by Pearson correlation coefficient and quantified (G). Scale bar = 20 µm. N=10, P<0.01. (H–I) Quantifications of migration velocities and FA disassembly for control, EB2-knockdown (KD) cells, and cells rescued with WT EB2 or EB2 mutant (EB2-cc-CT). Note that only WT EB2 restored FA dynamics and rescued the speed of migration. For cell motility assay (I), N= 30 cells × 120 time points for each group. P<0.01 between WT and EB2 KD; EB2 KD and EB2 KD + EB2; and EB2 KD + EB2 and EB2 KD + EB2 mutant. For FA disassembly (J), N>40 for each group. P<0.01 between WT and EB2 KD; EB2 KD and EB2 KD + EB2; and EB2 KD + EB2 and EB2 KD + EB2 mutant.
Figure 6
Figure 6. MAP4K4 promotes IQSEC1 and Arf6 activity
(A) Interaction between IQSEC1 and MAP4K4 was confirmed by coimmunoprecipitation. Cells were transfected with plasmids encoding Myc-tagged MAP4K4 with or without HA-tagged IQSEC1. Cell lysate was immunoprecipitated with α- HA and blotted with different antibodies as indicated (top panel). To verify interaction of endogenous proteins, lysate of WT keratinocytes were immunoprecipitated with control or α-MAP4K4 IgG, and blot with α-IQSEC1 antibody (bottom panel). An aliquot of whole cell lysate (20 µg) were examined by immunoblot as well. (B) HEK293T cells were transfected with HA-tagged Arf6 together with MAP4K4 or IQSEC1 in different combinations as indicated. Level of GTP-bound Arf6 was determined by GGA3 pull down and immunoblot with α-HA antibody. An aliquot of WCL (10 µg) was immunoblotted with different antibodies as indicated to verify comparable expression level of different genes. (C) Level of endogenous Arf6-GTP was determined by GGA3 pull down coupled with α-Arf6 immunoblot (top panel). Quantification from densitometry analysis shows significant decrease of Arf6 activity upon loss of MAP4K4 (lower panel). For WCL, 20 µg total proteins were used. N=4, and P<0.05. (D) Level of Arf6-GTP was determined by GGA3 pull down coupled with α-Arf6 immunoblot in control cells, EB2 knockdown cells, and EB2 knockdown cells rescued with either WT EB2 or EB2 cc-CT mutant (HA tagged). For WCL, 20 µg total proteins were used. (E) Surface level of β1-integrin (pan β1-integrin or activated β1-integrin) was determined by flow cytometry. N=3, P<0.01 for both total integrin and activated integrin. (F) Internalization of β1-integrin in WT and MAP4K4 KO cells was determined by reversible biotinylation. Biotinylated proteins were isolated by streptavidin agarose and subjected to immunoblot with anti-β1-integrin antibody. Relative level of internalized integrin was determined by densitometry and quantified (right panel). N=3, and P<0.05 for each time point. (G) IQSEC1 was isolated from transfected cells by immunoprecipitation and phosphorylation of IQSEC1 was determined by electrophoresis with Phos-tag acrylamide. Note upper shifted bands (arrows) that represent hyperphosphorylated proteins are only present in cells co-transfected with IQSEC1 and WT MAP4K4. CIP: calf intestinal phosphatase. (H) Arf6-GTP level was determined by GGA3 pull down for WT, MAP4K4 KO cells, and KO cells rescued with WT MAP4K4 or MAP4K4 KD mutant (HA tagged). For WCL, 20 µg of total proteins were used.
Figure 7
Figure 7. MAP4K4 and IQSEC1 interaction regulates FA dynamics and cell motility
(A) Cell motility and FA dynamics were analysed for WT, MAP4K4 KO cells, and KO cells rescued with WT MAP4K4 or MAP4K4 KD mutant. For cell motility assay (left panel), N= 30 cells × 120 time points for each group. P<0.01 between WT and MAP4K4 KO, MAP4K4 KO and MAP4K4 KO + WT MAP4K4, and MAP4K4 KO + WT MAP4K4 and MAP4K4 KO + KD MAP4K4. For FA disassembly (right panel), N>40 for each group. P<0.01 between between WT and MAP4K4 KO, MAP4K4 KO and MAP4K4 KO + WT MAP4K4, and MAP4K4 KO + WT MAP4K4 and MAP4K4 KO + KD MAP4K4. (B, C) Quantifications of migration velocities (B) and FA disassembly rate (C) for control, IQSEC1-knockdown cells, Arf6-knockdown cells, MAP4K4 KO cells, and cells rescued with Arf6 T157A. For cell motility assay, N= 30 cells × 120 time points for each group. P<0.01 between WT and IQSEC1 KD; WT and Arf6 KD, WT and MAP4K4 KO, and MAP4K4 KO and MAP4K4 KO + Arf6 T157A. For FA disassembly, N>40 for each group. P<0.01 between between WT and IQSEC1 KD; WT and Arf6 KD, WT and MAP4K4 KO, MAP4K4 KO and MAP4K4 KO + Arf6 T157A, and IQSEC1 KD and IQSEC1 KD + Arf6 T157A. (D) A working model summarizing the role of MAP4K4 in FA turnover and cell migration. We posit that MT dynamics are coordinated by cytoskeletal crosslinkers, such as ACF7 that guides MT growth toward FAs. MT interacting protein EB2 can bind and deliver MAP4K4 to FAs, where MAP4K4 can subsequently activate IQSEC1 and Arf6, leading to FA turnover and efficient cell movement.

References

    1. Akhmanova A, Steinmetz MO. Tracking the ends: a dynamic protein network controls the fate of microtubule tips. Nature reviews Molecular cell biology. 2008;9:309–322. - PubMed
    1. Bershadsky A, Chausovsky A, Becker E, Lyubimova A, Geiger B. Involvement of microtubules in the control of adhesion-dependent signal transduction. Current biology : CB. 1996;6:1279–1289. - PubMed
    1. Blanpain C, Fuchs E. Epidermal stem cells of the skin. Annual review of cell and developmental biology. 2006;22:339–373. - PMC - PubMed
    1. Calderwood DA, Campbell ID, Critchley DR. Talins and kindlins: partners in integrin-mediated adhesion. Nature reviews Molecular cell biology. 2013;14:503–517. - PMC - PubMed
    1. Chapman JO, Li H, Lundquist EA. The MIG-15 NIK kinase acts cell-autonomously in neuroblast polarization and migration in C. elegans. Developmental biology. 2008;324:245–257. - PMC - PubMed

Publication types