. 2014 Dec 9;11(12):e1001765.
doi: 10.1371/journal.pmed.1001765. eCollection 2014 Dec.

Metabolic signatures of adiposity in young adults: Mendelian randomization analysis and effects of weight change

Affiliations

Metabolic signatures of adiposity in young adults: Mendelian randomization analysis and effects of weight change

Peter Würtz et al. PLoS Med. .

Abstract

Background: Increased adiposity is linked with higher risk for cardiometabolic diseases. We aimed to determine to what extent elevated body mass index (BMI) within the normal weight range has causal effects on the detailed systemic metabolite profile in early adulthood.

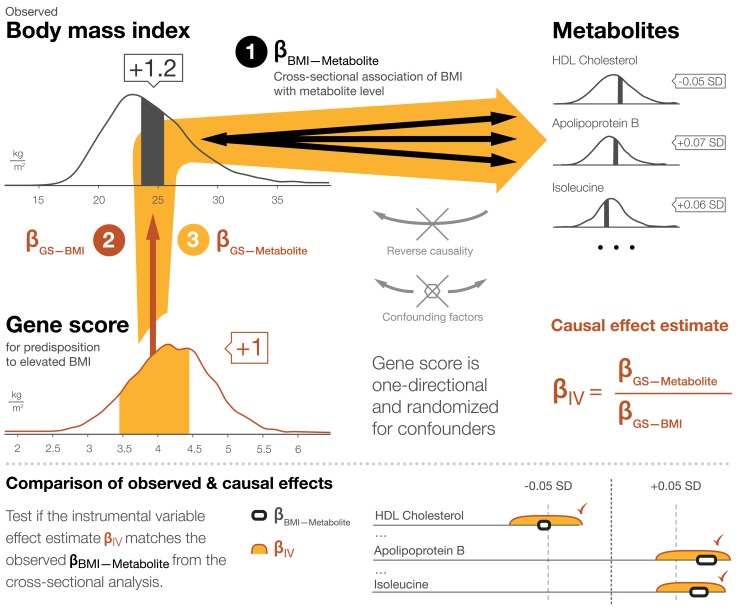
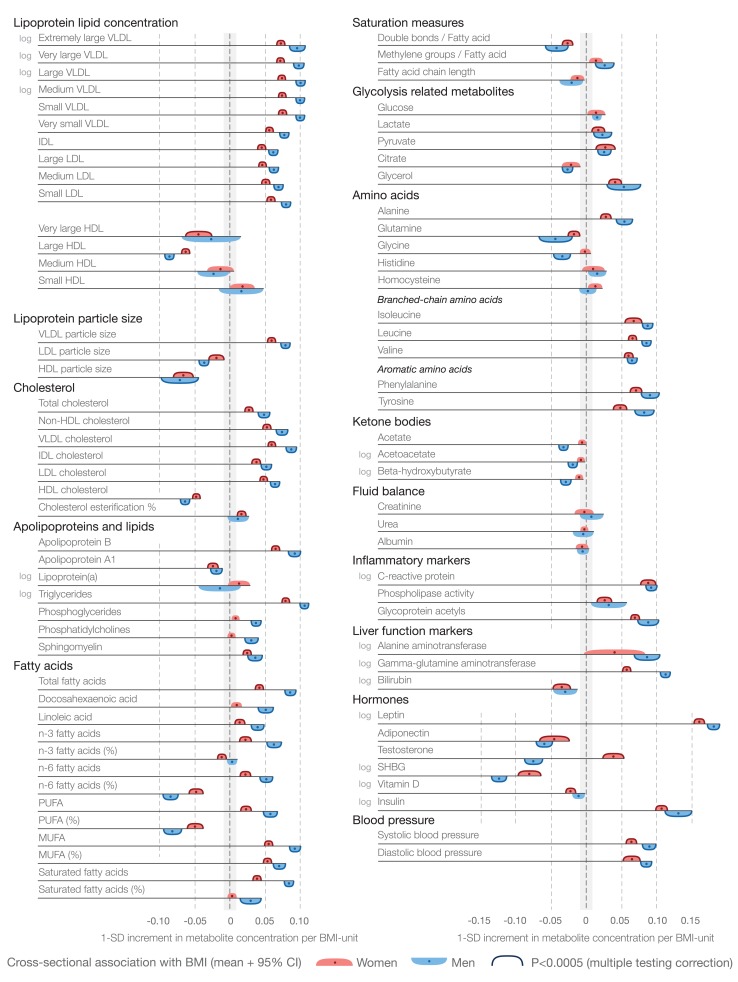
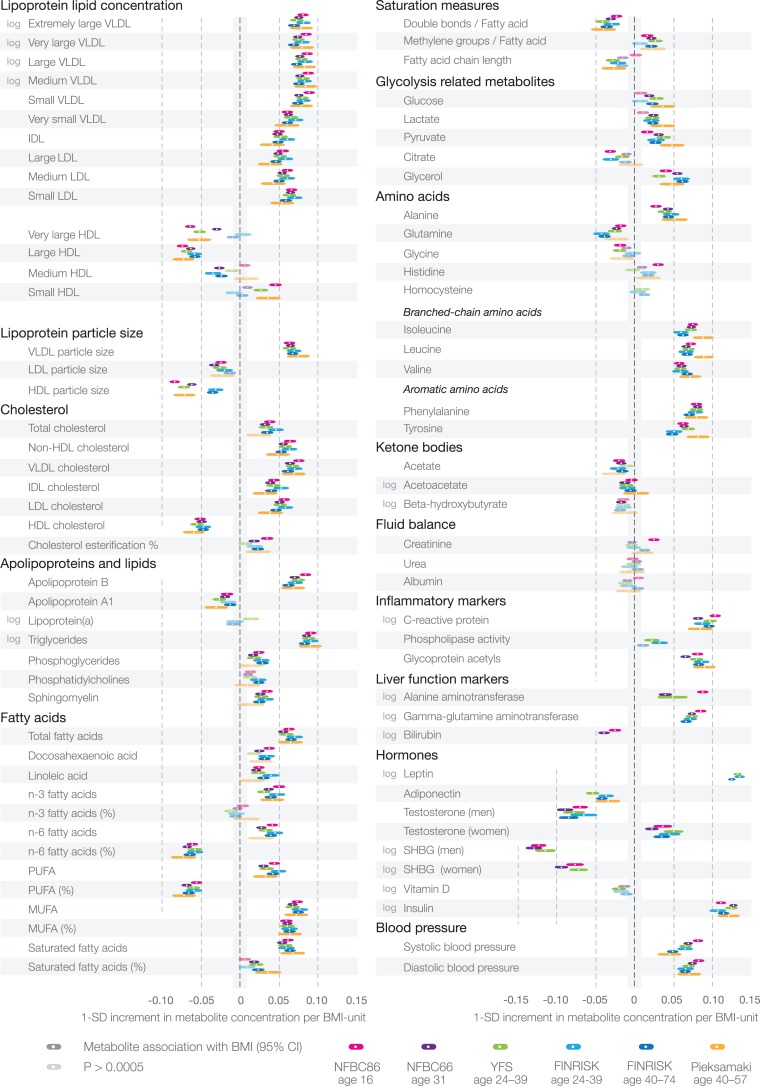
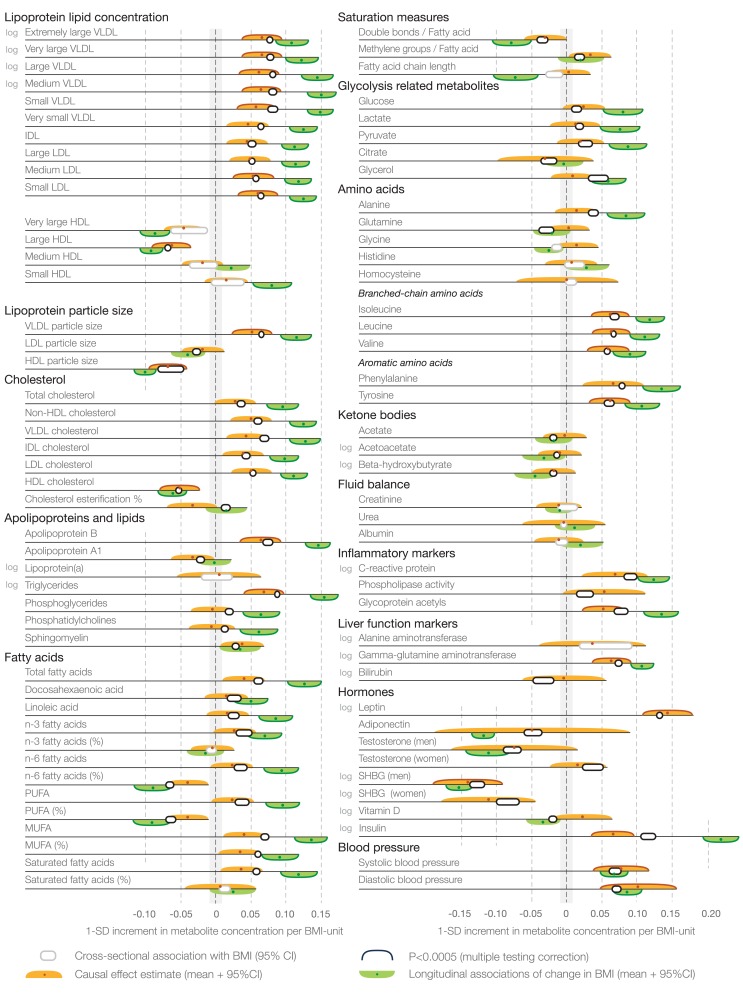
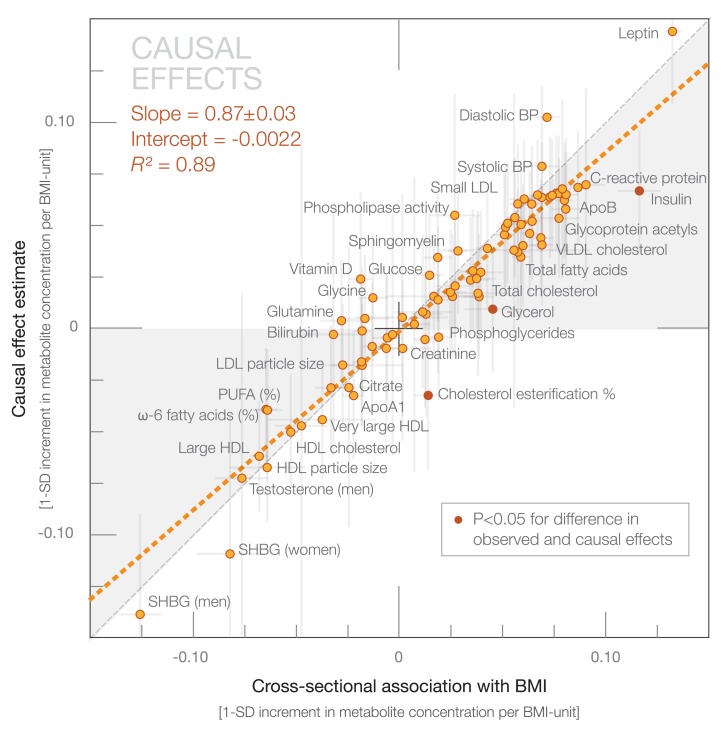
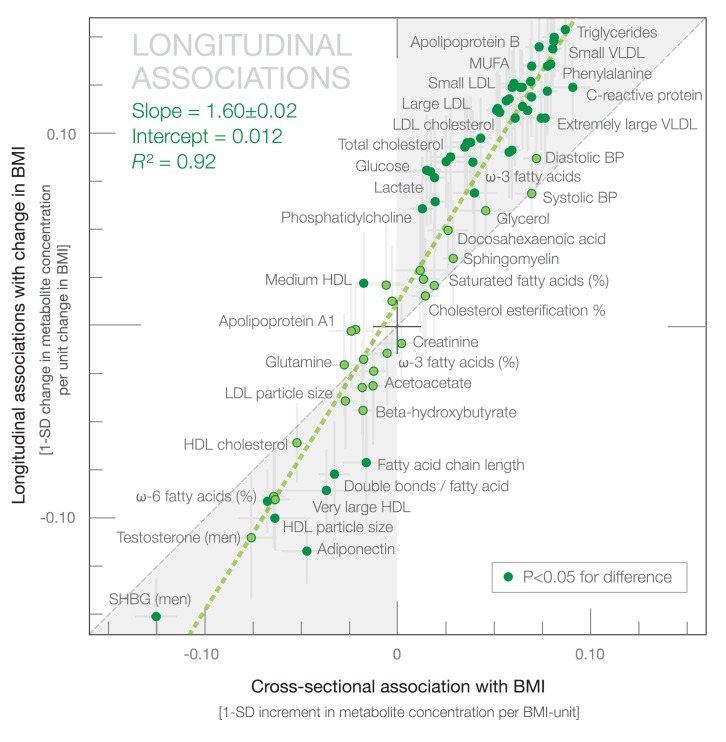
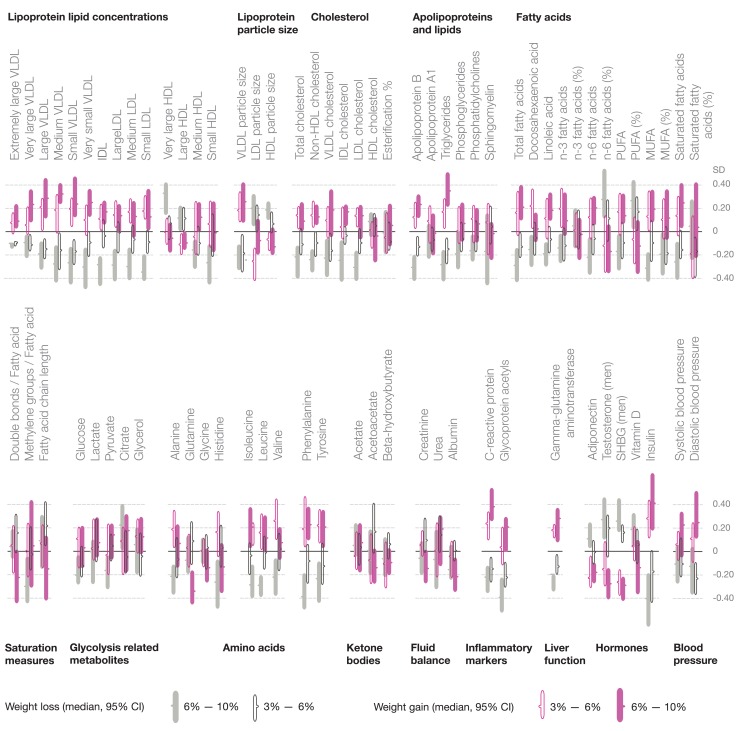
Methods and findings: We used Mendelian randomization to estimate causal effects of BMI on 82 metabolic measures in 12,664 adolescents and young adults from four population-based cohorts in Finland (mean age 26 y, range 16-39 y; 51% women; mean ± standard deviation BMI 24 ± 4 kg/m(2)). Circulating metabolites were quantified by high-throughput nuclear magnetic resonance metabolomics and biochemical assays. In cross-sectional analyses, elevated BMI was adversely associated with cardiometabolic risk markers throughout the systemic metabolite profile, including lipoprotein subclasses, fatty acid composition, amino acids, inflammatory markers, and various hormones (p<0.0005 for 68 measures). Metabolite associations with BMI were generally stronger for men than for women (median 136%, interquartile range 125%-183%). A gene score for predisposition to elevated BMI, composed of 32 established genetic correlates, was used as the instrument to assess causality. Causal effects of elevated BMI closely matched observational estimates (correspondence 87% ± 3%; R(2)= 0.89), suggesting causative influences of adiposity on the levels of numerous metabolites (p<0.0005 for 24 measures), including lipoprotein lipid subclasses and particle size, branched-chain and aromatic amino acids, and inflammation-related glycoprotein acetyls. Causal analyses of certain metabolites and potential sex differences warrant stronger statistical power. Metabolite changes associated with change in BMI during 6 y of follow-up were examined for 1,488 individuals. Change in BMI was accompanied by widespread metabolite changes, which had an association pattern similar to that of the cross-sectional observations, yet with greater metabolic effects (correspondence 160% ± 2%; R(2) = 0.92).

Conclusions: Mendelian randomization indicates causal adverse effects of increased adiposity with multiple cardiometabolic risk markers across the metabolite profile in adolescents and young adults within the non-obese weight range. Consistent with the causal influences of adiposity, weight changes were paralleled by extensive metabolic changes, suggesting a broadly modifiable systemic metabolite profile in early adulthood. Please see later in the article for the Editors' Summary.


Conflict of interest statement

PW, AJK, PS, and MAK are shareholders of Brainshake Ltd, a startup company offering NMR-based metabolite profiling. SB has received research funding from Abbott, Abbott Diagnostics, Bayer, Boehringer Ingelheim, SIEMENS, and Thermo Fisher. SB has received honoraria for lectures from Abbott, Abbott Diagnostics, Astra Zeneca, Bayer, Boehringer Ingelheim, Medtronic, Pfizer, Roche, SIEMENS Diagnostics, SIEMENS, Thermo Fisher, and as member of Advisory Boards and for consulting for Boehringer Ingelheim, Bayer, Novartis, Roche, and Thermo Fisher. GDS is a member of the Editorial Board of PLOS Medicine. All other authors declare that no competing interests exist.

Figures

Figure 1
Figure 1. Mendelian randomization framework for estimating causal effects of BMI on the systemic metabolite profile.
The principles of Mendelian randomization and core assumptions for the genetic instrument to be valid are detailed in Box 1.
Figure 2
Figure 2. Cross-sectional associations of BMI with systemic metabolites for 6,468 women (red) and 6,196 men (blue).
Association magnitudes are indicated in units of 1-SD metabolite concentration per 1-kg/m2 increment in BMI. Associations were adjusted for age and meta-analyzed for the four cohorts of adolescents and young adults. Colored dots indicate β-regression coefficients, colored shading denotes 95% confidence intervals, and boundaries on the shading indicate p<0.0005. The continuous shape of the associations and magnitudes in absolute concentration units are illustrated in Figure S2. MUFA, monounsaturated fatty acid; PUFA, polyunsaturated fatty acid; SHBG, sex hormone–binding globulin.
Figure 3
Figure 3. Cross-sectional associations of BMI with systemic metabolites across four cohorts of adolescents and young adults, and consistency in two populations of older individuals.
Association magnitudes are in units of 1-SD metabolite concentration per 1-kg/m2 increment in BMI. Color coding indicates the respective cohorts. White dots indicate β-regression coefficients, colored shading indicates 95% confidence intervals, and darker shading denotes p<0.0005. The associations were analyzed for men and women combined and adjusted for sex and age, as well as smoking status, alcohol intake, and physical activity index. MUFA, monounsaturated fatty acid; PUFA, polyunsaturated fatty acid; SHBG, sex hormone–binding globulin.
Figure 4
Figure 4. Cross-sectional associations, causal effect estimates, and longitudinal associations of BMI with systemic metabolites.
Association magnitudes are in units of 1-SD metabolite concentration per 1-kg/m2 increment in BMI (cross-sectional associations [white] and causal effect estimates [orange]; n = 12,664), and change in metabolite concentration per 1-kg/m2 change in BMI at 6-y follow-up (longitudinal associations [green]; n = 1,488). Associations were adjusted for age and sex, and meta-analyzed for the four cohorts of adolescents and young adults. Colored dots indicate β-regression coefficients, colored shading denotes 95% confidence intervals, and boundaries on the shading indicate p<0.0005. All association magnitudes in absolute concentration units and exact p-values are listed in Table S3. MUFA, monounsaturated fatty acid; PUFA, polyunsaturated fatty acid; SHBG, sex hormone–binding globulin.
Figure 5
Figure 5. Correspondence between causal effect estimates and cross-sectional associations of BMI with systemic metabolites.
Causal effect estimates based on Mendelian randomization are plotted against the metabolite associations with observed BMI based a cross-sectional study design. The orange dashed line denotes the linear fit of the correspondence. Darker dots indicate statistical differences between causal effect estimates and cross-sectional association magnitudes. The gray shaded areas serve to guide the eye for the slope of correspondence. BP, blood pressure; PUFA, polyunsaturated fatty acid; SHBG, sex hormone–binding globulin.
Figure 6
Figure 6. Correspondence between longitudinal associations of 6-y change in BMI with change in metabolites and cross-sectional associations.
The green dashed line denotes the linear fit between longitudinal and cross-sectional observations. Darker dots indicate statistical differences between longitudinal and cross-sectional association magnitudes. The gray shaded areas serve to guide the eye for the slope of correspondence. BP, blood pressure; MUFA, monounsaturated fatty acid; SHBG, sex hormone–binding globulin.
Figure 7
Figure 7. Metabolite changes paralleled by weight loss and weight gain.
Median changes in metabolite concentrations at 6-y follow-up in four categories of weight change: filled gray bars, 6%–10% weight loss (mean [SD] loss 5.5±1.1 kg, n = 169); open black bars, 3%–6% weight loss (3.2±0.9 kg, n = 205); open purple bars, 3%–6% weight gain (3.2±0.9 kg, n = 168); filled purple bars, 6%–10% weight gain (5.9±1.7 kg, n = 138). The length of the bars indicates 95% confidence intervals of the median. The changes in metabolite concentrations are indicated in units of 1-SD baseline metabolite levels; metabobolite changes in absolute concentration units are listed in Table S5. MUFA, monounsaturated fatty acid; PUFA, polyunsaturated fatty acid; SHBG, sex hormone–binding globulin.

References

    1. Ng M, Fleming T, Robinson M, Thomson B, Graetz N, et al. (2014) Global, regional, and national prevalence of overweight and obesity in children and adults during 1980–2013: a systematic analysis for the Global Burden of Disease Study 2013. Lancet 384: 766–781. - PMC - PubMed
    1. Prospective Studies Collaboration (2009) Whitlock G, Lewington S, Sherliker P, Clarke R, et al. (2009) Body-mass index and cause-specific mortality in 900 000 adults: collaborative analyses of 57 prospective studies. Lancet 373: 1083–1096. - PMC - PubMed
    1. Global Burden of Metabolic Risk Factors for Chronic Diseases Collaboration (BMI Mediated Effects) (2014) Lu Y, Hajifathalian K, Ezzati M, Woodward M, et al. (2014) Metabolic mediators of the effects of body-mass index, overweight, and obesity on coronary heart disease and stroke: a pooled analysis of 97 prospective cohorts with 1.8 million participants. Lancet 383: 970–983. - PMC - PubMed
    1. Lewis CE, McTigue KM, Burke LE, Poirier P, Eckel RH, et al. (2009) Mortality, health outcomes, and body mass index in the overweight range. Circulation 119: 3263–3271. - PubMed
    1. Jensen MD, Ryan DH, Apovian CM, Ard JD, Comuzzie AG, et al. (2014) 2013 AHA/ACC/TOS guideline for the management of overweight and obesity in adults: a report of the American College of Cardiology/American Heart Association Task Force on Practice Guidelines and the Obesity Society. Circulation 129 25 Suppl 2: S102–S138. - PMC - PubMed

Publication types