. 2014 Dec 8;26(6):813-825.
doi: 10.1016/j.ccell.2014.10.012.

Locally disordered methylation forms the basis of intratumor methylome variation in chronic lymphocytic leukemia

Affiliations

Locally disordered methylation forms the basis of intratumor methylome variation in chronic lymphocytic leukemia

Dan A Landau et al. Cancer Cell. .

Abstract

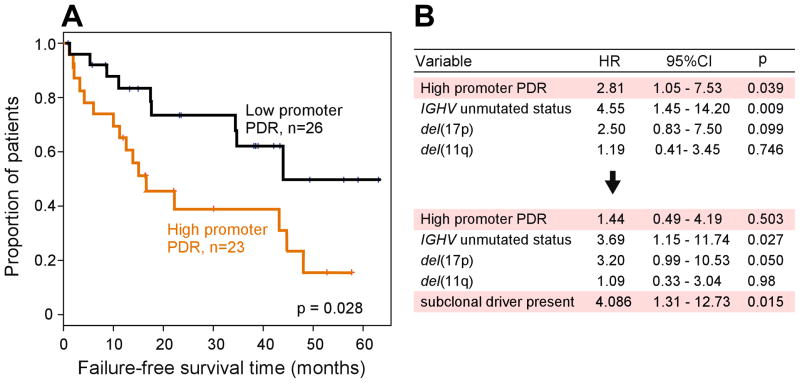
Intratumoral heterogeneity plays a critical role in tumor evolution. To define the contribution of DNA methylation to heterogeneity within tumors, we performed genome-scale bisulfite sequencing of 104 primary chronic lymphocytic leukemias (CLLs). Compared with 26 normal B cell samples, CLLs consistently displayed higher intrasample variability of DNA methylation patterns across the genome, which appears to arise from stochastically disordered methylation in malignant cells. Transcriptome analysis of bulk and single CLL cells revealed that methylation disorder was linked to low-level expression. Disordered methylation was further associated with adverse clinical outcome. We therefore propose that disordered methylation plays a similar role to that of genetic instability, enhancing the ability of cancer cells to search for superior evolutionary trajectories.


Figures

Figure 1
Figure 1. Higher DNA methylation intra-sample heterogeneity in CLL arises from locally disordered methylation
A. CLL Global and CGI methylation compared with normal B cells, measured with WGBS (top). Cumulative distribution analysis (bottom) enables the comparison of the proportion of intermediate methylation values in WGBS data of CLL and B cells from healthy adult volunteers (also see Figure S1). B. Mean intra-sample CpG variance measured with RRBS. C. Methylation patterns from RRBS data of a CLL sample (CLL007), show two patterns of methylation (black circles--methylated CpGs; white circles--unmethylated): (1) A pattern compatible with a mixture of cell populations with clear but distinct methylation states for a particular non-imprinted locus (left-SDHAP3 promoter [chr5:1594239-1594268]), and (2) a pattern compatible with an admixture of cells with locally disordered methylation (right-PIK3R5 promoter [chr17:8869616-8869640]). D. A comparison between the intra-sample CpG variance that arises from discordant compared with concordant reads across the 104 CLLs. E. CpG methylation and the proportion of discordant reads (PDR) were calculated as shown. F. Sample average PDR for CLL, cancer cell lines, normal B cells and a collection of primary healthy human tissues. To enable an accurate comparison between samples, sample average PDR is calculated based on a consensus set of 63,443 CpGs that are covered with greater than 10 reads in >75% of all 202 RRBS samples. See also Figure S1, Tables S1–2.
Figure 2
Figure 2. Locally disordered methylation affects all genomic regions in CLL, including CpG islands (CGIs) and repeat regions
Comparison of mean PDR (A) and mean CpG methylation (B) per genomic region between CLLs and normal B cells using RRBS data (Table S3 provides the average number of CpGs analyzed for each genomic region). Error bars represent upper 95% CI of the mean. C. Top-The distribution of PDR and methylation across all promoters covered by RRBS for randomly selected 6 CLL and 6 normal B cell samples. The distribution was derived by dividing each promoter into 100 bins, and then averaging methylation and PDR for CpGs falling into each bin across all promoters in the sample. The PDR and methylation values in the adjacent 2KB upstream and downstream are also shown. Bottom-An analogous analysis of CGIs and adjacent shore regions. See also Figure S2, Table S3.
Figure 3
Figure 3. Locally disordered methylation in CLL is consistent with a stochastic process
A. We developed a model to determine the probability of observing any PDR value in a random CpG methylation state model [given: (1) the total number of reads that cover the locus, (2) the number of neighboring CpGs contained in individual reads, and (3) the locus methylation level]. The plot demonstrates the case in which a locus is covered at a read depth of 30 and each read contains 4 neighboring CpGs. The expected PDR value is shown by the dashed line, and the shaded region represents methylation-PDR tuples with a probability greater than 0.01 under the random model. B. The CLL methylation data are consistent with the stochastic pattern shown in (A). Average promoter CGI methylation and PDR were calculated for 13,943 CGIs covered by WGBS (>10 CpGs per island) in both the CLL and the normal B cell samples. Outliers represent 1.4% of events (see Figure S3D and Table S4). C. Average LINE element methylation and PDR were calculated for 1,894 elements covered by WGBS (>20 CpGs per element) in the same samples as in (B). D. The correlation in CLL between sample average of CGI methylation and PDR is shown (8,740.2 (± 3,102.8) promoter CGIs per sample were evaluated, see also Figure S3E). E. Similarly, the correlation in CLL between sample average LINE element methylation and PDR are also shown. The RRBS based results of CLL169 are highlighted with a purple square. F. To study the correlation between difference in PDR (ΔPDR) and difference in methylation (ΔMeth), we paired representative CLL and normal B cell samples. For each promoter (>20CpGs per promoter, n=2119), ΔMeth and ΔPDR were plotted (red). An identical procedure was performed with a pairing of the same normal B cell sample to an adult lung sample (Lung_normal_BioSam_235, blue). These data enable the comparison between the Pearson’s coefficient for the correlation between ΔPDR and ΔMeth in cancer related changes vs. normal physiological state changes. G. To confirm this finding across the entire dataset, random pairings were performed in each category listed on the X-axis, avoiding repeated use of any individual sample within a category. This procedure was repeated 100 times, and the means of the correlation coefficients for each iteration are plotted and compared. See also Figure S3, Table S4.
Figure 4
Figure 4. Locally disordered methylation affects preferentially gene-poor regions and can be traced back to non-expressed genes in normal B cells
A. Promoter PDR (orange, error bars represent 95% CI of means) in relation to gene density (genes/MB, left) and CTCF binding site density (right) regions. As reference, the CpG content is also provided (black). B. PDR and methylation in hypomethylated blocks (Hansen et al., 2011) is plotted for CLL and normal B cells (shown are blocks with > 1,000 CpGs in WGBS, see also Figure S4A for comparison with a matched set of control genomic blocks). C. Replication time and PDR are correlated; PDR was averaged for each promoter covered in > 70% of 104 CLLs, and these values were grouped in replication time bins. D. To assess the relationship between somatic mutations and PDR, sSNVs were identified with whole genome sequencing of matched tumor and germline DNA (CLL169). Average PDR (left) and methylation (right) were measured in 1,000bp increments from each somatic mutation. Values of CpGs in each 1,000bp bin were averaged over 4,973 sSNVs, and plotted as a function of the distance from the somatic mutation. Orange lines -- the LOWESS (locally weighted scatterplot smoothing). See Figure S4B–C for an analysis performed separately for clonal and subclonal mutations. E. Left - promoter CGI PDR is correlated between CLL and normal B cells samples (Pearson, evaluated with 5,811 consistently covered CGIs). Right- Promoter CGI PDR in B cells and CLLs is shown for genes expressed and non-expressed in normal B cells (FPKM<1, n= 1,002 from RNAseq data of 7 healthy donor B cell samples). See also Figure S4.
Figure 5
Figure 5. Locally disordered methylation is associated with transcriptional variation
A. Mean promoter PDR and gene expression are correlated (evaluated with 8,570 genes that had promoter RRBS coverage in > 70% of 33 samples with matched RRBS and RNAseq, the number of genes evaluated within each expression range provided in Figure S5A, and mean expression and methylation correlation is provided in Figure S5B. B. PDR and expression variability as measured with coefficient of variation (CV) of 5,874 transcribed genes (FPKM>1). Black circles (brackets)-- mean CV (95% CI) for genes within PDR bins (number of genes per bin in blue). Red line - cubic smoothing spline of CV and PDR values (unbinned). Note that the analysis was limited to transcribed genes to avoid an artificial enhancement of CV that occurs with very low mean expression values. As > 97.5% of transcribed genes had PDR<0.3, we limited the X axis to PDR < 0.3. C. Left - Odds ratio (bars - 95% CI) for gene expression (FPKM>1) with a methylated promoter (average methylation >0.8) versus unmethylated promoter (average methylation <0.2) is calculated for genes with high (orange, 27.5 ± 2.6% of genes) or low promoter PDR (black). Right - Linear models that combine information from all 33 CLLs as continuous variables to predict expression. D. PDR and intra-sample gene expression heterogeneity (assessed by Shannon’s information entropy) across the range of population average expression (FPM - fragments per million), by single cell RNA sequencing of 84 cells from CLL005 (see Figure S5D for analysis of 3 additional CLL samples). Local regression lines for genes with low PDR (0–0.05, blue), intermediate PDR (0.05 – 0.2, purple) and high PDR (0.2–1.0, red) are shown. E. Results of generalized additive regression tests that model single cell gene expression Shannon’s information entropy based on PDR, population average expression, and transcript length across the 4 CLL samples. F. Single cell gene expression patterns for genes within a narrow population average expression range of 1.0–1.2 (black rectangle in panel D). Consistent with the higher gene expression Shannon’s information entropy observed in genes with higher PDR (top), genes with low PDR (bottom left) tend to be expressed at high magnitude (larger dot size) in fewer cells, while genes with high PDR (bottom right) are frequently expressed at low expression magnitudes across many cells. See also Figure S5, Tables S5–6.
Figure 6
Figure 6. Locally disordered methylation may interact with evolution through drift towards a stem-like state
A. Gene set enrichment analysis comparing 1,668 genes with consistently high promoter PDR (>0.1 in >75% of samples) to 5,392 genes with consistently low promoter PDR (<0.1 in >75% of samples, selected 10 gene sets displayed; see Table S7 for the top 30 enrichments). Enrichment in genes with consistently high PDR was calculated for hypergeometric distribution followed by BH-FDR (‘Q(high)’). In addition, enrichment in high PDR genes vs. low PDR genes was calculated using Fisher’s exact test followed by BH-FDR (‘Q(high vs low)’). B. PDR and methylation in regions hypomethylated in embryonic stem cells (Ziller et al., 2013), in CLL compared with normal B cells (WGBS data). Regions include 91 enhancers (e.g., POU5F1, NANOG), 41 enhancer CGIs (e.g., TET2, EP400), 6 CGIs (e.g., DAPK1), 6 promoters and 84 other putative regulatory elements (e.g., DEC1 and POT1) (Ziller et al., 2013). The inset shows individual changes of selected regions. C. PDR in CLLs with high vs. low number of subclonal (median = 7.5 sSNVs) and clonal mutations (median = 10 sSNVs). D. Fourteen CLLs were sampled longitudinally at two time points (T1, T2; median interval time - 3.5 years), and change in PDR over time was compared between CLLs that underwent genetic clonal evolution (n=9) and those without genetic evolution (n=5, paired t test). E. Gene set enrichment of the 899 genes from the 14 cases with significant promoter methylation change between timepoints T1 and T2 (absolute change >10%, FDR BH Q<0.1) in genes with promoter demethylation over time (456 genes), and in genes with promoter methylation over time (443 genes) see Table S9 for top 30 enrichments). See also Figure S6, Tables S7–9.
Figure 7
Figure 7. Locally disordered methylation is associated with adverse clinical outcome
A. Kaplan-Meier plot showing failure free survival time (failure defined as retreatment or death from the time of first therapy after RRBS analysis) in CLLs with higher versus lower than average promoter PDR. Note that the analysis could only be performed for the 49 patients who received therapy after RRBS sampling. B. Multivariable analysis for this association with the addition of well-established poor outcome predictors in CLL (IGHV unmutated status, del(17p) and del(11q)), as well as with the addition of the presence of a subclonal driver (including somatic copy number changes, sSNVs and indels), as previously described (Landau et al., 2013)) to the model. See also Table S10.
Figure 8
Figure 8. Proposed interaction between methylation disorder and clonal evolution
A novel somatic mutation (depicted with lightning bolts) would have to coincide with an epigenetic state that will be permissive to the propagation of the new genotype to a progeny population. In a cellular population with limited stochastic methylation changes (top panel), the proportion of cells that are therefore able to actively participate in the evolutionary process is small. However, in a more malleable epigenetic landscape, such as expected to result from high level of locally disordered methylation, a greater proportion of cells can give birth to new subclones, increasing the diversity and the adaptive capacity of the cancer population, resulting in adverse clinical outcome with therapy.

Comment in

References

    1. Acevedo LG, Bieda M, Green R, Farnham PJ. Analysis of the mechanisms mediating tumor-specific changes in gene expression in human liver tumors. Cancer Res. 2008;68:2641–2651. - PMC - PubMed
    1. Akiyama Y, Watkins N, Suzuki H, Jair KW, van Engeland M, Esteller M, Sakai H, Ren CY, Yuasa Y, Herman JG, et al. GATA-4 and GATA-5 transcription factor genes and potential downstream antitumor target genes are epigenetically silenced in colorectal and gastric cancer. Mol Cell Biol. 2003;23:8429–8439. - PMC - PubMed
    1. Balazsi G, van Oudenaarden A, Collins JJ. Cellular decision making and biological noise: from microbes to mammals. Cell. 2011;144:910–925. - PMC - PubMed
    1. Baylin SB. DNA methylation and gene silencing in cancer. Nat Clin Pract Oncol. 2005;2(Suppl 1):S4–11. - PubMed
    1. Baylin SB, Jones PA. A decade of exploring the cancer epigenome - biological and translational implications. Nat Rev Cancer. 2011;11:726–734. - PMC - PubMed

Publication types