. 2014 Dec 8;26(6):909-922.
doi: 10.1016/j.ccell.2014.10.019.

Targeting transcriptional addictions in small cell lung cancer with a covalent CDK7 inhibitor

Affiliations

Targeting transcriptional addictions in small cell lung cancer with a covalent CDK7 inhibitor

Camilla L Christensen et al. Cancer Cell. .

Erratum in

  • Cancer Cell. 2015 Jan 12;27(1):149

Abstract

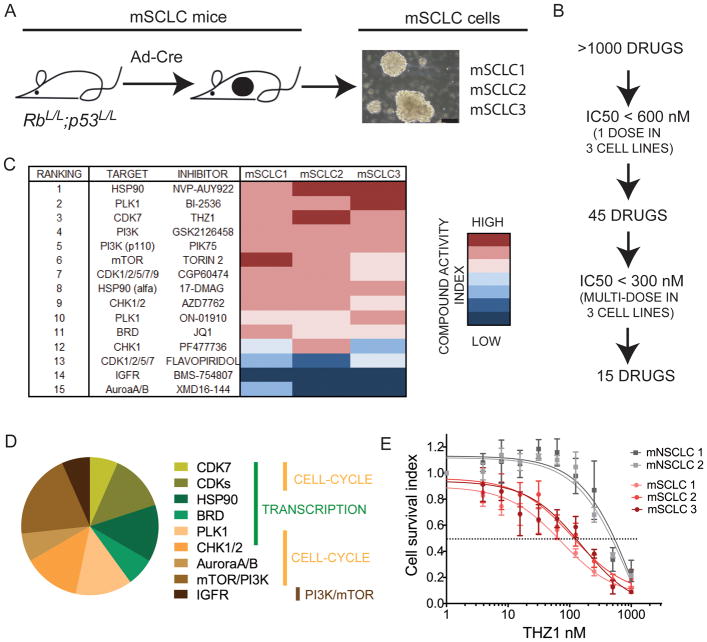
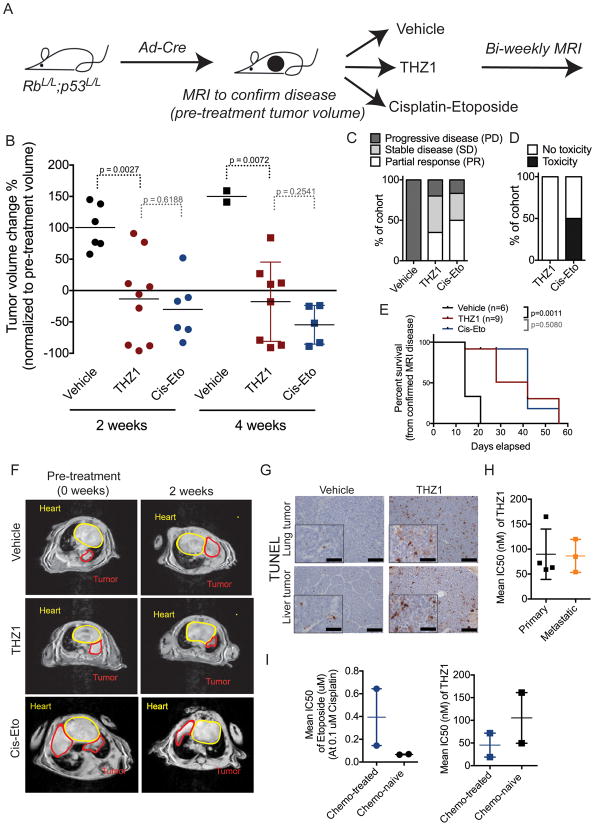
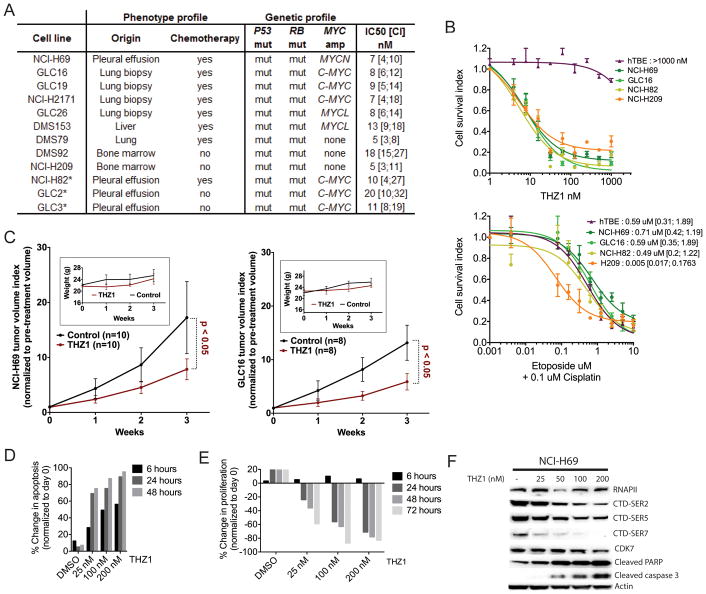
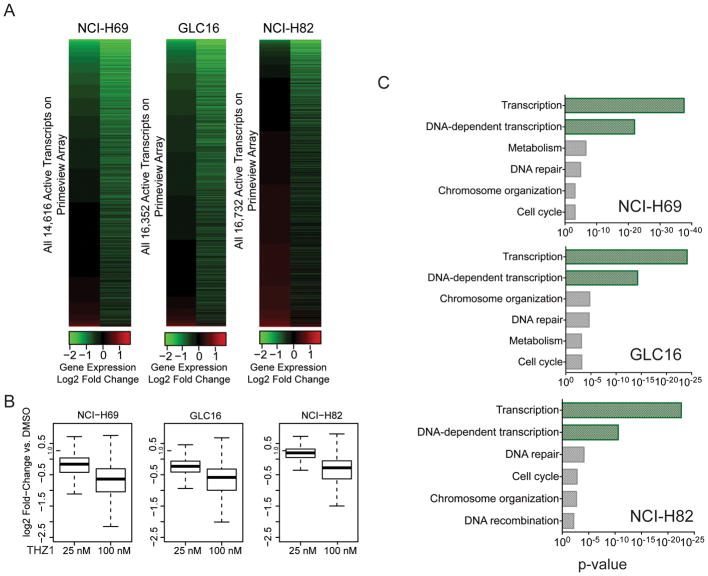
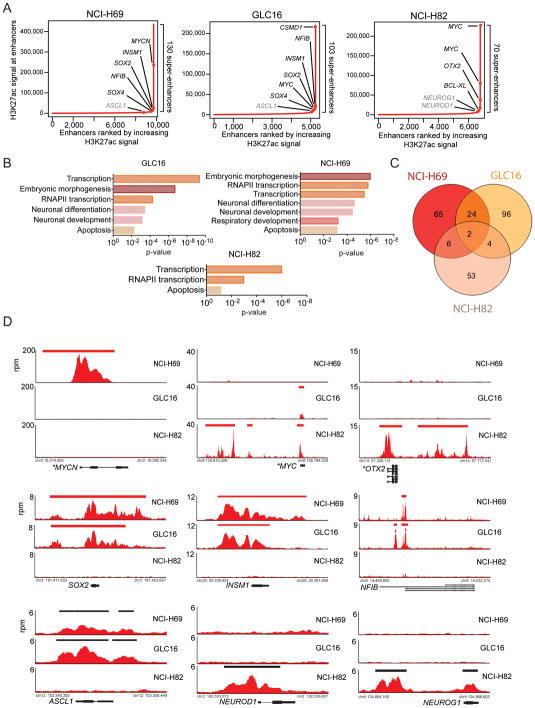
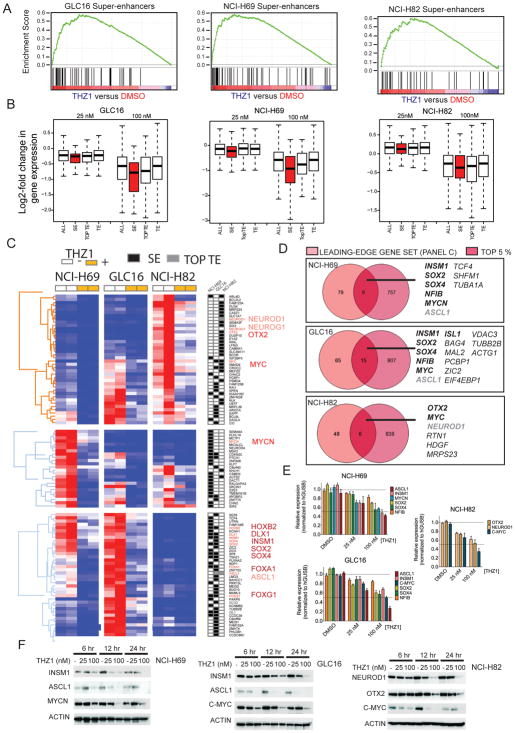
Small cell lung cancer (SCLC) is an aggressive disease with high mortality, and the identification of effective pharmacological strategies to target SCLC biology represents an urgent need. Using a high-throughput cellular screen of a diverse chemical library, we observe that SCLC is sensitive to transcription-targeting drugs, in particular to THZ1, a recently identified covalent inhibitor of cyclin-dependent kinase 7. We find that expression of super-enhancer-associated transcription factor genes, including MYC family proto-oncogenes and neuroendocrine lineage-specific factors, is highly vulnerability to THZ1 treatment. We propose that downregulation of these transcription factors contributes, in part, to SCLC sensitivity to transcriptional inhibitors and that THZ1 represents a prototype drug for tailored SCLC therapy.


Conflict of interest statement

CONFLICT OF INTEREST

Richard A. Young, Nathanael S. Gray and James E. Bradner are founders and equity holders in Syros that has licensed the CDK7 intellectual property from DFCI. Nicholas Kwiatkowski, Tinghu Zhang and Nathanael S. Gray are inventors on a patent application covering THZ1.

Figures

Figure 1
Figure 1. High-throughput drug screen in primary murine SCLC cell lines identifies THZ1 as a highly potent inhibitor of SCLC cell viability
A) Murine SCLC cell lines (mSCLC1, mSCLC2, mSCLC3) were established from 3 different adenovirus-Cre recombinase (Ad-Cre)-induced RbL/L;p53L/L (RP) mice aged 8–10 months. Representative morphology of established primary mSCLC cells is shown to the right in the panel. Black scale bar shown in micrographs represent 50μm. B) >1000 small-molecule inhibitors were included in a high-throughput screen using mSCLC1, mSCLC2 and mSCLC3 cell lines at passage 5–10. All drugs were added to each cell line (day 0) at a concentration of 600 nM, and cell viability was measured at day 5, allowing for 2 doubling cycles of (control) cells. The inhibitors, which reduced cell viability by 50 % (compared to no drug control), were further ranked following dose escalation treatment to determine IC50 of cell viability. Fifteen compounds had an IC50 below 300 nM according to both cell viability assays. C) Summary of top-15 ranked small molecules and corresponding targets as represented in an ‘IC50 heatmap’ format. D) Distribution of putative targets of top-15 ranked small molecules with targets categorized as regulating 1) transcription (indicated with green bar), 2) cell cycle (yellow bar) or 3) PI3K-mTOR pathway (brown bar). E) mSCLC and mNSCLC cell lines (mNSCLC1: Kras+/LSL-G12D;p53L/L, mNSCLC2: Kras+/LSL-G12;;p53L/L;Lkb1L/L) were incubated with increasing doses of THZ1 and IC50 were measured by cell viability assay. Data are presented as mean +/− SEM. See also Figure S1.
Figure 2
Figure 2. THZ1 treatment of RP mice causes significant tumor response and increased survival
A) Schematic overview of treatment trial with vehicle (control), THZ1 or Cisplatin-Etoposide compared to vehicle (control) in RP mice with confirmed (by MRI) SCLC disease. THZ1 is dosed at 10 mg/kg BID, Cisplatin-Etoposide (Cis-Eto) is dosed as follow: Cisplatin 5 mg/kg 1x per week, Etoposide 10 mg/kg 3x per week. Cis-Eto is given 1–2 weeks on (pending weight/toxicity) hereafter 2–3 weeks off followed by 1–2 weeks re-treatment (pending weight/toxicity and tumor burden according to MRI). After treatment start MRI was performed biweekly in all treatment cohorts. B) Tumor volume changes (%) according to MRI quantification in vehicle-treated (control), THZ1-treated and Cisplatin-Etoposide-treated mice at 2 and 4 weeks as normalized to pre-treatment (week 0) tumor volume. p-values between different treatment cohorts were calculated using Students t-test. Data are shown as individual values for tumor volume change (dots or squares) with horizontal line representing mean. C) Treatment response as divided into PD (progressive disease), SD (stable disease), and PR (partial response) groups in mice treated with vehicle (control), THZ1 or Cis-Eto. Data is shown as percent of total mice in respective treatment cohort. D) Toxicity events observed in mice treated with THZ1 or Cis-Eto as measured by weight loss in mice. If an animal’s weight decreased to 15 % or below (compared to pre-treatment weight) during the treatment study, animal was recorded to have treatment-induced toxicity. Data is shown as percent (%) of total mice in treatment cohort. E) Survival of control, THZ1-treated and Cis-Eto-treated mice. p-value was established using log-rank test (Mantel-Cox test). F) Representative MRIs of thorax region of mice treated with vehicle (control), THZ1 or Cis-Eto at 2 and 4 weeks. G) Representative 20x field micrographs (inserts 40x field) of Terminal deoxynucleotidyl transferase dUTP nick end-labeling (TUNEL) staining of lung tumor and liver metastases 72 hours after treatment with THZ1 or vehicle. Black scale bar in micrographs (20x) represent 50μm. Black scale bar in insert (40x) represent 25μm. H) Primary (lung) and metastatic (liver) SCLC lesions were isolated from Ad-Cre induced RP mice for cell line establishment. Cells established from lung tumor (primary) and metastatic (liver tumor) origin were incubated with increasing doses of THZ1, and the IC50s were determined by cell viability assay. IC50 from several different cell lines of either group are plotted to give a total calculated mean IC50 (horizontal line) with error bars representing SEM. I) SCLC tumor lesions from the lung were isolated from untreated RP mice (n=2) and chemo-treated mice (n=2) for establishment of primary cell lines. Primary cells (at passage 5) were incubated with increasing doses of Cis-Eto (right) or THZ1 (left) and the IC50s were determined by cell viability assay. IC50 from several different cell lines of either group are plotted (squares or dots) to give a total calculated mean IC50 (horizontal line) with error bars representing SEM. See also Figure S2.
Figure 3
Figure 3. THZ1 is a potent inhibitor of cell viability and tumor growth in a panel of genotypic and phenotypic distinct SCLC cell lines and xenografts
A) Summary of THZ1 IC50s in the full panel of SCLC cell lines with genotype and phenotype status. IC50 data are presented as mean with confidence interval (mean [CI]). Phenotype profile information on cell lines comprises the following: origin - organ of origin of tissue specimen from which cell line was established; chemotherapy - whether patients had received chemotherapy before cell line establishment (yes/no). Genetic profile information on cell lines includes: P53 and RB mutations (both leading to loss of function) and MYC gene family amplification (C-MYC, MYCN or MYCL). * indicates that cell lines have previously been classified as ‘variant’ neuroendocrine SCLC cell line based on the lack of expression of ‘classical’ neuroendocrine genes such as ASCL1, NCAM, SCG2. B) Representative hSCLC cell lines (from A)) and the immortalized tracheobronchial epithelial (hTBE) cell line were exposed to increasing doses of THZ1 (top panel) or Cisplatin-Etoposide (lower panel) and IC50s were determined by cell viability assay. Each data point is shown as mean +/− SEM. Mean IC50s to Cisplatin-Etoposide treatment are reported next to cell line name (lower panel) C) Tumor volume index of hSCLC xenografts grown on nude mice (NCI-H69: left panel; GLC16: right panel) as normalized to pre-treatment volume (day 0). Mice were treated with vehicle or THZ1. THZ1 was dosed at 10 mg/kg BID and vehicle BID. Inserts show weights from mice on treatment D) Apoptosis assay measuring caspase 3/7 activity in the SCLC cell line NCI-H69 after THZ1 treatment for indicated time points. E) Proliferation assay measuring BRDU incorporation in SCLC cell line NCI-H69 after THZ1 treatment for indicated time points. F) Western blot detecting RNAPII, CTD phosphorylation (SER-2, SER-5, SER-7), and CDK7 along with the apoptotic markers Caspase 3 and PARP in total protein lysates from NCI-H69 cell lines exposed to indicated doses of THZ1. ACTIN serves as a loading control. See also Figure S3.
Figure 4
Figure 4. THZ1 treatment preferentially targets transcription-regulating genes in SCLC cells
A) Heatmap displaying the Log2 fold-change in gene expression versus DMSO for all active transcripts in NCI-H69, GLC16 and NCI-H82 cells following treatment with 25 nM and 100 nM THZ1 for 6 hours. B) Box plots of Log2 fold-change in gene expression versus DMSO for all active transcripts in NCI-H69, GLC16 and NCI-H82 cells following treatment with 25 nM or 100 nM THZ1 for 6 hours. Whiskers extend to 1.5x the interquartile range. C) Enrichment p-values for selected Gene ontology (GO) functional categories of top-5% downregulated genes (vs DMSO) of all active transcripts in NCI-H69, GLC16 and NCI-H82 cells following treatment with 100 nM THZ1 using DAVID software. See also Table S1, Table S2, Figure S4.
Figure 5
Figure 5. Super-enhancers in hSCLC cell lines are associated with proto-oncogenic and lineage-specific transcription factor genes
A) Distribution of H3K27Ac signal at enhancers. Enhancer regions are plotted in increasing order based on their input-normalized H3K27Ac signal (length*density) in NCI-H69, GLC16 and NCI-H82 cell lines. B) Enrichment p-values for selected Gene Ontology (GO) functional categories of super-enhancer-associated genes in NCI-H69, GLC16 and NCI-H82 cell lines using DAVID. C) Venn diagram showing overlap between identified super-enhancer genes between NCI-H69, GLC16, and NCI-H82 cell lines. D) Gene tracks of H3K27Ac ChIP-seq occupancy and super-enhancer associated (top 2 rows) and typical-enhancer associated (bottom row) gene loci. The x-axis shows genomic position and the y-axis shows the signal of binding in 50bp bins in units of reads per million bin (rpm/bin). For genes with known focal amplification (MYCN (NCI-H69), MYC (NCI-H82, GLC16), input DNA signal-subtracted H3K27Ac signal is displayed (See Supplemental Experimental Procedures). Gene models are depicted below each track set. See also Table S3, Figure S5.
Figure 6
Figure 6. Identification of Super-enhancer-associated genes highly sensitive to THZ1 in SCLC cells
A) Gene set enrichment analysis (GSEA) plot showing significant enrichment of super-enhancer associated gene signature in 100 nM nM THZ1-treated cells relative to DMSO-treated cells. B) Box plots of log2 fold-changes in mean transcript abundance of genes associated with the total pool of all enhancers (ALL), typical enhancers (TE), top ranked (largest) typical enhancers (TOPTE) and super-enhancers (SE) upon treatment with 25 or 100 nM THZ1 compared to control (DMSO). Whiskers extend to 1.5x the interquartile range. C) Leading-edge genes identified from enrichment analysis in A) and corresponding heatmap of expression ‘leading-edge genes’ in DMSO- and 25 nM and 100 nM THZ1-treated cells. D) Venn diagram showing overlap of ‘leading-edge gene’ sets as identified in (A) with the top-5% highest-expressed genes for each cell line. Gene names in black bold italics are transcription factors, and gene names in black italics are not transcription factors. Gene names in gray bold italics are transcription factors associated with a TOPTE. E) Quantitative PCR to detect expression of indicated gene transcripts in DMSO, 25 nM and 100 nM THZ1-treated SCLC cells. Target gene expression is normalized to GUSB expression and ‘DMSO’ serve as reference sample set to ‘Relative expression’ index 1). Data are presented as mean +/− SEM. F) Western blotting to detect protein expression of indicated protein in DMSO, 25 nM and 100 nM THZ1-treated SCLC cells. ACTIN serves as a loading control. See also Table S4, Figure S6.

Comment in

References

    1. Ball DW. Achaete-scute homolog-1 and Notch in lung neuroendocrine development and cancer. Cancer letters. 2004;204:159–169. - PubMed
    1. Borges M, Linnoila RI, van de Velde HJ, Chen H, Nelkin BD, Mabry M, Baylin SB, Ball DW. An achaete-scute homologue essential for neuroendocrine differentiation in the lung. Nature. 1997;386:852–855. - PubMed
    1. Bosken CA, Farnung L, Hintermair C, Merzel Schachter M, Vogel-Bachmayr K, Blazek D, Anand K, Fisher RP, Eick D, Geyer M. The structure and substrate specificity of human Cdk12/Cyclin K. Nature communications. 2014;5:3505. - PMC - PubMed
    1. Brennan J, O’Connor T, Makuch RW, Simmons AM, Russell E, Linnoila RI, Phelps RM, Gazdar AF, Ihde DC, Johnson BE. myc family DNA amplification in 107 tumors and tumor cell lines from patients with small cell lung cancer treated with different combination chemotherapy regimens. Cancer research. 1991;51:1708–1712. - PubMed
    1. Carney DN, Bunn PA, Jr, Gazdar AF, Pagan JA, Minna JD. Selective growth in serum-free hormone-supplemented medium of tumor cells obtained by biopsy from patients with small cell carcinoma of the lung. Proceedings of the National Academy of Sciences of the United States of America. 1981;78:3185–3189. - PMC - PubMed

Publication types

MeSH terms

Associated data