. 2014 Dec 5;14(12):23230-47.
doi: 10.3390/s141223230.

Drift removal for improving the accuracy of gait parameters using wearable sensor systems

Affiliations

Drift removal for improving the accuracy of gait parameters using wearable sensor systems

Ryo Takeda et al. Sensors (Basel). .

Abstract

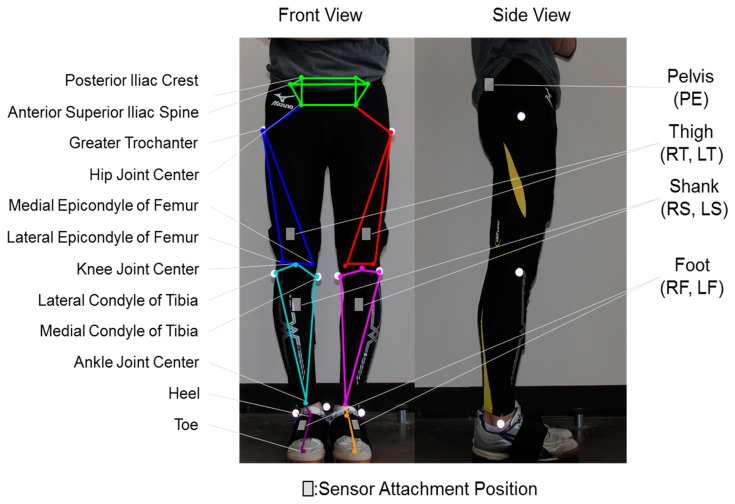
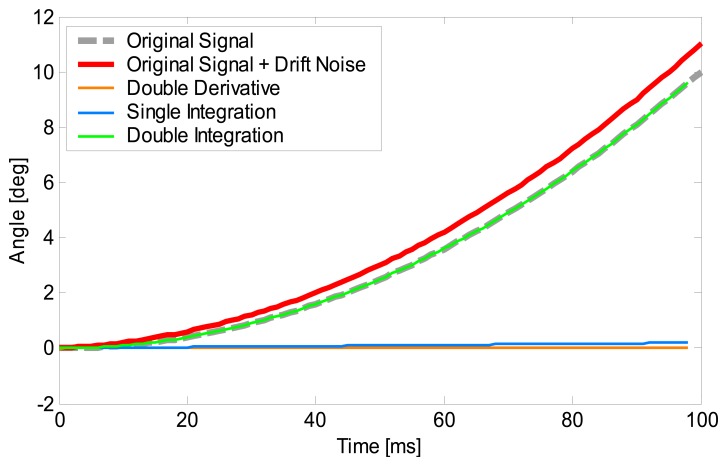
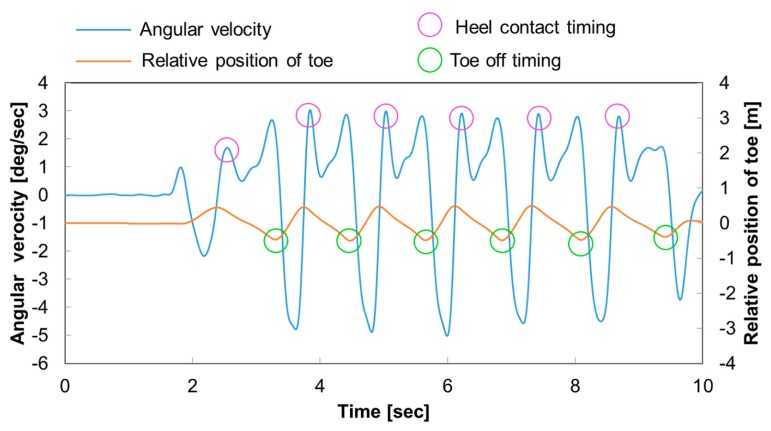
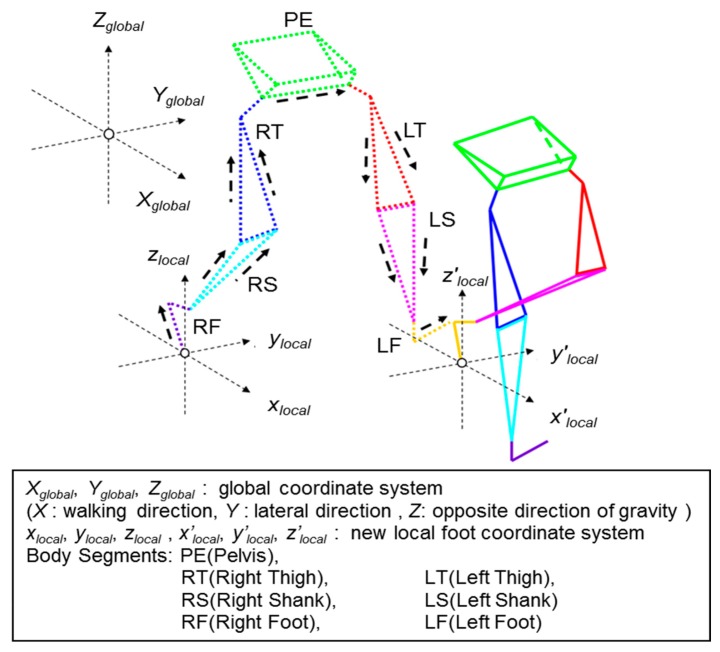
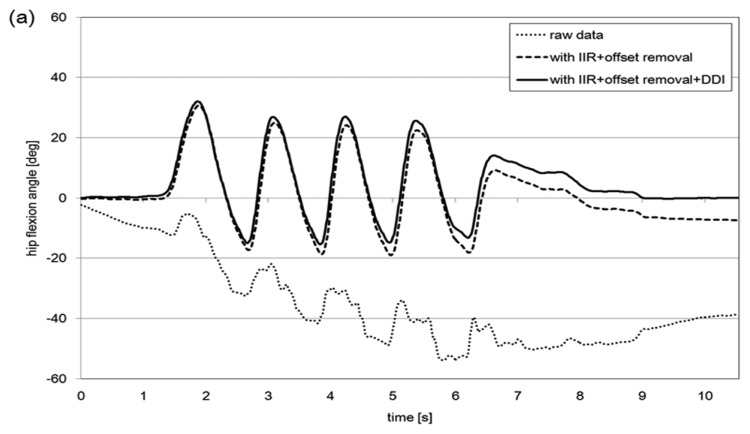
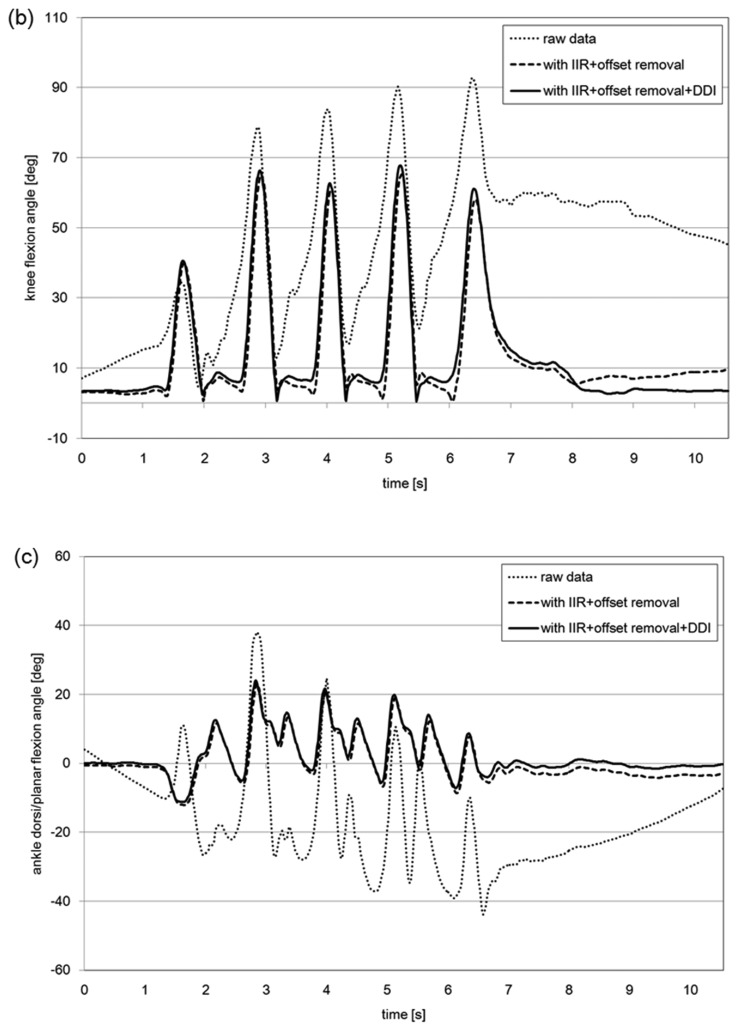
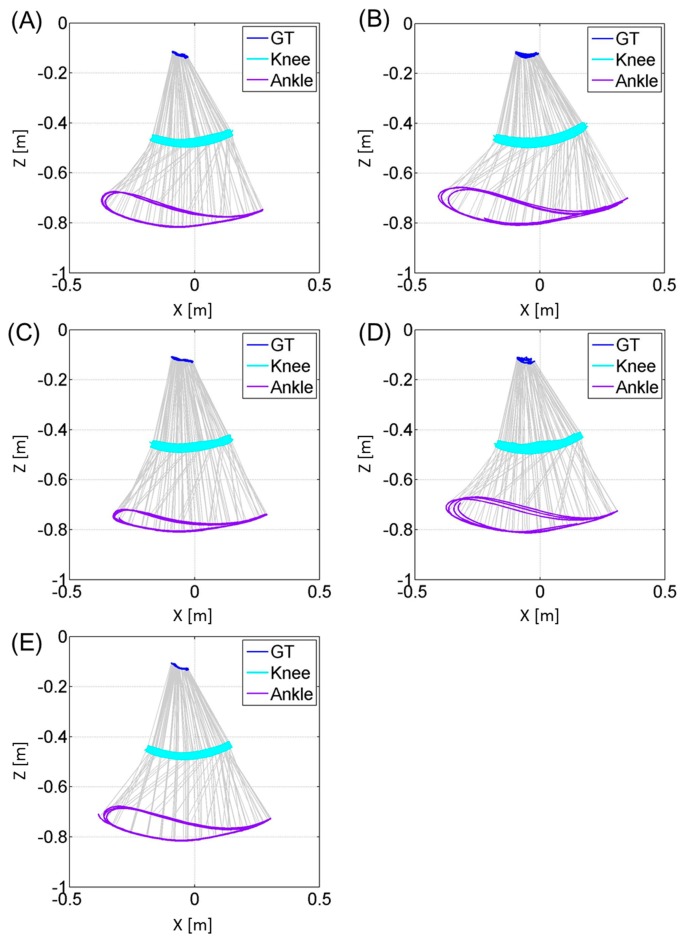
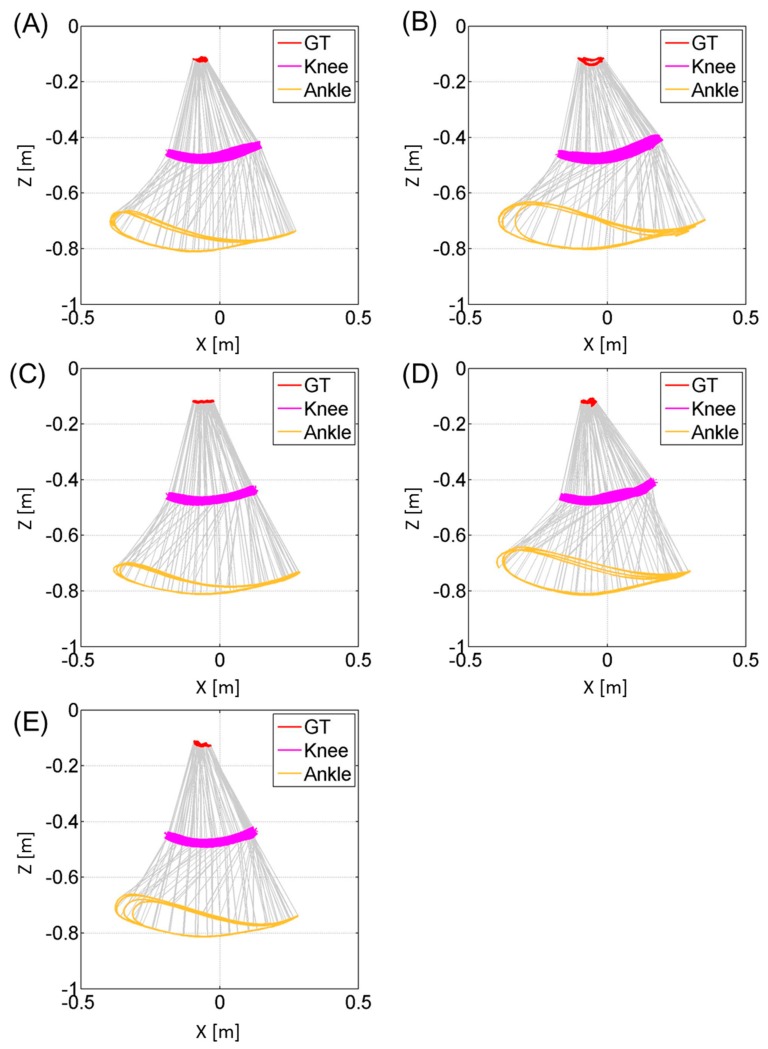
Accumulated signal noise will cause the integrated values to drift from the true value when measuring orientation angles of wearable sensors. This work proposes a novel method to reduce the effect of this drift to accurately measure human gait using wearable sensors. Firstly, an infinite impulse response (IIR) digital 4th order Butterworth filter was implemented to remove the noise from the raw gyro sensor data. Secondly, the mode value of the static state gyro sensor data was subtracted from the measured data to remove offset values. Thirdly, a robust double derivative and integration method was introduced to remove any remaining drift error from the data. Lastly, sensor attachment errors were minimized by establishing the gravitational acceleration vector from the acceleration data at standing upright and sitting posture. These improvements proposed allowed for removing the drift effect, and showed an average of 2.1°, 33.3°, 15.6° difference for the hip knee and ankle joint flexion/extension angle, when compared to without implementation. Kinematic and spatio-temporal gait parameters were also calculated from the heel-contact and toe-off timing of the foot. The data provided in this work showed potential of using wearable sensors in clinical evaluation of patients with gait-related diseases.


Figures

Figure 1.
Figure 1.
Sensor attachment location and gait wire frame model. The wire frame model is created by connecting characteristic positions of the lower limb. Sensor units are attached to seven body segments of the lower limb. This model has been implemented from the works of Tadano et al. [16].
Figure 2.
Figure 2.
Simulation of the DDI method. The vertical axis represents the angle and horizontal axis represents time. The grey broken line represents the original signal and the red line represents the signal model with linear drift noise. The signal processed after double derivative, single integration and double integration are represented by the orange, blue and green lines, respectively.
Figure 3.
Figure 3.
The method used to detect the HC and TO timing of the foot. The vertical axis represents the angular velocity and the relative position of the toe. The horizontal axis represents time. The HC timings are detected by the characteristic lateral angular velocity peaks and circled in pink. The TO timings are detected by measuring the negative peaks of the relative distance of the toe position to the origin of the pelvis (PE) coordinate system as circled in green.
Figure 4.
Figure 4.
Wire frame model of the volunteer. The Xglobal, Yglobal, Zglobal represent the global coordinate system, where the Xglobal axis is the walking direction, the Yglobal axis is the left-lateral direction, and the Zglobal axis the vertical direction. The xlocal, ylocal, zlocal and x′local, y′local, z′local represent the new local foot coordinate system based on each step of gait. PE, RT, LT, RS, LS, RF and LF represent each of the body segments.
Figure 5.
Figure 5.
Comparison of the joint angle results obtained through the different methods of signal drift reduction protocol (raw data, IIR + offset removal, IIR + offset removal + DDI) for a volunteer. (a) Hip joint flexion angle; (b) knee joint flexion angle and (c) ankle joint flexion angle are shown.
Figure 5.
Figure 5.
Comparison of the joint angle results obtained through the different methods of signal drift reduction protocol (raw data, IIR + offset removal, IIR + offset removal + DDI) for a volunteer. (a) Hip joint flexion angle; (b) knee joint flexion angle and (c) ankle joint flexion angle are shown.
Figure 6.
Figure 6.
These figures represent the trajectories of the greater trochanter (GT), knee joint center and ankle joint center for the right leg of each subject (A, B, C, D, E) during three gait cycle in the sagittal plane. The vertical axis represents the Zglobal axis and the horizontal axis represents the Xglobal axis. The trajectories are plotted at a sampling rate of 33 Hz.
Figure 7.
Figure 7.
These figures represent the trajectories of the greater trochanter (GT), knee joint center and ankle joint center for the left leg of each subject (A, B, C, D, E) during three gait cycles in the sagittal plane. The vertical axis represents the Zglobal axis and the horizontal axis represents the Xglobal axis. The trajectories are plotted at a sampling rate of 33 Hz.
Figure 8.
Figure 8.
These figures represent the trajectory of the knee (left figure) and ankle joint (right figure) center during three gait cycles in the horizontal plane for each volunteer sampled at 33 Hz. The vertical axis represents the Xglobal axis and the horizontal axis represents the Yglobal axis. The trajectories for the left knee/ankle are shown in red and those for the right knee/ankle are in blue. The black line emanating from the ankle joint trajectories represent the direction of each toe. (A) through (E) represent the data for each of the five volunteers.

References

    1. Kirtley C. Clinical Gait Analysis: Theory and Practice. Elsevier Churchill Livingstone; London, UK: 2006.
    1. Morris J.R.W. Accelerometry—A technique for the measurement of human body movements. J. Biomech. 1973;6:729–736. - PubMed
    1. Veltink P.H., Bussmann Hans B.J., de Vries W., Martens Wim L.J., van Lummel R.C. Detection of static and dynamic activities using uniaxial accelerometers. IEEE Trans. Rehabil. Eng. 1996;4:375–385. - PubMed
    1. Bouten C.V.C., Koekkoek K.T.M., Verduin M., Kodde R., Janssen J.D. A triaxial accelerometer and portable data processing unit for the assessment of daily physical activity. IEEE Trans. Biomed. Eng. 1997;44:136–147. - PubMed
    1. Foerster F., Smeja M., Fahrenberg J. Detection of posture and motion by accelerometry: A validation study in ambulatory monitoring. Comput. Hum. Behav. 1999;15:571–583.

Publication types