

MR fingerprinting using fast imaging with steady state precession (FISP) with spiral readout
- PMID: 25491018
- PMCID: PMC4461545
- DOI: 10.1002/mrm.25559
MR fingerprinting using fast imaging with steady state precession (FISP) with spiral readout
Abstract
Purpose: This study explores the possibility of using gradient echo-based sequences other than balanced steady-state free precession (bSSFP) in the magnetic resonance fingerprinting (MRF) framework to quantify the relaxation parameters .
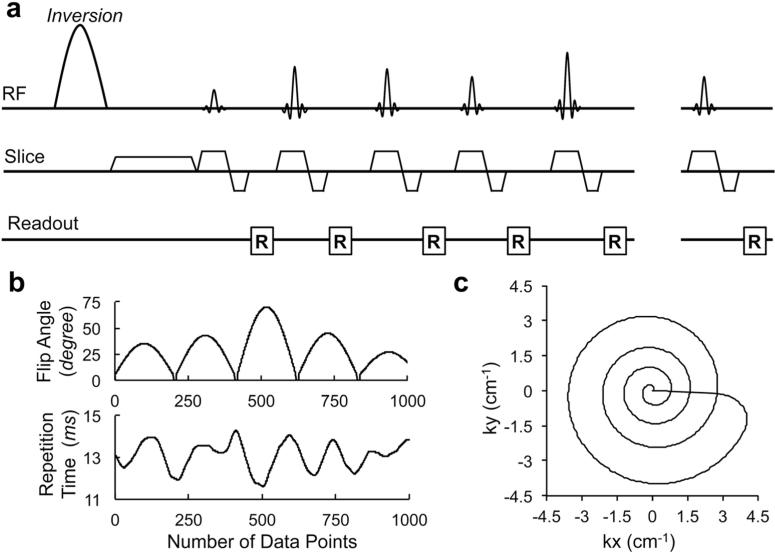
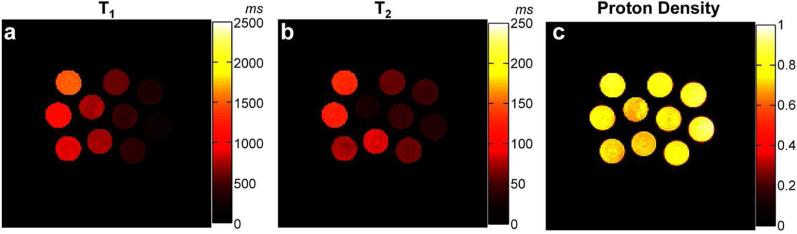
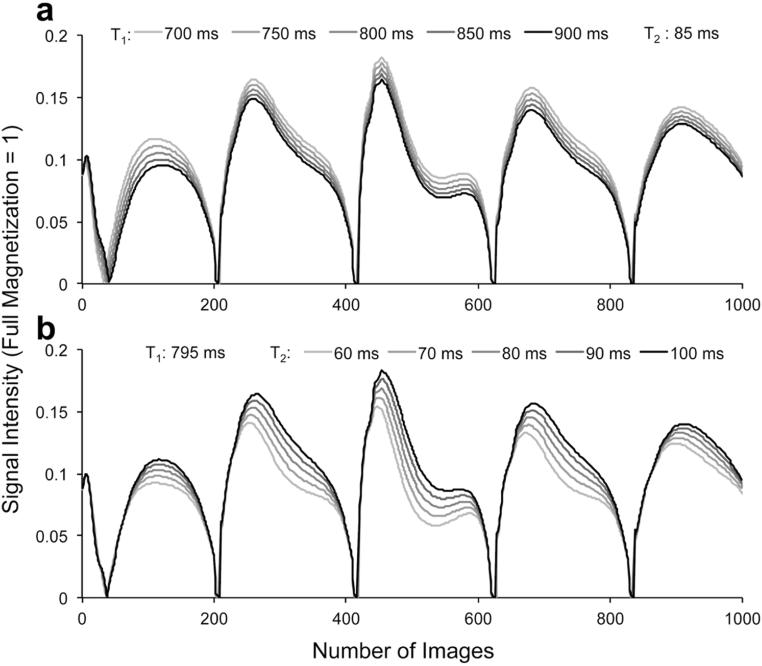
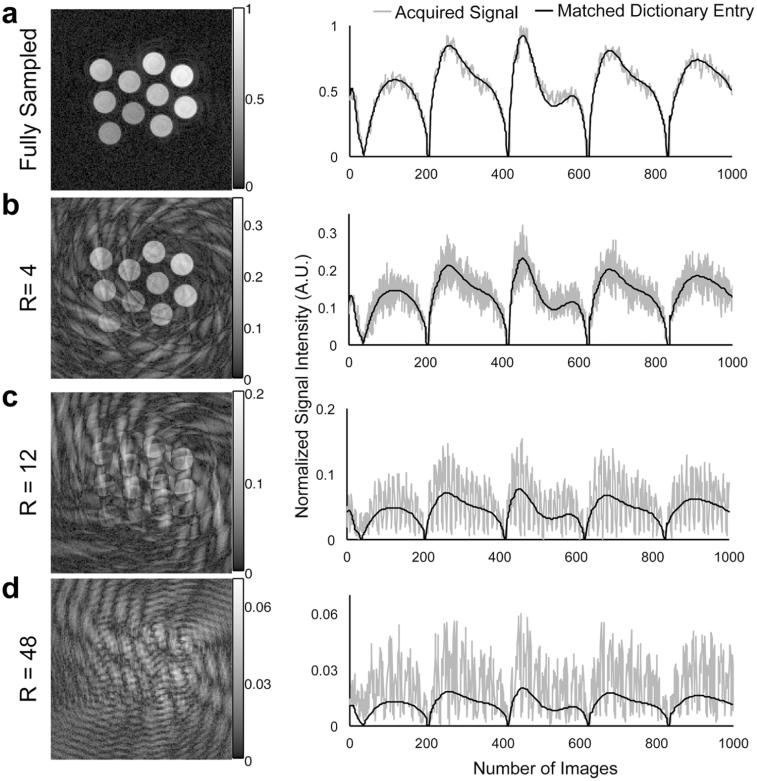
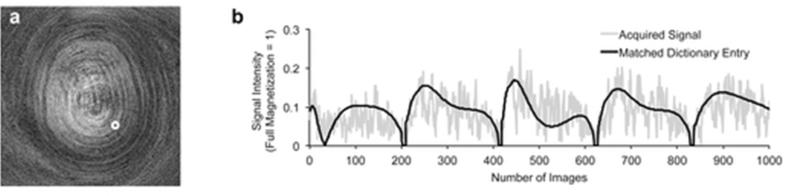
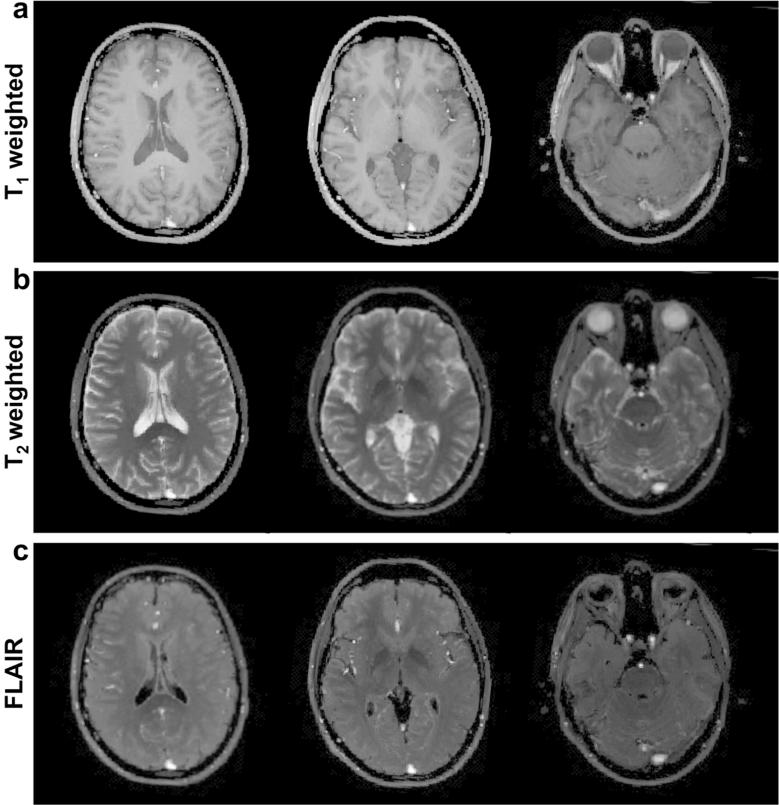
Methods: An MRF method based on a fast imaging with steady-state precession (FISP) sequence structure is presented. A dictionary containing possible signal evolutions with physiological range of T1 and T2 was created using the extended phase graph formalism according to the acquisition parameters. The proposed method was evaluated in a phantom and a human brain. T1 , T2 , and proton density were quantified directly from the undersampled data by the pattern recognition algorithm.
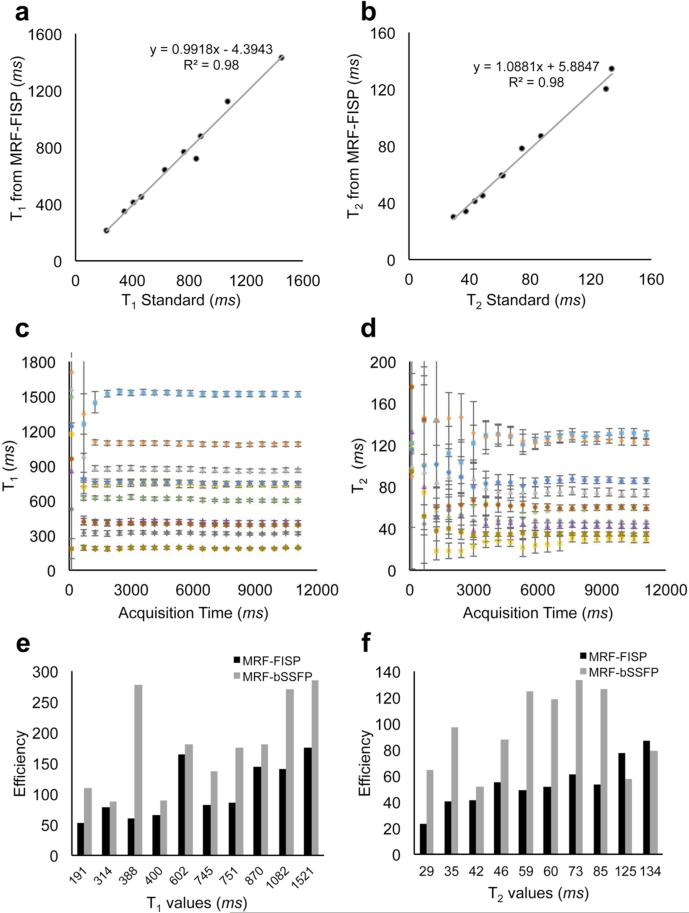
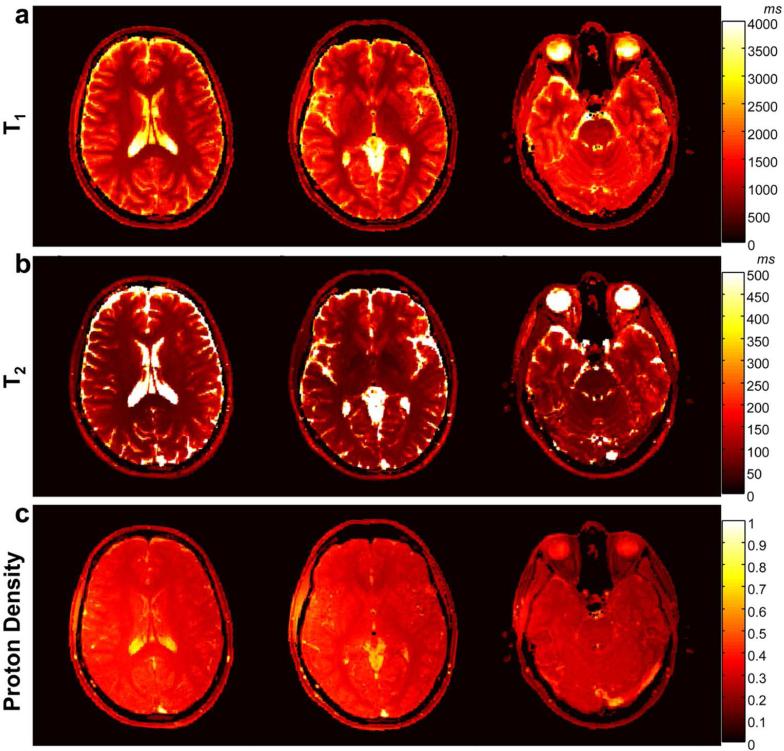
Results: T1 and T2 values from the phantom demonstrate that the results of MRF FISP are in good agreement with the traditional gold-standard methods. T1 and T2 values in brain are within the range of previously reported values.
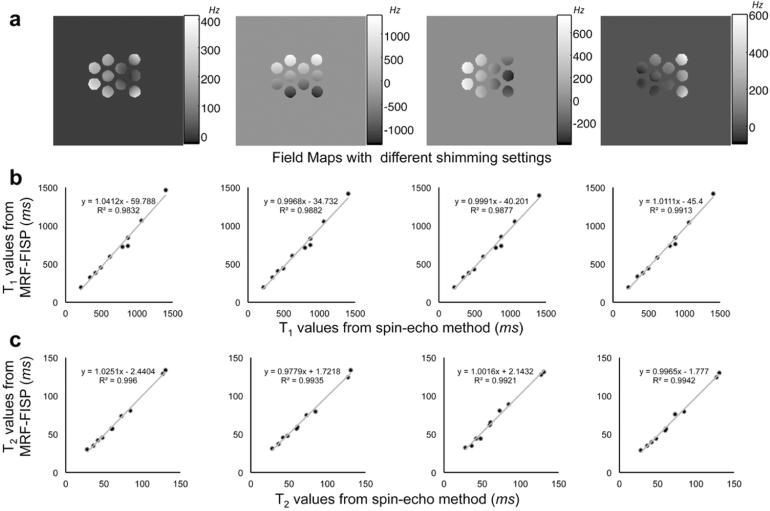
Conclusion: MRF-FISP enables a fast and accurate quantification of the relaxation parameters. It is immune to the banding artifact of bSSFP due to B0 inhomogeneities, which could improve the ability to use MRF for applications beyond brain imaging.
Keywords: FISP; MR fingerprinting; quantitative imaging; relaxation time; spiral.
© 2014 Wiley Periodicals, Inc.
Figures
Similar articles
-
MR fingerprinting for rapid quantification of myocardial T1 , T2 , and proton spin density.Magn Reson Med. 2017 Apr;77(4):1446-1458. doi: 10.1002/mrm.26216. Epub 2016 Apr 1. Magn Reson Med. 2017. PMID: 27038043 Free PMC article.
-
Magnetic resonance fingerprinting with quadratic RF phase for measurement of T2* simultaneously with δf , T1 , and T2.Magn Reson Med. 2019 Mar;81(3):1849-1862. doi: 10.1002/mrm.27543. Epub 2018 Oct 30. Magn Reson Med. 2019. PMID: 30499221 Free PMC article.
-
MR fingerprinting using the quick echo splitting NMR imaging technique.Magn Reson Med. 2017 Mar;77(3):979-988. doi: 10.1002/mrm.26173. Epub 2016 Feb 28. Magn Reson Med. 2017. PMID: 26924639 Free PMC article.
-
Fundamentals of balanced steady state free precession MRI.J Magn Reson Imaging. 2013 Jul;38(1):2-11. doi: 10.1002/jmri.24163. Epub 2013 Apr 30. J Magn Reson Imaging. 2013. PMID: 23633246 Review.
-
Practical applications of balanced steady-state free-precession (bSSFP) imaging in the abdomen and pelvis.J Magn Reson Imaging. 2017 Jan;45(1):11-20. doi: 10.1002/jmri.25336. Epub 2016 Jul 4. J Magn Reson Imaging. 2017. PMID: 27373694 Review.
Cited by
-
Improved Balanced Steady-State Free Precession Based MR Fingerprinting with Deep Autoencoders.Annu Int Conf IEEE Eng Med Biol Soc. 2022 Jul;2022:3029-3034. doi: 10.1109/EMBC48229.2022.9871003. Annu Int Conf IEEE Eng Med Biol Soc. 2022. PMID: 36086452 Free PMC article.
-
Preclinical MR fingerprinting (MRF) at 7 T: effective quantitative imaging for rodent disease models.NMR Biomed. 2015 Mar;28(3):384-94. doi: 10.1002/nbm.3262. Epub 2015 Feb 2. NMR Biomed. 2015. PMID: 25639694 Free PMC article.
-
Slice-selective extended phase graphs in gradient-crushed, transient-state free precession sequences: An application to MR fingerprinting.Magn Reson Med. 2020 Dec;84(6):3409-3422. doi: 10.1002/mrm.28381. Epub 2020 Jul 22. Magn Reson Med. 2020. PMID: 32697869 Free PMC article.
-
Deep learning reconstruction for cardiac magnetic resonance fingerprinting T1 and T2 mapping.Magn Reson Med. 2021 Apr;85(4):2127-2135. doi: 10.1002/mrm.28568. Epub 2020 Oct 26. Magn Reson Med. 2021. PMID: 33107162 Free PMC article.
-
Silicone-based materials with tailored MR relaxation characteristics for use in reduced coil visibility and in tissue-mimicking phantom design.Med Phys. 2023 Jun;50(6):3498-3510. doi: 10.1002/mp.16255. Epub 2023 Feb 14. Med Phys. 2023. PMID: 36737839 Free PMC article.
References
-
- Cheng H-LM, Stikov N, Ghugre NR, Wright GA. Practical medical applications of quantitative MR relaxometry. J. Magn. Reson. Imaging. 2012;36:805–24. - PubMed
-
- Look DC. Time Saving in Measurement of NMR and EPR Relaxation Times. Rev. Sci. Instrum. 1970;41:250.
-
- Deoni SCL, Rutt BK, Peters TM. Rapid combined T1 and T2 mapping using gradient recalled acquisition in the steady state. Magn. Reson. Med. 2003;49:515–26. - PubMed
-
- Messroghli DR, Radjenovic A, Kozerke S, Higgins DM, Sivananthan MU, Ridgway JP. Modified Look-Locker inversion recovery (MOLLI) for high-resolution T1 mapping of the heart. Magn. Reson. Med. 2004;52:141–6. - PubMed
-
- Zhu DC, Penn RD. Full-brain T1 mapping through inversion recovery fast spin echo imaging with time-efficient slice ordering. Magn. Reson. Med. 2005;54:725–31. - PubMed
Publication types
MeSH terms
Grants and funding
LinkOut - more resources
Full Text Sources
Other Literature Sources
Medical
Miscellaneous
