. 2014 Dec 10:15:43.
doi: 10.1186/s12860-014-0043-3.

Two different pathways of phosphatidylcholine synthesis, the Kennedy Pathway and the Lands Cycle, differentially regulate cellular triacylglycerol storage

Affiliations

Two different pathways of phosphatidylcholine synthesis, the Kennedy Pathway and the Lands Cycle, differentially regulate cellular triacylglycerol storage

Christine Moessinger et al. BMC Cell Biol. .

Abstract

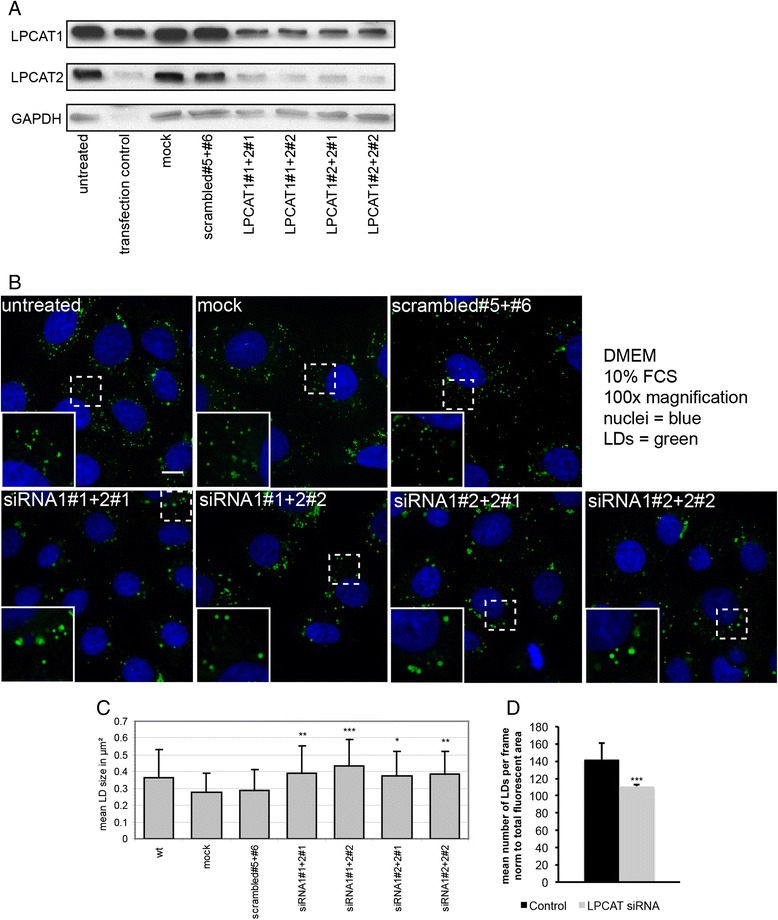
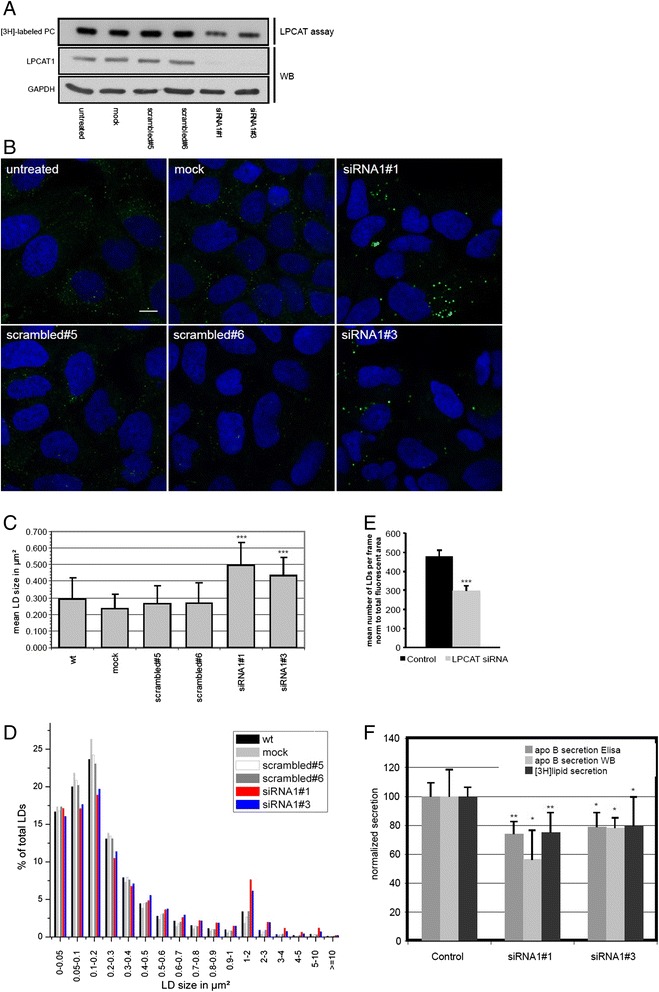
Background: Lipids are stored within cells in lipid droplets (LDs). They consist of a core of neutral lipids surrounded by a monolayer of phospholipids, predominantly phosphatidylcholine (PC). LDs are very dynamic and can rapidly change in size upon lipid uptake or release. These dynamics require a fast adaptation of LD surface. We have recently shown that two Lands cycle PC synthesizing enyzmes, LPCAT1 and LPCAT2 can localize to the LD surface.

Results: Here, we show that knock-down of both enzymes leads to an increase in LD size without changes in the total amount of neutral lipids, while interference with the de-novo Kennedy pathway PC biosynthesis is associated with changes in triacylglyceride synthesis. We show that function of LPCAT1 and 2 is conserved in Drosophila melanogaster by the ortholog CG32699. Furthermore we demonstrate that modulation of the LD pool by LPCAT1 influences the release of lipoprotein from liver cells.

Conclusion: Activity of the Kennedy pathway regulates the balance between phospholipids and neutral lipids, while the Lands cycle regulates lipid droplet size by regulating surface availability and influencing surface to volume ratio. Differences in lipid droplet size may account for differences in lipid dynamics and be relevant to understand lipid overload diseases.


Figures

Figure 1
Figure 1
Silencing of LPCAT1 and LPCAT2 by siRNA leads to enlarged lipid droplets in A431 cells. A) A431 cells were either left untreated (untreated, wt), mock transfected (mock), transfected with control siRNA (eg5 as transfection control, leads to cell death, or scrambled#5 + #6 as non-targeting siRNAs) or the four possible combinations of two sequences each against LPCAT1 or LPCAT2 as indicated. After 48 h cells were lysed and subjected to SDS-PAGE/Western blotting for LPCAT1, LPCAT2 and glycerol-3-phosphate dehydrogenase (GAPDH, as a load control). B) Confocal images of controls and LPCAT1/LPCAT2 double-knock-downs as described in panel A. Nuclei (blue), LDs (green), scalebar = 10 μm. C) Confocal images as described in panel B were quantified with Image J for LD size distribution as described in Methods. Data are mean LD size ± StdDev, calculated from >50 individual cells in 3 independent experiments. Significances relative to non-targeting siRNAs were calculated by unpaired two-sided T-test analysis (*** p ≤ 0.001, ** p ≤ 0.01, * p ≤ 0.05). D) Confocal image as described in panel B were quantified with ImageJ. Data show mean lipid droplet number per frame, corrected for variations in cell density, calculated from >50 individual cells in 3 independent experiments. Control: scrambled#5 + #6, LPCAT siRNA: average of all siRNA treatments. Significance was calculated by unpaired two-sided T-test analysis (*** p ≤ 0.001).
Figure 2
Figure 2
Silencing of LPCAT1 by siRNA leads to enlarged lipid droplets and reduced lipoprotein secretion in HuH7 cells. A) HuH7 cells were either left untreated (untreated, wt), mock transfected (mock), transfected with control siRNA (scrambled#5 or scrambled#6 as non-targeting siRNAs) or the two different siRNA sequences against LPCAT1 as indicated. After 72 h cells were subjected to a LPCAT activity assay or Western blotting (WB) for LPCAT1 using GAPDH, as load control. B) Confocal images of controls and LPCAT1 knock-downs as described in panel A. Nuclei (blue), LDs (green), scale bar = 10 μm C + D) Confocal images as described in panel B were quantified for LD size distribution as described in Methods. Data represented mean LD size ± StdDev, calculated from > 50 individual cells in 3 independent experiments. Significances were calculated by unpaired two-sided T-test analysis relative to non-targeting siRNA (scrambled#5) (*** p ≤ 0.001). For analysis of LD size distribution (panel D), LDs were grouped into size classes, and the distribution displayed as percentage of total LDs per size class. Controls (black, light and dark grey and white), siRNAs against LPCAT1 (red, blue). E) Confocal images as described in panel B were quantified with Image J. Data show mean lipid droplet number per frame, corrected for variations in cell density, calculated from >50 individual cells in 3 independent experiments. Control: average of scrambled#5 and scrambled#6, LPCAT siRNA: average of both siRNA treatments. Significance was calculated by unpaired two-sided T-test analysis (*** p ≤ 0.001). F) HuH7 cells were transfected with non-targeting siRNA (control) or different siRNA sequences targeting LPCAT1 as indicated. ApoB secretion was measured by ELISA (dark grey, data represent mean ± StdDev, n = 4) or by Western blotting (light grey, data represent mean ± StdDev, n = 5). [3H]lipid secretion after labeling with 1 μCi [3H]oleate was calculated as % of total radioactivity recovered (supernatant + cells) and normalized to control. Data represent mean ± StdDev, n = 4. p-Values were obtained by unpaired T-test relative to the respective control (** p ≤ 0.01, * p ≤ 0.05).
Figure 3
Figure 3
Increase in LD size upon LPCAT1/2 knock-down is independent of neutral lipid synthesis and accumulation. A) A431 cells were transfected with siRNA as described in Figure 1A. Seventy hours after siRNA transfection growth medium was exchanged to medium containing 10% delipidated FCS and 50 μM alkyne-oleate. After two hours cells were washed and lipids extracted. Extracts were subjected to quantitative click-analysis for the ratio of incorporation of alkyne fatty acid into TAG and PC. Data are mean ± StdDev, n = 3. Significances were calculated by unpaired two-sided T-test analysis relative to non-targeting siRNA (scrambled#5 + #6) and were found to be insignificant. B) A431 cells were transfected as described in Figure 1A. After 48 h, total lipid extracts were analyzed by mass spectrometry in duplicate samples, and species abundances were normalized to the corresponding internal standard. The molar contents of each species of the same class were summed up and normalized to the total content of all detectable lipids. C) HuH7 cells were transfected with siRNA as described in Figure 2A. Seventy hours after siRNA transfection as indicated, growth medium was exchanged to medium containing 10% delipidated FCS and 50 μM alkyne-oleate. After two hours, cells were washed, lipids extracted and extracts were subjected to quantitative click-analysis as in panel A. Data are mean ± StdDev, n = 3. Significances were calculated compared to non-targeting siRNAs (scrambled#5) and were found to be insignificant. D) HuH7 cells were transfected as described in Figure 2A. After 72 h, total lipid extracts were analyzed by mass spectrometry in duplicate samples. Species abundances were normalized as described for panel B.
Figure 4
Figure 4
Inhibition of de-novo PC synthesis results in increased LD size and TAG synthesis. A431 cells were left untreated (untreated), treated with transfection reagent (mock) or transfected with a non-targeting stealth siRNAs (non-targ.) or three different stealth siRNAs against CT alpha (siRNA1-siRNA3) for 72 h. A) Representative confocal images, stained with DAPI (blue) and LD540 (orange). Bar, 10 μm. B) Images were analyzed for LD size as described in Methods. Data are mean LD size ± StdDev, calculated from > 50 individual cells in 3 independent experiments. Significances were calculated by unpaired two-sided T-test analysis relative to non-targeting control (non-targ.) (*** p ≤ 0.001, ** p ≤ 0.01). C) Amount of CT alpha mRNA left after CTalpha knock-down relative to non targeting control, measured by real-time PCR. Standard deviations and significances were calculated by unpaired T-test analysis from 3 different experiments (*** p ≤ 0.001). D) Seventy hours after siRNA transfection as indicated, growth medium was exchanged to medium containing 10% delipidated FCS and 50 μM alkyne-oleate. After two hours cells were washed and lipids extracted and analyzed for alkyne labeled TAG and PC. Data are mean ± StdDev, n = 3. Significances were calculated by unpaired two-sided T-test analysis relative to non-targeting control (non-targ.) (*** p ≤ 0.001, * p ≤ 0.05). E) A431 cells were transfected as described for panel A. After 72 h, total lipid extracts were analyzed by mass spectrometry in triplicate samples. Species abundances were normalized to the corresponding internal standard. Species of each class were summed up and normalized to total detectable lipids. Significances for TAG, CE and PC O- were calculated by unpaired two-sided T-test analysis relative to non-targeting control (### p ≤ 0.001, # p ≤ 0.05) and relative to mock transfection (*** p ≤ 0.001).
Figure 5
Figure 5
LD size is unaffected by knock-down of LPCAT3 and LPCAT4. A) A431 cells were either left untreated, mock transfected (mock) or transfected with a non-targeting stealth siRNAs (non-targ.) or with the two different stealth siRNA sequences against LPCAT3 (siRNA3-1, siRNA3-2) or LPCAT4 (siRNA4-1, siRNA4-2) or combinations thereof as indicated. After 72 h incubation cells were fixed, stained with DAPI and LD540 and imaged. LD size was quantified with ImageJ. Standard deviations and significances were calculated from 3 experiments by unpaired T-test analysis compared to non-targeting control and were found to be insignificant. B) mRNA was measured by real-time PCR after single or double knock-down of LPCAT3 and LPCAT4 as described for panel A. Values are shown relative to the non-targeting control. Standard deviations and significances were calculated as above (*** p ≤ 0.001, ** p ≤0.01). C) A431 cells were either transfected with non-targeting stealth siRNA or with stealth siRNA sequence against LPCAT3 (siRNA3-2) or LPCAT4 (siRNA4-1) or combination (siRNA3-2;4-1). 48 h after transfection 100 μM oleate was added to the medium to induce formation of LDs. 72 h after transfection cells were lysed and lipid droplets were purified using sucrose gradient and subjected to a LPCAT activity assay. Values are normalized to the amount of the LD protein NSDHL as determined by western blotting. Standard deviations and significances were calculated as above and were found to be insignificant. D) A431 cells were treated with stealth siRNA and supplemented with oleate as described for panel C. 72 h after transfection cells were lysed and lysate was subjected to a LPCAT activity assay using equal amounts of total protein. Standard deviations and significances were calculated from three experiments as above (*** p ≤ 0.001, * p ≤0.05) compared to non-targeting control.
Figure 6
Figure 6
The LPCAT1/2 fly ortholog CG32699 resembles human LPCAT1 and 2. A) Drosophila melanogaster S2 Schneider cells were transfected with GFP-CG32699, which is the fly ortholog of mammalian LPCAT1 and LPCAT2. The growth medium was supplemented with 100 μM oleate. In the merged image, LDs are shown in red and CG32699 in green. Lower panels show a higher magnification of the central region of the pictures in the upper panels. Scalebar = 10 μm. Note the colocalization of GFP and LD540 signals. Resolution is limited due to the small size and round shape of S2 cells. B) Female virgin flies of a tubulin-Gal4 containing fly strain were crossed with male flies of three different CG32699-specific RNAi containing fly strains. L3 larvae were selected, fat bodies were isolated and representative DIC images of those fat bodies are shown for wildtype (wt), white mutant (white) and the three RNAi strains 32382, 32924 and 104570. The amount of CG32699 mRNA was measured by quantitative PCR. Scale bar = 10 μm. C + D) Bright field images as shown in panel B were quantified with ImageJ. Mean lipid droplet number per frame and mean lipid droplet size is presented for 3 frames per condition of 4 different experiments. significances were calculated by unpaired T-test analysis (*** p ≤ 0.001, ** p ≤0.01) compared to control. E) Female virgin flies of a tubulin-Gal4 containing fly strain were crossed with male flies of 3 different CG32699-specific RNAi containing fly strains or white mutant (white). From each cross three L3 larvae were selected and subjected to a LPCAT activity assay. Data were analyzed with Gel Pro Analyzer. Standard deviations and significances were calculated from three experiments by unpaired T-test analysis (** p ≤ 0.01, * p ≤0.05) compared to control (white).

References

    1. Walther TC, Farese RV., Jr The life of lipid droplets. Biochim Biophys Acta. 2009;1791(6):459–466. doi: 10.1016/j.bbalip.2008.10.009. - DOI - PMC - PubMed
    1. Bartz R, Li WH, Venables B, Zehmer JK, Roth MR, Welti R, Anderson RG, Liu P, Chapman KD. Lipidomics reveals that adiposomes store ether lipids and mediate phospholipid traffic. J Lipid Res. 2007;48(4):837–847. doi: 10.1194/jlr.M600413-JLR200. - DOI - PubMed
    1. Tauchi-Sato K, Ozeki S, Houjou T, Taguchi R, Fujimoto T. The surface of lipid droplets is a phospholipid monolayer with a unique Fatty Acid composition. J Biol Chem. 2002;277(46):44507–44512. doi: 10.1074/jbc.M207712200. - DOI - PubMed
    1. Brasaemle DL, Dolios G, Shapiro L, Wang R. Proteomic analysis of proteins associated with lipid droplets of basal and lipolytically stimulated 3 T3-L1 adipocytes. J Biol Chem. 2004;279(45):46835–46842. doi: 10.1074/jbc.M409340200. - DOI - PubMed
    1. Fujimoto Y, Itabe H, Sakai J, Makita M, Noda J, Mori M, Higashi Y, Kojima S, Takano T. Identification of major proteins in the lipid droplet-enriched fraction isolated from the human hepatocyte cell line HuH7. Biochim Biophys Acta. 2004;1644(1):47–59. doi: 10.1016/j.bbamcr.2003.10.018. - DOI - PubMed

Publication types