. 2015 Apr;29(4):1344-59.
doi: 10.1096/fj.14-265512. Epub 2014 Dec 9.

Acute-phase protein serum amyloid A3 is a novel paracrine coupling factor that controls bone homeostasis

Affiliations

Acute-phase protein serum amyloid A3 is a novel paracrine coupling factor that controls bone homeostasis

Roman Thaler et al. FASEB J. 2015 Apr.

Abstract

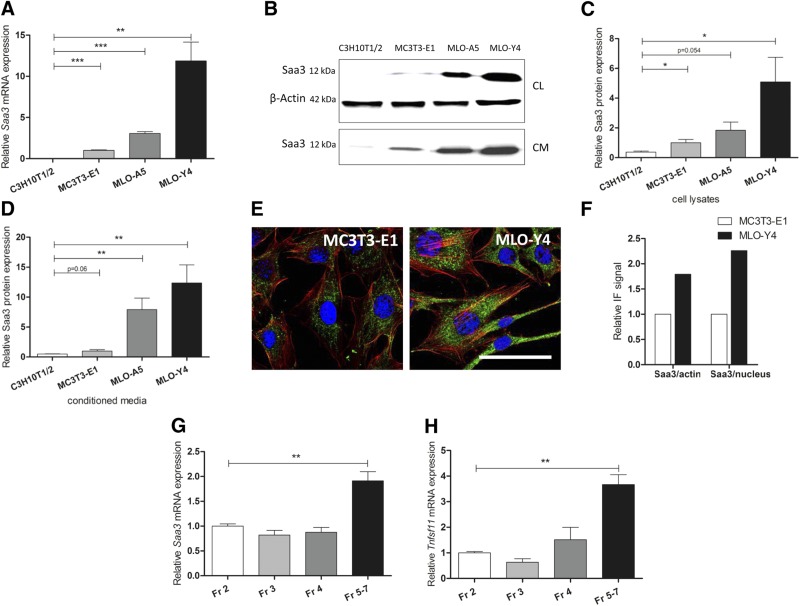
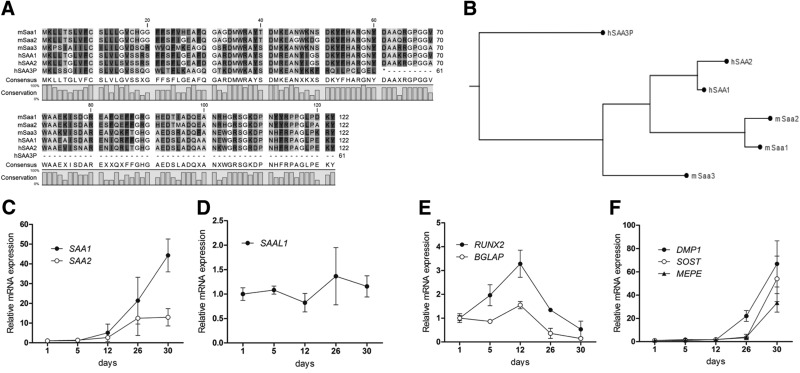
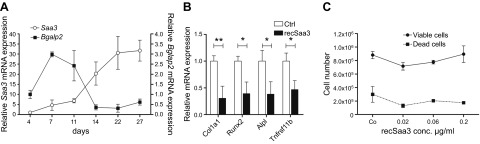
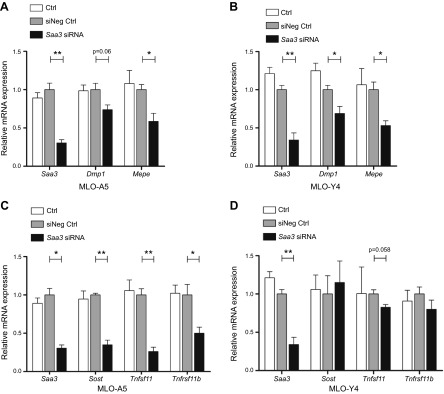
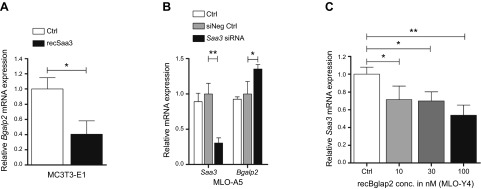
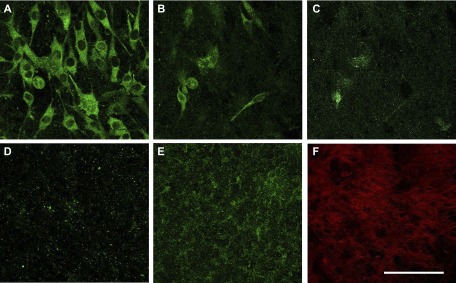
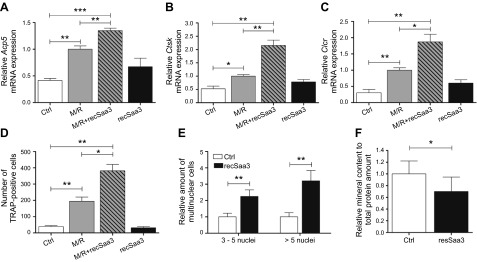
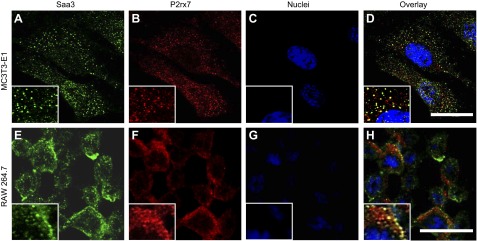
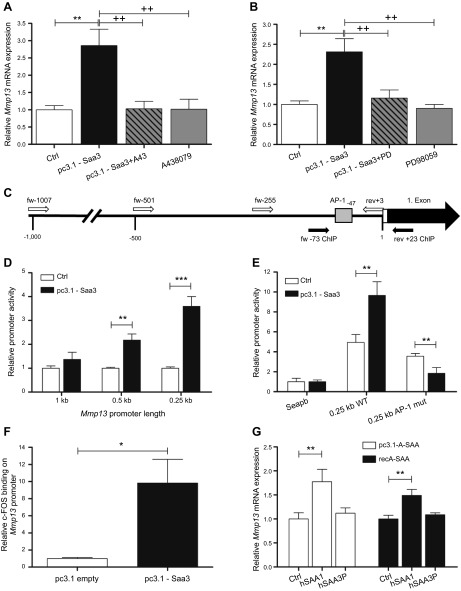
Serum amyloid A (A-SAA/Saa3) was shown before to affect osteoblastic metabolism. Here, using RT-quantitative PCR and/or immunoblotting, we show that expression of mouse Saa3 and human SAA1 and SAA2 positively correlates with increased cellular maturation toward the osteocyte phenotype. Expression is not detected in C3H10T1/2 embryonic fibroblasts but is successively higher in preosteoblastic MC3T3-E1 cells, late osteoblastic MLO-A5 cells, and MLO-Y4 osteocytes, consistent with findings using primary bone cells from newborn mouse calvaria. Recombinant Saa3 protein functionally inhibits osteoblast differentiation as reflected by reductions in the expression of osteoblast markers and decreased mineralization in newborn mouse calvaria. Yet, Saa3 protein enhances osteoclastogenesis in mouse macrophages/monocytes based on the number of multinucleated and tartrate-resistant alkaline phosphatase-positive cells and Calcr mRNA expression. Depletion of Saa3 in MLO osteocytes results in the loss of the mature osteocyte phenotype. Recombinant osteocalcin, which is reciprocally regulated with Saa3 at the osteoblast/osteocyte transition, attenuates Saa3 expression in MLO-Y4 osteocytes. Mechanistically, Saa3 produced by MLO-Y4 osteocytes is integrated into the extracellular matrix of MC3T3-E1 osteoblasts, where it associates with the P2 purinergic receptor P2rx7 to stimulate Mmp13 expression via the P2rx7/MAPK/ERK/activator protein 1 axis. Our data suggest that Saa3 may function as an important coupling factor in bone development and homeostasis.

Keywords: osteoblast; osteoclast; osteocyte; osteogenesis.


Figures

Figure 1.
Figure 1.
Mouse Saa3 is highly expressed in osteocytes. Expression pattern of Saa3 on mRNA level (A) and protein level (BD). Representative Saa3 immunoblots are shown for the cellular (CL, with β-actin as reference, upper blots) and the serum-free conditioned media (CM) fraction (related to media volume, lower blot) (B). Quantification is shown of the cellular lysate fraction (C) and of the conditioned media fraction (D). E) Comparison of Saa3 (green) levels by IF in MLO-Y4 cells and MC3T3-E1. Scale bar, 50 µm. F) Quantification of total Saa3 IF signal found in (E) referenced to total nuclear (blue) or to total F-Actin (red) IF signal. G) Saa3 RT-qPCR analysis of primary mouse osteoblasts [Fraction (Fr) 2–4] or late osteoblasts to early osteocytes (Fr 5–7) obtained by sequential digestion of long bones. H) The osteoblast-to-osteocyte differentiation pattern of the cellular fractions is supported by increasing Tnfsf11 mRNA levels in cell fractions Fr 5–7. 18S rRNA is a reference gene for RT-qPCR analysis; MC3T3-E1 is set to 1, and all other cell lines are referred to as fold change to MC3T3-E1. In (G) and (H), Fr 2 is set to 1; all other cell fractions are referred to as fold change to Fr 2. Values are represented as the mean ± sd; for all experiments n = 3. *P ≤ 0.05; **P ≤ 0.01; ***P ≤ 0.001.
Figure 2.
Figure 2.
Phylogenetic relations between mouse Saa3 and human SAA1 and SAA2. A) Mouse (m) as well as human (h) SAA1/SAA2 sequences show high homology with each other, and mouse Saa3 shows a high similarity to mouse and human SAA1/SAA2 after amino acid 30. In humans, the SAA3 gene is reported to be a pseudogene (SAA3P); a mutation/insertion at base 147 causes a frameshift generating a stop codon at position 61. B) Gene homology tree between human and mouse A-SAA proteins. C) In differentiating primary human osteoblasts, SAA1 and SAA2 mRNA expressions increase drastically after 26–30 d of culture. D) In contrast, SAAL1 expression remains unaffected during the whole differentiation process. E) The differentiation to mature osteoblasts is demonstrated by BGLAP and RUNX2 expressions reaching the maximum at d 12. The drop in BGLAP and RUNX2 expression is accompanied by increased levels of osteocyte markers DMP1, SOST, and MEPE (F). 18S rRNA is a reference gene for RT-qPCR analysis; d 1 is set to 1, and later time points are referred to as fold change relative to d 1. Values are represented as the mean ± sd; for all experiments n = 3.
Figure 3.
Figure 3.
Suppression of the osteoblastic phenotype by Saa3. Saa3 expression increases during osteoblast-to-osteocyte maturation and decreases the expression of genes of the maturing osteoblastic phenotype. A) Saa3 mRNA levels increase slowly but permanently during late osteoblast-to-osteocyte differentiation in MLO-A5 cells. Interestingly, only when Bglap2 decreases between d 11 and 14 do Saa3 mRNA levels reach their maximum. B) Treatment of 10-d-old osteogenic media-matured MC3T3-E1 osteoblasts with recSaa3 for a further 3 d significantly decreases the mRNA expression of the main osteoblast marker genes like Col1a1, Runx2, Alpl, and Tnfrsf11b. Ctrl, control. This treatment does not affect cell proliferation and viability of MC3T3-E1 cells (C). 18S rRNA is a reference gene for RT-qPCR analysis. In (A), d 4, and in (B), untreated controls are set to 1, and time points or treatments are referred to as fold change to d 4 or to control. Values are represented as the mean ± sd; for all experiments n = 3. *P ≤ 0.05; **P ≤ 0.01.
Figure 4.
Figure 4.
Saa3 retains the osteocyte phenotype in MLO-A5 and MLO-Y4 cells. Knockdown of Saa3 significantly decreases the expression of ECM mineralization-related osteocyte markers like Dmp1 and Mepe in MLO-A5 (A) and in MLO-Y4 (B) cells. C) In MLO-A5 cells, the loss of Saa3 expression (Saa3 expression is as in A) causes down-regulation of secreted factors like Sost, Tnfsf11, and Tnfrsf11b, which is not observed in MLO-Y4 cells (D). 18S rRNA is a reference gene for RT-qPCR analysis. Negative control (siNeg Ctrl) is set to 1, and control (Ctrl) or treated probes are referred to as fold change to siNeg Ctrl. Values are represented as the mean ± sd; for all experiments n = 3. *P ≤ 0.05; **P ≤ 0.01; ***P ≤ 0.001.
Figure 5.
Figure 5.
Reciprocal feedback regulation of Bglap2 and Saa3. A) Treatment of 10-d-old MC3T3-E1 matured osteoblasts with recSaa3 for a further 3 d significantly decreases the mRNA expression of the osteoblastic marker Bglap2. B) In MLO-A5 preosteocytes, knockdown of Saa3 expression (Saa3 expression is as in Fig. 4A, C) provokes a significant up-regulation of Bglap2 levels. C) In MLO-Y4 cells, Bglap2 treatment decreases Saa3 expression in a concentration (conc.)-dependent manner. 18S rRNA is a reference gene for RT-qPCR analysis. Control (Ctrl) or negative control (siNeg Ctrl) is set to 1, and control (Ctrl) or treated probes are referred to as fold change to Ctrl or siNeg Ctrl. Values are represented as the mean ± sd; for all experiments n = 3. *P ≤ 0.05; **P ≤ 0.01.
Figure 6.
Figure 6.
Saa3 interacts with osteoblastic ECM. MLO-Y4–derived Saa3 is deposited in ECM derived from MC3T3-E1 osteoblasts. A) Saa3 (green) in MLO-Y4 cells is attached on the top of the MC3T3-E1-derived, decellularized ECM. BD) Sequential Z stages of the ECM are shown; green dots represent Saa3 deposition. E) Overlay of the Z stages of the ECM section. F) ECM derived from MC3T3-E1 osteoblasts before MLO-Y4 reseeding as stained by Picro-Sirius Red. Scale bar, 50 µm.
Figure 7.
Figure 7.
Effect of Saa3 on maturation and activity of osteoclasts. Saa3 up-regulates osteoclast-specific genes, increases osteoclastic fusion, and triggers their bone-resorbing activity. Macrophage-like, preosteoclastic RAW264.7 cells treated with MCSF (30 ng/ml) and RANKL (10 ng/ml) for 3 d significantly up-regulate osteoclast marker genes: Acp5 (A), Ctsk (B), and Calcr (C). Remarkably, cotreatment with M/R and recSaa3 significantly further increases the expression of these osteoclast-specific genes (AC). Sole treatment with recSaa3 shows a tendency to increase the mRNA levels of Acp5, Ctsk, and Calcr (AC). D) Treatment of RAW264.7 cells with M/R for 10 d leads to TRAP-positive cells. Cotreatment of these cells with recSaa3 doubles the TRAP-positive osteoclast-like cells. E) Treatment of primary mouse monocytes/macrophages with M/R and with or without recSaa3 for 12 d. Combined treatment significantly increases the number of multinuclear cells, counting 3–5 nuclei per cell and counting over 5 nuclei per cell (E). Calvarial explants from 4- to 5-d-old mice were treated for 12 d with recSaa3, and mineral content was measured with Alizarin Red staining. A significantly decreased mineral content in recSaa3-treated samples is observed, suggesting increased osteoclastic activity in these samples (F). 18S rRNA is a reference gene for RT-qPCR analysis. Values are represented as the mean ± sd. M/R-treated cells are set to 1 in (A)–(C), and control (Ctrl) or treated probes are referred to as fold change to M/R. In (E) and (F), untreated control cells are set to 1, and recSaa3-treated cells/calvaria are referred to as fold change to Ctrl. For all graphs, n = 3 except for (F), n = 10. *P ≤ 0.05; **P ≤ 0.01; ***P ≤ 0.001.
Figure 8.
Figure 8.
Saa3 colocalizes with P2rx7 receptor. AD) Coimmunofluorescence of Saa3 (A) and P2rx7 (B) shows colocalization of both proteins (D) in MC3T3-E1 cells. Nuclei are depicted in (C). EH) A similar pattern is observed in RAW264.7 cells. Saa3 (E) as well as P2rx7 (F) are abundantly expressed in this cell line; overlay of both IF pictures shows the colocalization of both proteins (H). Nuclei are depicted in (G). Insets represent picture magnifications. Scale bars, 25 µm.
Figure 9.
Figure 9.
Pathway involved in Saa3-mediated Mmp13 up-regulation. In MC3T3-E1 cells, Saa3 up-regulates Mmp13 via P2rx7, MAPK/ERK, and c-FOS/AP-1. A) Forced expression of Saa3 (pc3.1-Saa3) in MC3T3-E1 cells increases Mmp13 expression after 3 d. However, inhibition of the P2rx7 receptor by A43 clearly blocks Mmp13 up-regulation in these cells. Treatment of MC3T3-E1 cells with A43 alone has no effect on Mmp13 expression. B) A very similar effect is seen when MC3T3-E1 cells overexpressing Saa3 are treated with the MAPK/ERK inhibitor PD. PD alone has no effect on Mmp13 expression. C) Schematic representation of Mmp13 promoter region. Large, black arrow shows the first exon, small white bar represents the 3′-UTR, and small open arrows show the start sites of the diverse promoter amplicons cloned into the SEAP2 reporter vector. Sequence between the small black arrows shows the promoter region analyzed to define c-FOS binding by ChIP assay. Small gray box defines selected putative AP-1 transcription binding site, as calculated with Genomatix software. fw, forward; rev, reverse. D) pc3.1-Saa3-dependent stimulation of pSEAP2-Mmp13 promoter fragments in transient transfected MC3T3-E1 cells after 4 d of Saa3 transfection as assessed by alkaline phosphatase reporter gene assay. E) Mutation of the AP-1 binding site at −47 bp upstream from the transcriptional start site in the 0.25 kb Mmp13 promoter construct fully depletes Mmp13 promoter activation by forced Saa3 expression. mut, mutant; WT, wild-type. F) ChIP analysis shows that forced expression of Saa3 for 3 d notably increases c-FOS binding on the selected proximal Mmp13 promoter region in MC3T3-E1 cells. G) Forced expression of human SAA1 (middle white bar) or treatment with human recSAA1 (middle black bar) significantly increases MMP13 mRNA levels in human osteoblast-like U2-OS cells. However, this effect is not seen after forced SAA3P expression (right white bar) or when treating with recSAA3P (right black bar). 18S rRNA is a reference gene for RT-qPCR analysis. Values are represented as the mean ± sd. Control cells (Ctrl) or cells transfected with empty pc3.1 vector (pc3.1 empty) are set to 1, and treated samples are referred to as fold change; for all experiments n = 3. *P ≤ 0.05; **P ≤ 0.01; ***P ≤ 0.001 vs. Co; ++P ≤ 0.01 vs. pc3.1-Saa3.

Similar articles

Cited by

References

    1. Li X., Cao X. (2006) BMP signaling and skeletogenesis. Ann. N. Y. Acad. Sci. 1068, 26–40 - PubMed
    1. Hadjidakis D. J., Androulakis I. I. (2006) Bone remodeling. Ann. N. Y. Acad. Sci. 1092, 385–396 - PubMed
    1. Kong Y. Y., Yoshida H., Sarosi I., Tan H. L., Timms E., Capparelli C., Morony S., Oliveira-dos-Santos A. J., Van G., Itie A., Khoo W., Wakeham A., Dunstan C. R., Lacey D. L., Mak T. W., Boyle W. J., Penninger J. M. (1999) OPGL is a key regulator of osteoclastogenesis, lymphocyte development and lymph-node organogenesis. Nature 397, 315–323 - PubMed
    1. Del Fattore A., Teti A., Rucci N. (2012) Bone cells and the mechanisms of bone remodelling. Front Biosci. (Elite Ed.) 4, 2302–2321 - PubMed
    1. Matsuoka K., Park K. A., Ito M., Ikeda K., Takeshita S. (2014) Osteoclast-derived complement component 3a stimulates osteoblast differentiation. J. Bone Miner. Res. 29, 1522–1530 - PubMed

Publication types

MeSH terms

LinkOut - more resources