. 2015 Feb 15;308(4):E283-93.
doi: 10.1152/ajpendo.00361.2014. Epub 2014 Dec 9.

GCN2 is required to increase fibroblast growth factor 21 and maintain hepatic triglyceride homeostasis during asparaginase treatment

Affiliations

GCN2 is required to increase fibroblast growth factor 21 and maintain hepatic triglyceride homeostasis during asparaginase treatment

Gabriel J Wilson et al. Am J Physiol Endocrinol Metab. .

Abstract

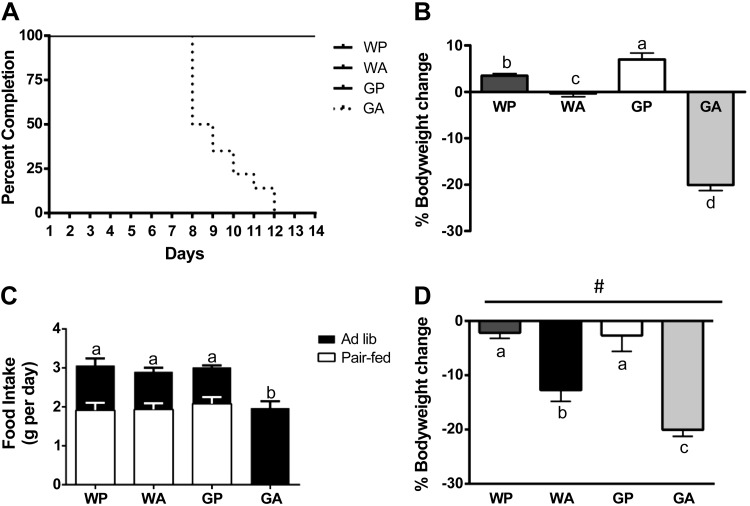
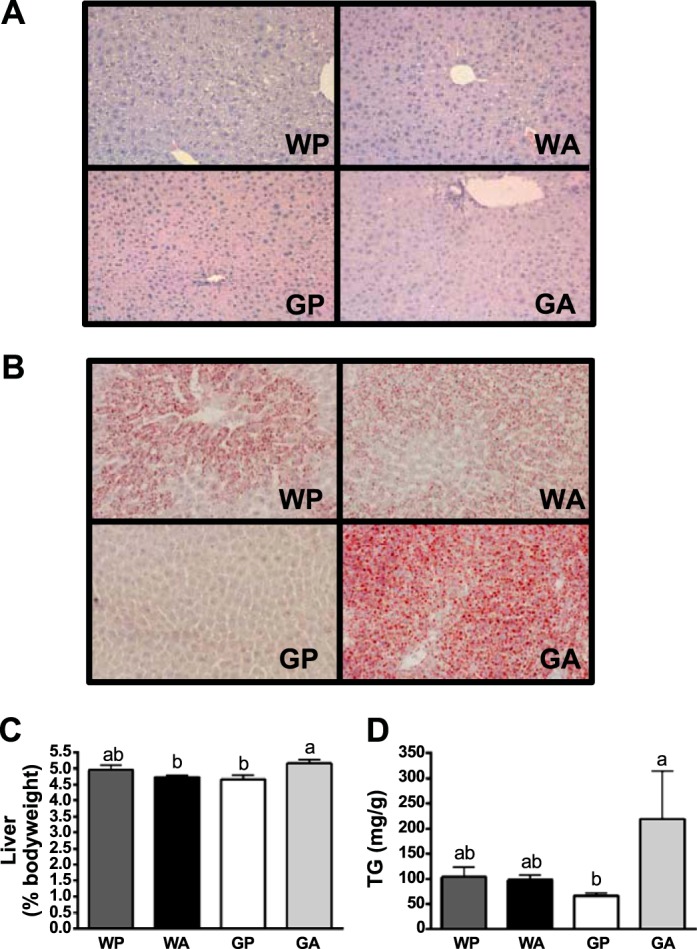
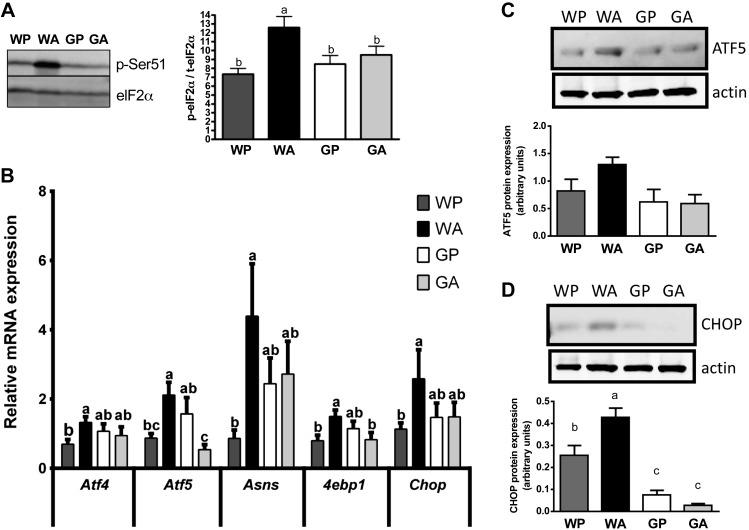
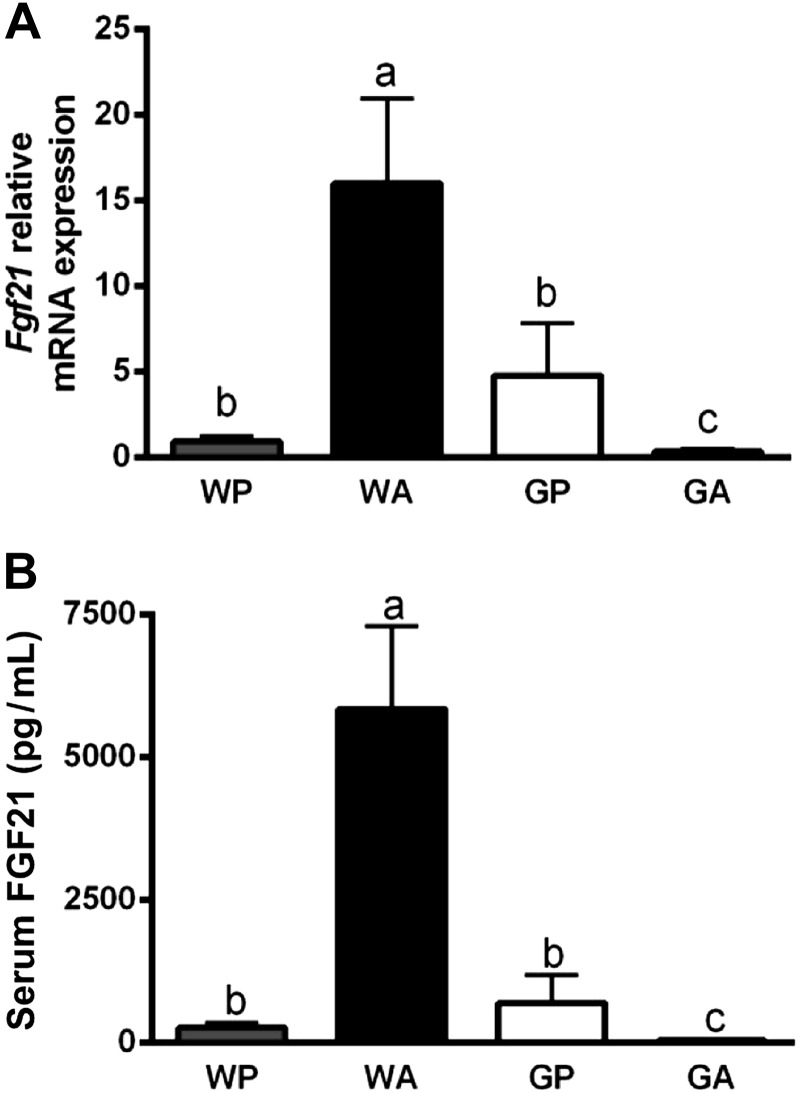
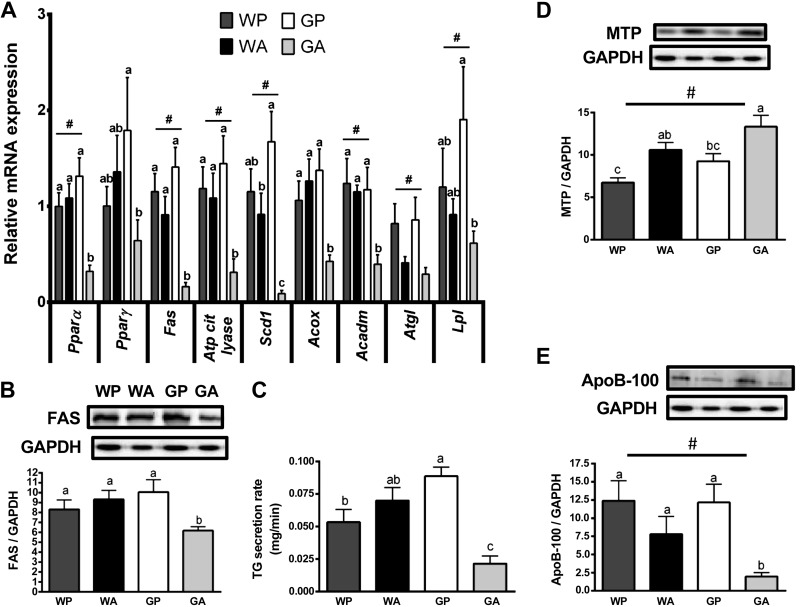
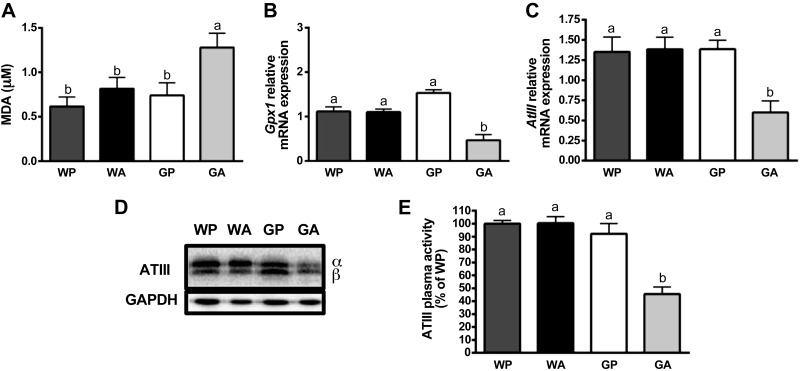
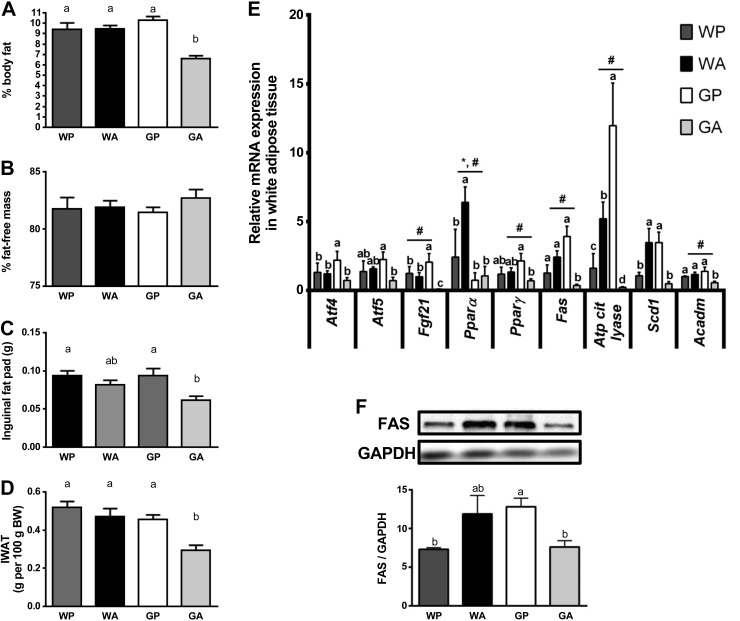
The antileukemic agent asparaginase triggers the amino acid response (AAR) in the liver by activating the eukaryotic initiation factor 2 (eIF2) kinase general control nonderepressible 2 (GCN2). To explore the mechanism by which AAR induction is necessary to mitigate hepatic lipid accumulation and prevent liver dysfunction during continued asparaginase treatment, wild-type and Gcn2 null mice were injected once daily with asparaginase or phosphate buffered saline for up to 14 days. Asparaginase induced mRNA expression of multiple AAR genes and greatly increased circulating concentrations of the metabolic hormone fibroblast growth factor 21 (FGF21) independent of food intake. Loss of Gcn2 precluded mRNA expression and circulating levels of FGF21 and blocked mRNA expression of multiple genes regulating lipid synthesis and metabolism including Fas, Ppara, Pparg, Acadm, and Scd1 in both liver and white adipose tissue. Furthermore, rates of triglyceride export and protein expression of apolipoproteinB-100 were significantly reduced in the livers of Gcn2 null mice treated with asparaginase, providing a mechanistic basis for the increase in hepatic lipid content. Loss of AAR-regulated antioxidant defenses in Gcn2 null livers was signified by reduced Gpx1 gene expression alongside increased lipid peroxidation. Substantial reductions in antithrombin III hepatic expression and activity in the blood of asparaginase-treated Gcn2 null mice indicated liver dysfunction. These results suggest that the ability of the liver to adapt to prolonged asparaginase treatment is influenced by GCN2-directed regulation of FGF21 and oxidative defenses, which, when lost, corresponds with maladaptive effects on lipid metabolism and hemostasis.

Keywords: adipose; amino acid response; antithrombin III; apolipoprotein B-100; eukaryotic initiation factor 2; fibroblast growth factor 21; general control nonderepressible 2; liver; mice; oxidative stress; steatosis.


Figures

Fig. 1.
Fig. 1.
General control nonderepressible 2 (Gcn2) null mice fail to adapt to prolonged asparaginase treatment. A: percentage of each experimental cohort (n = 8–12 per group at day 0) retained in the experiment over the 14-day treatment schedule. None of the GA mice completed the study due to significant loss in body weight coupled with behavioral morbidity. B: body weight change of mice injected with saline or asparaginase between days 0 and 14. C: average daily food intake of mice fed ad libitum for up to 14 days (black bars) or pair fed the same as amount as the GA group for 8 days (white bars). D: body weight change of pair-fed mice injected with saline or asparaginase between days 0 and 8. Values are means ± SE. #Main effect of asparaginase treatment to reduce body weight. Labeled means without a common letter differ (P < 0.05, drug × strain interaction effect). WP, wild-type mice given PBS; WA, wild-type mice injected with asparaginase; GP, Gcn2 null mice injected with PBS; GA, Gcn2 null mice injected with asparaginase.
Fig. 2.
Fig. 2.
Asparaginase treatment promotes lipid accumulation in liver of Gcn2 null mice. A: paraffin-embedded liver sections (6 μm) were stained with hematoxylin and eosin and images taken using a ×20 objective to visualize general cellular structure. B: neutral lipid content of liver was examined by Oil Red O stain and images captured using a ×20 objective. C: liver mass, expressed relative to body weight. D: liver triglyceride concentrations. Values are means ± SE; n = 5–8 per group. All mice were pair fed the same amount as the GA group. Labeled means without a common letter differ (P < 0.05, drug × strain interaction effect).
Fig. 3.
Fig. 3.
Activation of the amino acid response (AAR) pathway in liver by asparaginase requires GCN2. A: asparaginase increases eukaryotic initiation factor 2 (eIF2) phosphorylation in wild-type but not Gcn2 null mice. Data are expressed as band density of serine 51 phosphorylated eIF2 relative to total expression levels of eIF2 alpha subunit by immunoblot analysis. B: quantitative real-time PCR was employed to examine mRNA expression of Atf4, Atf5, Asns, 4ebp1, and Chop. C and D: asparaginase increases protein expression of activating transcription factor 5 (ATF5) and CAAT enhancer binding protein homologous protein (CHOP) in the liver of wild-type but not Gcn2 null mice by immunoblot analysis. All mice were pair fed the same amount as the GA group. Values are means ± SE; n = 5–8 per group except in C and D, which was n = 3–5 per group. Labeled means without a common letter differ (P < 0.05, drug × strain interaction effect).
Fig. 4.
Fig. 4.
Induction of fibroblast growth factor 21 (FGF21) by asparaginase requires GCN2. A: hepatic Fgf21 mRNA expression was determined by quantitative real-time PCR. B: FGF21 protein concentration in serum analyzed by enzyme-linked immunoassay. All mice were pair fed the same amount as the GA group. Values are means ± SE; n = 5–8 per group. Labeled means without a common letter differ (P < 0.05, drug × strain interaction effect).
Fig. 5.
Fig. 5.
Hepatic triglyceride metabolism and lipid secretion are impaired in Gcn2 null mice administered asparaginase. A: quantitative real-time PCR was employed to examine mRNA expression of Pparα, Pparγ, Fas, Atp citrate lyase, Scd1, Acox, Acadm, Atgl, and Lpl. B: expression of fatty acid synthase (FAS) protein relative to GAPDH was analyzed by immunoblot. C: mice were injected with tyloxapol to inhibit breakdown of triglycerides (TG) in plasma. The rate of appearance of blood TG during this blockade was measured to determine TG secretion from liver. D: protein expression of microsomal triglyceride transfer protein (MTP) relative to GAPDH was analyzed by immunoblot. E: protein expression of apolipoprotein B-100 (ApoB-100) relative to GAPDH was analyzed by immunoblot. Values are means ± SE; n = 5–8 per group. #Main effect of treatment. Labeled means without a common letter differ (P < 0.05, drug × strain interaction effect).
Fig. 6.
Fig. 6.
Loss of AAR promotes oxidative stress and evidence of developing coagulopathy in liver during asparaginase. A: thiobarbituric acid reactive substances assay (TBARS) was performed to test for lipid perodixation in mice livers. Thiobarbituric acid reacts with malondialdehyde (MDA), a by-product of lipid peroxidation, to yield a wavelength at 532 nm that was detected by spectrophotometry analysis. B: quantitative real-time PCR was employed to examine relative mRNA expression of Gpx1. C: quantitative real-time PCR was employed to measure mRNA expression of anti-thrombin III (AtIII). D: levels of ATIII protein at the alpha and beta subunits were measured by immunoblot analysis. Results shown beneath the representative immunoblot are expressed as the density of ATIII relative to GAPDH. E: results show the anti-FXa activity of ATIII in plasma as percentage of WP. All mice were pair fed the same amount as the GA group. Values are means ± SE; n = 5–8 per group. Labeled means without a common letter differ (P < 0.05, drug × strain interaction effect).
Fig. 7.
Fig. 7.
Gcn2 null mice given asparaginase have reduced body fat. Percent body fat (A) and percent fat-free mass (B) were determined by EchoMRI. C: inguinal fat pads of mice (grams) were weighed after necropsy. D: inguinal fat pad weight expressed relative to body weight. E: quantitative real-time PCR was employed to examine relative mRNA expression of Atf4, Atf5, Fgf21, Pparα, Pparγ, Fas, Atp citrate lyase, Sdcd1, and Acadm. F: levels of FAS were measured by immunoblot analysis. Results shown beneath the representative immunoblot are expressed as the density of FAS relative to total levels of GAPDH control. All mice were pair fed the same amount as the GA group. Values are means ± SE; n = 5–8 per group. #Main effect of treatment. *Main effect of strain. Labeled means without a common letter differ (P < 0.05, drug × strain interaction effect).

References

    1. Ai D, Baez JM, Jiang H, Conlon DM, Hernandez-Ono A, Frank-Kamenetsky M, Milstein S, Fitzgerald K, Murphy AJ, Woo CW, Strong A, Ginsberg HN, Tabas I, Rader DJ, Tall AR. Activation of ER stress and mTORC1 suppresses hepatic sortilin-1 levels in obese mice. J Clin Invest 122: 1677–1687, 2012. - PMC - PubMed
    1. Anthony TG, McDaniel BJ, Byerley RL, McGrath BC, Cavener DR, McNurlan MA, Wek RC. Preservation of liver protein synthesis during dietary leucine deprivation occurs at the expense of skeletal muscle mass in mice deleted for eIF2 kinase GCN2. J Biol Chem 279: 36553–36561, 2004. - PubMed
    1. Arriazu E, Perez de Obanos MP, Lopez-Zabalza MJ, Herraiz MT, Iraburu MJ. Amino acid deprivation decreases intracellular levels of reactive oxygen species in hepatic stellate cells. Cell Physiol Biochem 26: 281–290, 2010. - PubMed
    1. B'Chir W, Maurin AC, Carraro V, Averous J, Jousse C, Muranishi Y, Parry L, Stepien G, Fafournoux P, Bruhat A. The eIF2alpha/ATF4 pathway is essential for stress-induced autophagy gene expression. Nucleic Acids Res 41: 7683–7699, 2013. - PMC - PubMed
    1. Back SH, Scheuner D, Han J, Song B, Ribick M, Wang J, Gildersleeve RD, Pennathur S, Kaufman RJ. Translation attenuation through eIF2alpha phosphorylation prevents oxidative stress and maintains the differentiated state in beta cells. Cell Metab 10: 13–26, 2009. - PMC - PubMed

Publication types

MeSH terms