

Genome-wide identification of mitogen-activated protein kinase gene family in Gossypium raimondii and the function of their corresponding orthologs in tetraploid cultivated cotton
- PMID: 25492847
- PMCID: PMC4270029
- DOI: 10.1186/s12870-014-0345-9
Genome-wide identification of mitogen-activated protein kinase gene family in Gossypium raimondii and the function of their corresponding orthologs in tetraploid cultivated cotton
Abstract
Background: Mitogen-activated protein kinase (MAPK) cascades play a crucial role in plant growth and development as well as biotic and abiotic stress responses. Knowledge about the MAPK gene family in cotton is limited, and systematic investigation of MAPK family proteins has not been reported.
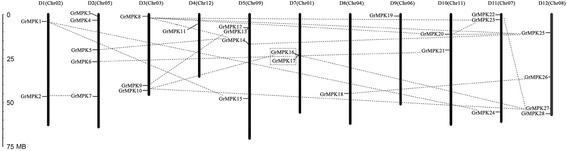
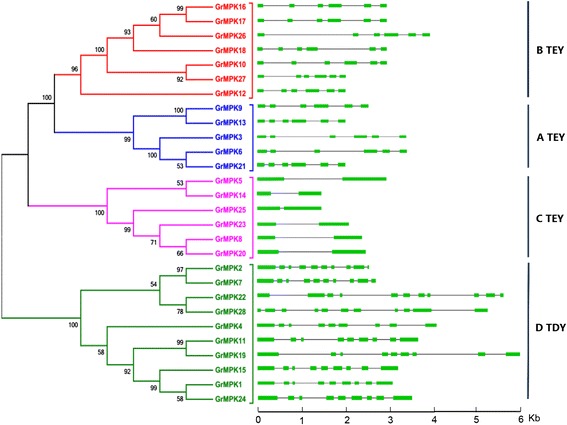
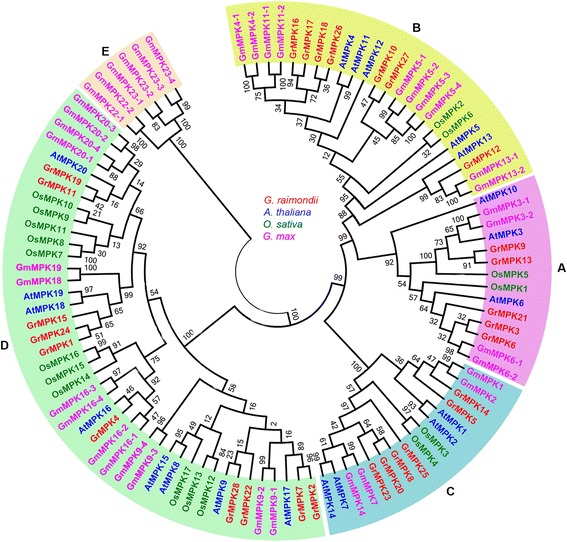
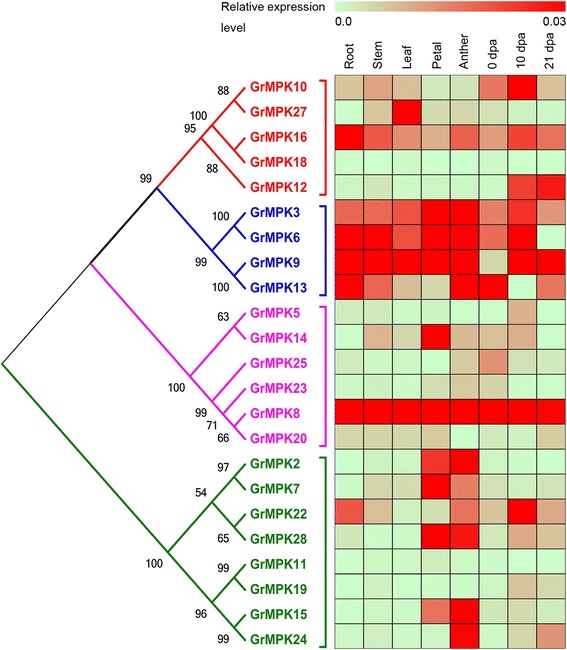
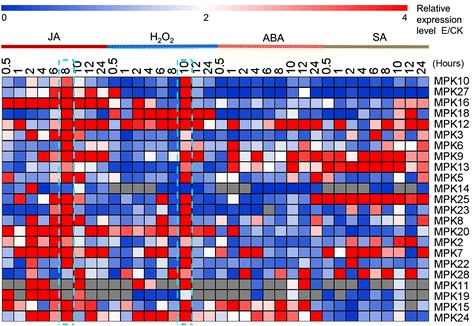
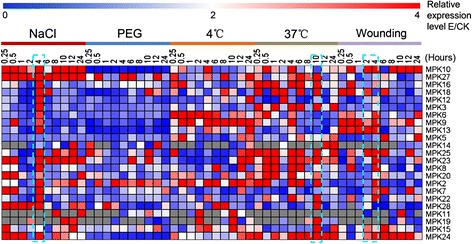
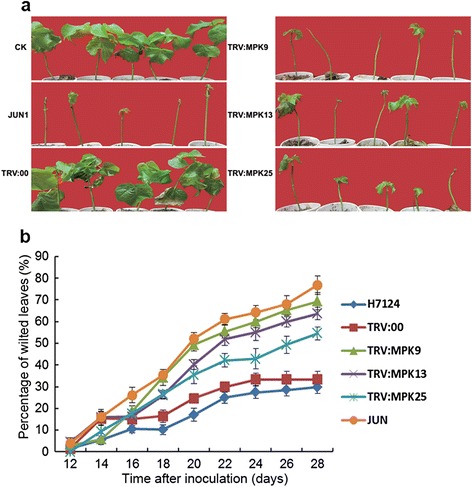
Results: By performing a bioinformatics homology search, we identified 28 putative MAPK genes in the Gossypium raimondii genome. These MAPK members were anchored onto 11 chromosomes in G. raimondii, with uneven distribution. Phylogenetic analysis showed that the MAPK candidates could be classified into the four known A, B, C and D groups, with more MAPKs containing the TEY phosphorylation site (18 members) than the TDY motif (10 members). Furthermore, 21 cDNA sequences of MAPKs with complete open reading frames (ORFs) were identified in G. hirsutum via PCR-based approaches, including 13 novel MAPKs and eight with homologs reported previously in tetraploid cotton. The expression patterns of 23 MAPK genes reveal their important roles in diverse functions in cotton, in both various developmental stages of vegetative and reproductive growth and in the stress response. Using a reverse genetics approach based on tobacco rattle virus-induced gene silencing (TRV-VIGS), we further verified that MPK9, MPK13 and MPK25 confer resistance to defoliating isolates of Verticillium dahliae in cotton. Silencing of MPK9, MPK13 and MPK25 can significantly enhance cotton susceptibility to this pathogen.
Conclusions: This study presents a comprehensive identification of 28 mitogen-activated protein kinase genes in G. raimondii. Their phylogenetic relationships, transcript expression patterns and responses to various stressors were verified. This study provides the first systematic analysis of MAPKs in cotton, improving our understanding of defense responses in general and laying the foundation for future crop improvement using MAPKs.
Figures


Similar articles
-
Integration analysis of MKK and MAPK family members highlights potential MAPK signaling modules in cotton.Sci Rep. 2016 Jul 15;6:29781. doi: 10.1038/srep29781. Sci Rep. 2016. PMID: 27417377 Free PMC article.
-
Genome-wide cloning, identification, classification and functional analysis of cotton heat shock transcription factors in cotton (Gossypium hirsutum).BMC Genomics. 2014 Nov 6;15(1):961. doi: 10.1186/1471-2164-15-961. BMC Genomics. 2014. PMID: 25378022 Free PMC article.
-
Genome-wide identification and characterization of SnRK2 gene family in cotton (Gossypium hirsutum L.).BMC Genet. 2017 Jun 12;18(1):54. doi: 10.1186/s12863-017-0517-3. BMC Genet. 2017. PMID: 28606097 Free PMC article.
-
GhMPK7, a novel multiple stress-responsive cotton group C MAPK gene, has a role in broad spectrum disease resistance and plant development.Plant Mol Biol. 2010 Sep;74(1-2):1-17. doi: 10.1007/s11103-010-9661-0. Epub 2010 Jul 3. Plant Mol Biol. 2010. PMID: 20602149 Review.
-
Genome-wide expression analysis of phospholipase A1 (PLA1) gene family suggests phospholipase A1-32 gene responding to abiotic stresses in cotton.Int J Biol Macromol. 2021 Dec 1;192:1058-1074. doi: 10.1016/j.ijbiomac.2021.10.038. Epub 2021 Oct 14. Int J Biol Macromol. 2021. PMID: 34656543 Review.
Cited by
-
Genome-wide identification of the BASS gene family in four Gossypium species and functional characterization of GhBASSs against salt stress.Sci Rep. 2021 May 31;11(1):11342. doi: 10.1038/s41598-021-90740-3. Sci Rep. 2021. PMID: 34059742 Free PMC article.
-
Gbvdr6, a Gene Encoding a Receptor-Like Protein of Cotton (Gossypium barbadense), Confers Resistance to Verticillium Wilt in Arabidopsis and Upland Cotton.Front Plant Sci. 2018 Jan 17;8:2272. doi: 10.3389/fpls.2017.02272. eCollection 2017. Front Plant Sci. 2018. PMID: 29387078 Free PMC article.
-
Comprehensive analysis of mitogen-activated protein kinase cascades in chrysanthemum.PeerJ. 2018 Jun 19;6:e5037. doi: 10.7717/peerj.5037. eCollection 2018. PeerJ. 2018. PMID: 29942696 Free PMC article.
-
MAP Kinase PrMPK9-1 Contributes to the Self-Incompatibility Response.Plant Physiol. 2017 Jun;174(2):1226-1237. doi: 10.1104/pp.17.00213. Epub 2017 Apr 6. Plant Physiol. 2017. PMID: 28385731 Free PMC article.
-
Drought coping strategies in cotton: increased crop per drop.Plant Biotechnol J. 2017 Mar;15(3):271-284. doi: 10.1111/pbi.12688. Plant Biotechnol J. 2017. PMID: 28055133 Free PMC article. Review.
References
Publication types
MeSH terms
Substances
LinkOut - more resources
Full Text Sources
Other Literature Sources
