

Change in walking for transport: a longitudinal study of the influence of neighbourhood disadvantage and individual-level socioeconomic position in mid-aged adults
- PMID: 25492854
- PMCID: PMC4279959
- DOI: 10.1186/s12966-014-0151-7
Change in walking for transport: a longitudinal study of the influence of neighbourhood disadvantage and individual-level socioeconomic position in mid-aged adults
Abstract
Background: Unlike leisure time physical activity, knowledge of the socioeconomic determinants of active transport is limited, research on this topic has produced mixed and inconsistent findings, and it remains unknown if peoples' engagement in active transport declines as they age. This longitudinal study examined relationships between neighbourhood disadvantage, individual-level socioeconomic position and walking for transport (WfT) during mid- and early old-age (40 - 70 years). Three questions were addressed: (i) which socioeconomic groups walk for transport, (ii) does the amount of walking change over time as people age, and (iii) is the change socioeconomically patterned?
Methods: The data come from the HABITAT study of physical activity, a bi-annual multilevel longitudinal survey of 11,036 residents of 200 neighbourhoods in Brisbane, Australia. At each wave (2007, 2009 and 2011) respondents estimated the duration (minutes) of WfT in the previous 7 days. Neighbourhood disadvantage was measured using a census-derived index comprising 17 different socioeconomic components, and individual-level socioeconomic position was measured using education, occupation, and household income. The data were analysed using multilevel mixed-effects logistic and linear regression.
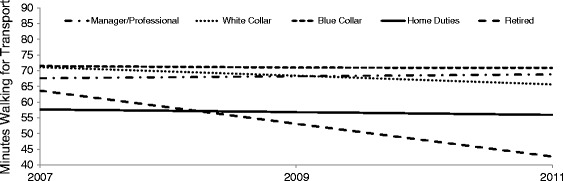
Results: The odds of being defined as a 'never walker' were significantly lower for residents of disadvantaged neighbourhoods, but significantly higher for the less educated, blue collar employees, and members of lower income households. WfT declined significantly over time as people aged and the declines were more precipitous for older persons. Average minutes of WfT declined for all neighbourhoods and most socioeconomic groups; however, the declines were steeper for the retired and members of low income households.
Conclusions: Designing age-friendly neighbourhoods might slow or delay age-related declines in WfT and should be a priority. Steeper declines in WfT among residents of low income households may reflect their poorer health status and the impact of adverse socioeconomic exposures over the life course. Each of these declines represents a significant challenge to public health advocates, urban designers, and planners in their attempts to keep people active and healthy in their later years of life.
Figures


Similar articles
-
Associations between individual socioeconomic position, neighbourhood disadvantage and transport mode: baseline results from the HABITAT multilevel study.J Epidemiol Community Health. 2015 Dec;69(12):1217-23. doi: 10.1136/jech-2015-205620. Epub 2015 Aug 4. J Epidemiol Community Health. 2015. PMID: 26243197
-
Longitudinal associations between residential density and body mass index: the mediating role of walking for transport and the moderating effect of neighbourhood disadvantage.J Epidemiol Community Health. 2025 Aug 8;79(9):704-711. doi: 10.1136/jech-2024-223095. J Epidemiol Community Health. 2025. PMID: 40132868
-
Can the built environment reduce health inequalities? A study of neighbourhood socioeconomic disadvantage and walking for transport.Health Place. 2013 Jan;19:89-98. doi: 10.1016/j.healthplace.2012.10.008. Epub 2012 Nov 10. Health Place. 2013. PMID: 23207291
-
Do places affect the probability of death in Australia? A multilevel study of area-level disadvantage, individual-level socioeconomic position and all-cause mortality, 1998-2000.J Epidemiol Community Health. 2007 Jan;61(1):13-9. doi: 10.1136/jech.2006.046094. J Epidemiol Community Health. 2007. PMID: 17183009 Free PMC article. Review.
-
Neighbourhood Socioeconomic Processes and Dynamics and Healthy Ageing: A Scoping Review.Int J Environ Res Public Health. 2022 May 31;19(11):6745. doi: 10.3390/ijerph19116745. Int J Environ Res Public Health. 2022. PMID: 35682327 Free PMC article.
Cited by
-
Gender and age differences in walking for transport and recreation: Are the relationships the same in all neighborhoods?Prev Med Rep. 2016 May 16;4:75-80. doi: 10.1016/j.pmedr.2016.05.001. eCollection 2016 Dec. Prev Med Rep. 2016. PMID: 27413664 Free PMC article.
-
A Longitudinal Study Examining Changes in Street Connectivity, Land Use, and Density of Dwellings and Walking for Transport in Brisbane, Australia.Environ Health Perspect. 2018 May 3;126(5):057003. doi: 10.1289/EHP2080. Environ Health Perspect. 2018. PMID: 29729661 Free PMC article.
-
The Impact of Retirement on Cardiovascular Disease and Its Risk Factors: A Systematic Review of Longitudinal Studies.Gerontologist. 2020 Jul 15;60(5):e367-e377. doi: 10.1093/geront/gnz062. Gerontologist. 2020. PMID: 31091304 Free PMC article.
-
Influence of socioeconomic status on changes in body size and physical activity in ageing black South African women.Eur Rev Aging Phys Act. 2018 Apr 26;15:6. doi: 10.1186/s11556-018-0196-8. eCollection 2018. Eur Rev Aging Phys Act. 2018. PMID: 29725487 Free PMC article.
-
The effectiveness of a proven chronic disease prevention and screening intervention in diverse and remote primary care settings: an implementation study on the BETTER 2 Program.BJGP Open. 2019 Oct 29;3(3):bjgpopen19X101656. doi: 10.3399/bjgpopen19X101656. Print 2019 Oct. BJGP Open. 2019. PMID: 31581121 Free PMC article.
References
Publication types
MeSH terms
LinkOut - more resources
Full Text Sources
Other Literature Sources
