. 2015 Feb;21(2):213-29.
doi: 10.1261/rna.048009.114. Epub 2014 Dec 9.

Splicing of designer exons informs a biophysical model for exon definition

Affiliations

Splicing of designer exons informs a biophysical model for exon definition

Mauricio A Arias et al. RNA. 2015 Feb.

Abstract

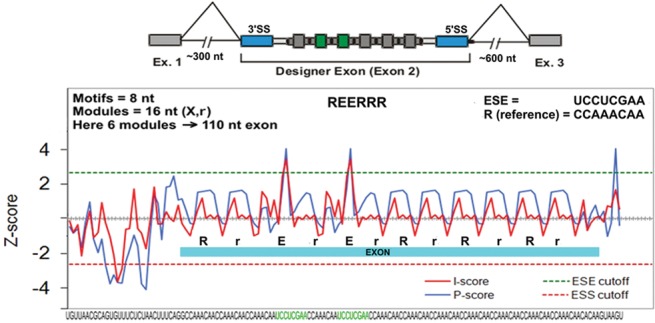
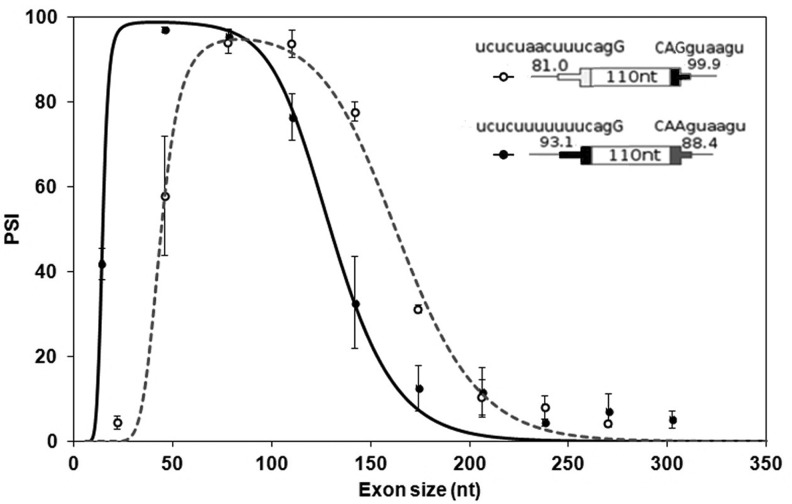
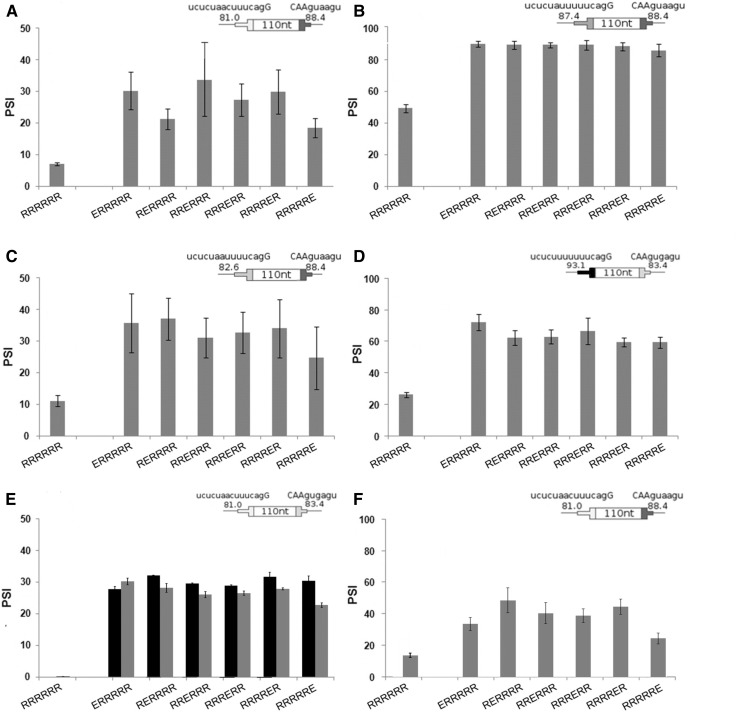
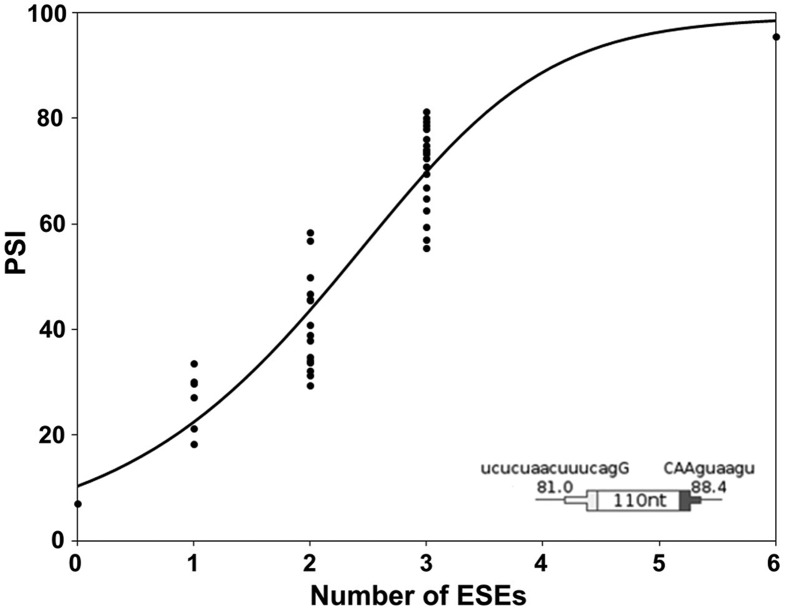
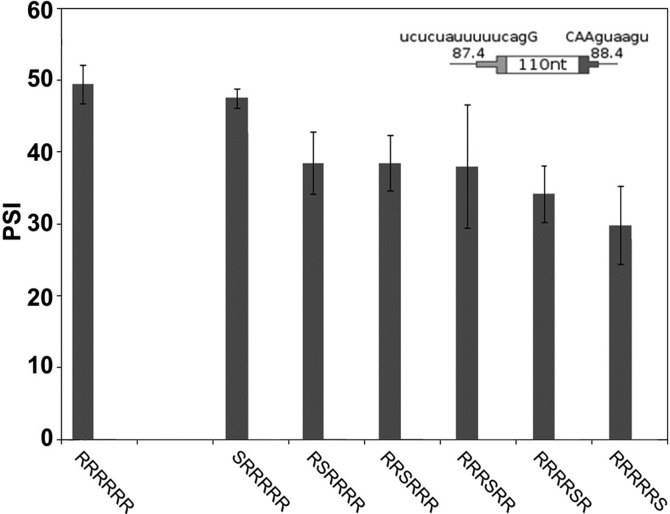
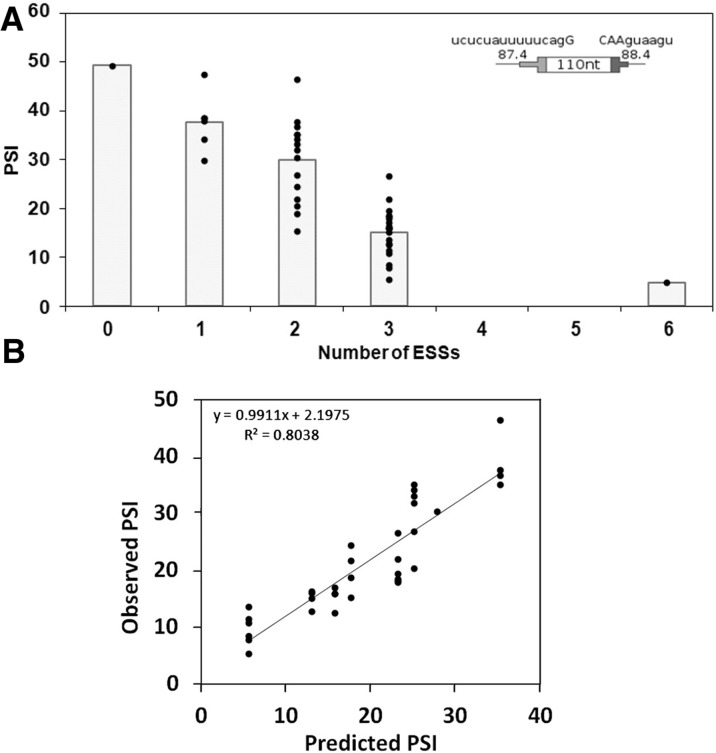
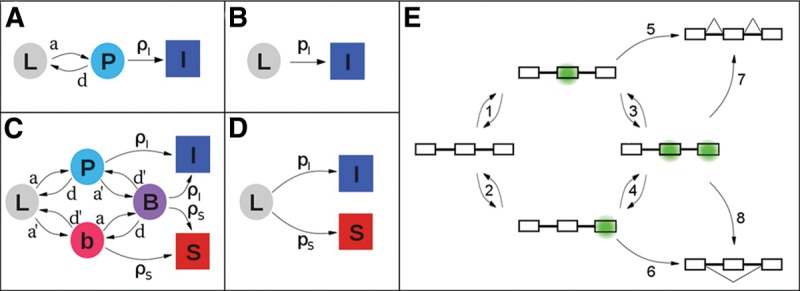
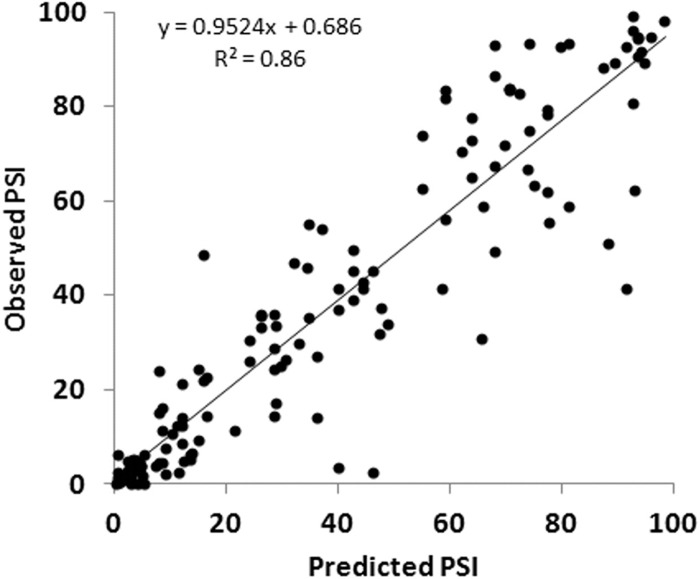
Pre-mRNA molecules in humans contain mostly short internal exons flanked by longer introns. To explain the removal of such introns, exon recognition instead of intron recognition has been proposed. We studied this exon definition using designer exons (DEs) made up of three prototype modules of our own design: an exonic splicing enhancer (ESE), an exonic splicing silencer (ESS), and a Reference Sequence (R) predicted to be neither. Each DE was examined as the central exon in a three-exon minigene. DEs made of R modules showed a sharp size dependence, with exons shorter than 14 nt and longer than 174 nt splicing poorly. Changing the strengths of the splice sites improved longer exon splicing but worsened shorter exon splicing, effectively displacing the curve to the right. For the ESE we found, unexpectedly, that its enhancement efficiency was independent of its position within the exon. For the ESS we found a step-wise positional increase in its effects; it was most effective at the 3' end of the exon. To apply these results quantitatively, we developed a biophysical model for exon definition of internal exons undergoing cotranscriptional splicing. This model features commitment to inclusion before the downstream exon is synthesized and competition between skipping and inclusion fates afterward. Collision of both exon ends to form an exon definition complex was incorporated to account for the effect of size; ESE/ESS effects were modeled on the basis of stabilization/destabilization. This model accurately predicted the outcome of independent experiments on more complex DEs that combined ESEs and ESSs.

Keywords: biophysical model; designer exons; exon definition; pre-mRNA splicing.


Figures

FIGURE 1.
FIGURE 1.
Construction of designer exons (example). From the bottom: the RNA sequence with two 8-nt ESE motifs in green. Above that is a plot of the computationally predicted enhancer/silencer strengths of each overlapping eight-mer using two different criteria: red or blue (Zhang and Chasin 2004). The dashed lines indicate cutoffs used for classifying a sequence as an ESE (green) or ESS (red). The exon is indicated by a blue bar, where E refers to the ESE motif and R or r refers to the reference motif, with the lower case indicating its use as a spacer. At the top of the graph is an abbreviated version of the motif composition in which the spacer r motifs have been omitted. Finally, at the top of the panel is a cartoon showing the overall structure of a minigene containing a DE, with the splice sites in blue and the ESE motifs in green.
FIGURE 2.
FIGURE 2.
Exon inclusion has an optimum size range. Inclusion levels (psi) of DEs in transient transfections. DEs consist of Reference Sequences and have either a strong 3′SS (filled symbols) or a strong 5′SS (open symbols). The splice site sequences and consensus scores are shown. See Supplemental Figure S2 for inclusion levels of DEs in a chromosomal context. Error bars: SEM, n ≥ 3. The curves were generated by a model developed in the last section of the text.
FIGURE 3.
FIGURE 3.
Addition of a single ESE enhances inclusion level and is position independent. (AF) Enhancement as a function of ESE position in four different splice site contexts. The cartoons show the consensus values for splice site sets used (Table 1). (A) SS Set 7; (B) SS Set 5; (C) SS Set 6; (D) SS Set 4. Error bars: SEM, n ≥ 3 except C, where n = 2. In all cases the psi of DEs with an ESE are significantly different from that without ESEs (t-test, P < 0.01), except for the right most position in C (P = 0.05). None of the 90 pairwise comparisons between ESEs at different positions showed significant differences (t-test, P > 0.05). See Supplemental Figure S3 for inclusion levels of DEs in a chromosomal context. (E) ESEs corresponding to SRSF1 (black columns) and SRSF7 (gray columns) binding sites in a DE with SS Set 8. (F) An ESE corresponding to an SRSF2 binding site in a DE with SS Set 7.
FIGURE 4.
FIGURE 4.
Inclusion levels of DEs increase with the number of ESEs present. The psi for all possible DE permutations with 0, 1, 2, 3, or 6 ESEs was measured (n ≥ 3). SS Set 7 was used. The curve was generated by a model developed in the last section of the text.
FIGURE 5.
FIGURE 5.
Addition of a single ESS decreases inclusion level and shows some position dependence. The psi for DEs with a single ESS are shown for transient transfections. SS Set 5 was used. Error bars: SEM, n ≥ 3. An ESS at positions 2, 3, 5, or 6 reduced the psi significantly compared with no ESS (P ≤ 0.03). There was no effect at position 1 and variability at position 4 did not allow a conclusion. The cartoon shows the consensus values for splice sites used. See Supplemental Figure S4 for inclusion levels of DEs in a chromosomal context.
FIGURE 6.
FIGURE 6.
Inclusion levels of DEs decrease with the number of ESSs present. (A) The psi for all possible permutations with 0, 1, 2, 3, or 6 ESSs were measured (n ≥ 3). SS Set 5 was used. The columns depict the average. Note that the data here are summarized using a column chart rather than a curve such as was used in Figure 4 for the ESEs. That curve was generated by a model that assumes position independence (see below), which is not the case for the ESSs. (B) The psi for all possible permutations with two and three ESSs were plotted against predictions based on the addition of the individual position effects of each ESS as measured in the single-ESS experiments (Fig. 5).
FIGURE 7.
FIGURE 7.
Complex kinetics can be described in simpler terms. The squares and circles represent different states of a pre-mRNA molecule: (L) “naked” transcript; (P) exon of interest in an exon definition complex (EDC) with the downstream exon either not present or present but not in an EDC; (b) downstream exon in an EDC with the exon of interest not in an EDC; (B) both exons in EDCs; (I) (inclusion) and (S) (skipping) represent molecules that have either committed to or achieved their respective splicing outcomes. The arrows represent transitions between states, and are labeled with rate constants: (a) and (d) association and dissociation, respectively, of the complex on the exon of interest; (a′) and (d′) the same for the downstream exon; (ρI) and (ρS) commitment to inclusion and skipping, respectively, of the exon of interest. (A) Model for the splicing reactions before time τ. Importantly, the transition from P to I is independent of the presence of exon 3. (B) Simplified model before time τ; pI amalgamates a, d, and ρI. (C) Model for the splicing reactions after time τ. (D) Model after time τ simplified analogously to B. pS amalgamates a′, d′, and ρS. See Supplemental Material for details. (E) Cartoon showing the states implied in C for a pre-mRNA molecule depicting EDCs (green). Steps 1–4 represent the formation or loss of EDCs; Steps 5–8 represent commitments to the splicing outcome shown.
FIGURE 8.
FIGURE 8.
The model accurately predicts the inclusion levels of DEs. Observed psi values are those previously reported for more complex DEs harboring combinations of ESEs and ESSs and being of varying lengths (Zhang et al. 2009). These 142 measurements represent an untouched data set not used for building the model. Psi values were predicted using the composition of the exons and Equations 6 and 7. Constants used were those derived from the single parameter experiments described here (Table 3).
FIGURE 9.
FIGURE 9.
A model for exon end-to-end contact in exon definition. (A) Communication between the two ends of the exon is mediated by protein–protein interaction (half-circles). The line represents the pre-mRNA, with the thick black section being the exon, the thin black sections being the intronic flanks, and the 5′SS indicated by the curly brace. A 55 nt exon is accommodated by protein factors binding to the ends of the exon (e.g., U2AF65 and U1 snRNP). SS Set 3 is being used. The distance between the emerging ends of the RNA molecule (arrows), designated the fitting distance (yi), was used to obtain an equation for the rate of formation of this complex. (B) A different splice site sequence (SS Set 2) could change the point and angle at which the pre-mRNA extends from a binding protein such that the fitting distance (yi) is increased compared with SS Set 3. The 55 nt exon can accommodate this difference. (C) Same as A but with a shorter 20 nt exon. The short fitting distance of SS Set 3 still allows coupling of the protein factors. (D) Same as B but showing that the long fitting distance of SS Set 2 precludes coupling of the two protein factors when the exon is only 20 nt long.

References

    1. Berget SM 1995. Exon recognition in vertebrate splicing. J Biol Chem 270:2411–2414. - PubMed
    1. Black DL 1991. Does steric interference between splice sites block the splicing of a short c-src neuron-specific exon in non-neuronal cells? Genes Dev 5:389–402. - PubMed
    1. Black DL 1995. Finding splice sites within a wilderness of RNA. RNA 1:763–771. - PMC - PubMed
    1. Black DL 2003. Mechanisms of alternative pre-messenger RNA splicing. Annu Rev Biochem 72:291–336. - PubMed
    1. Blencowe BJ 2000. Exonic splicing enhancers: mechanism of action, diversity and role in human genetic diseases. Trends Biochem Sci 25:106–110. - PubMed

Publication types

Substances

LinkOut - more resources