. 2014 Jun:78:63-139.
doi: 10.1016/j.simyco.2014.07.002.

Aspergillus, Penicillium and Talaromyces isolated from house dust samples collected around the world

Affiliations

Aspergillus, Penicillium and Talaromyces isolated from house dust samples collected around the world

C M Visagie et al. Stud Mycol. 2014 Jun.

Abstract

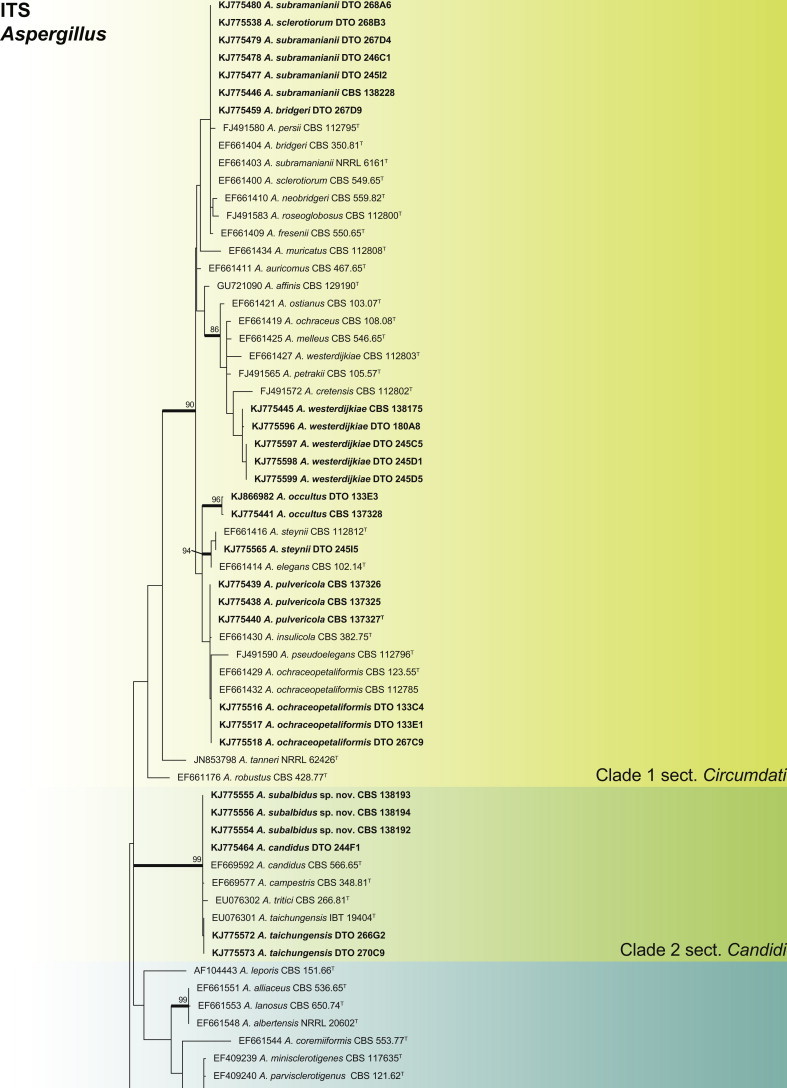
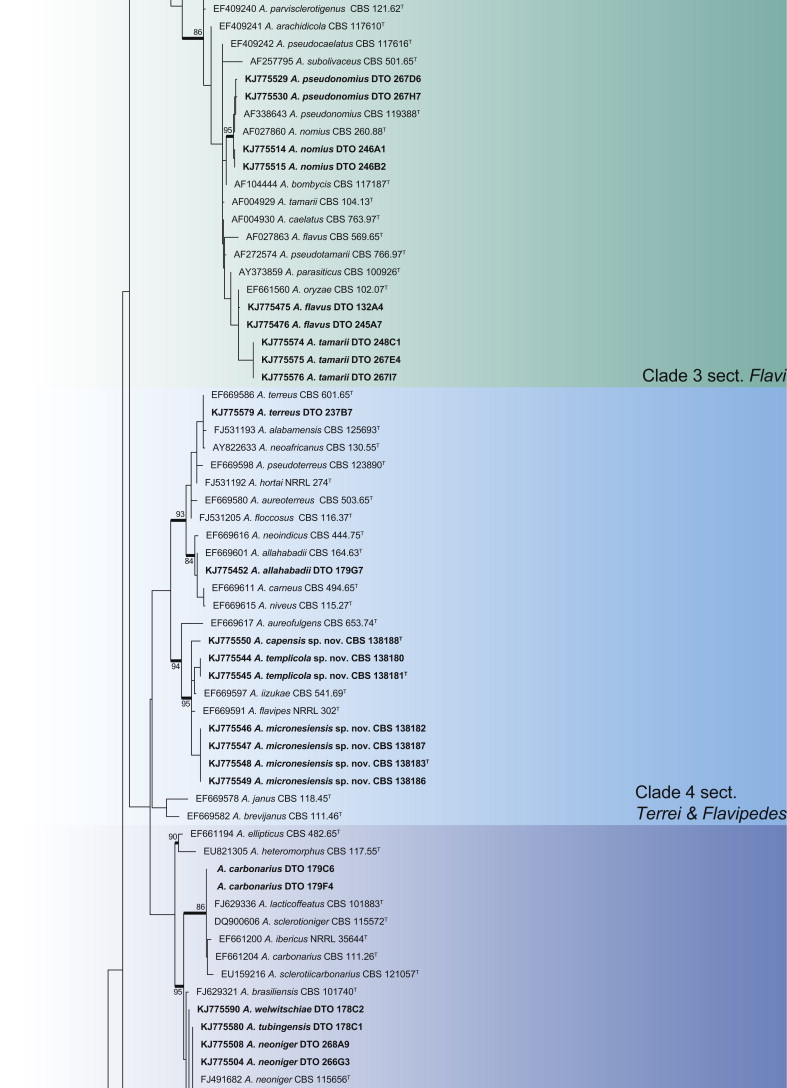
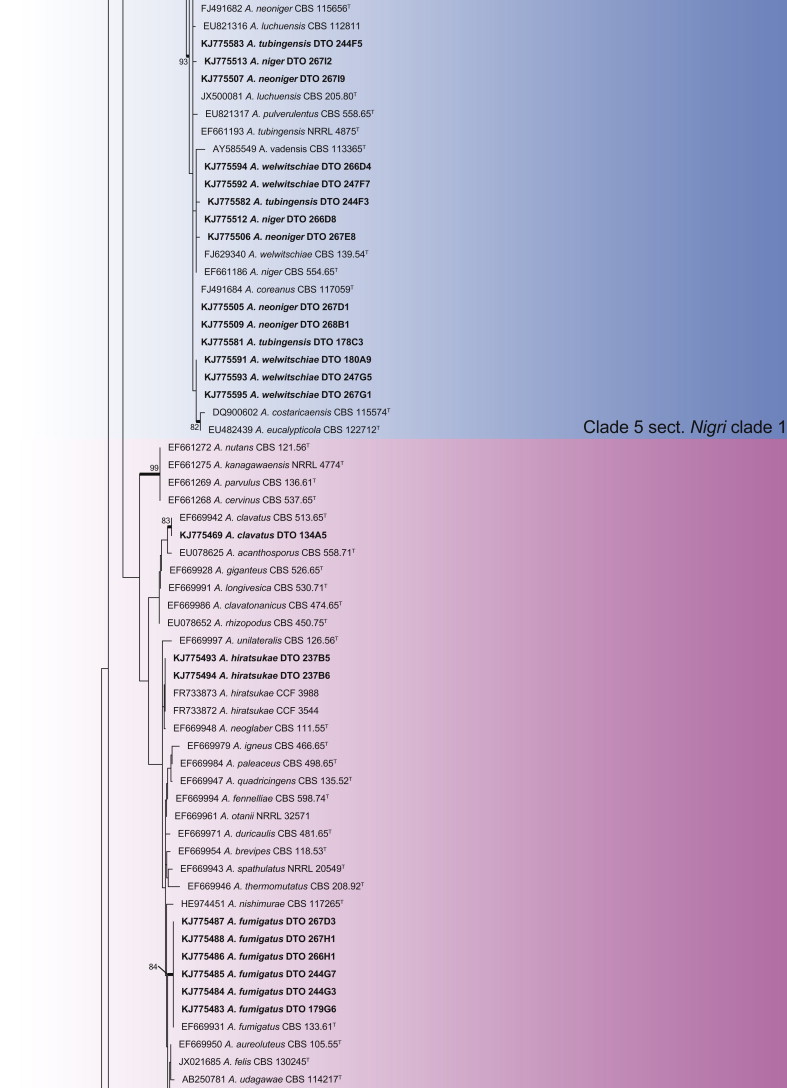
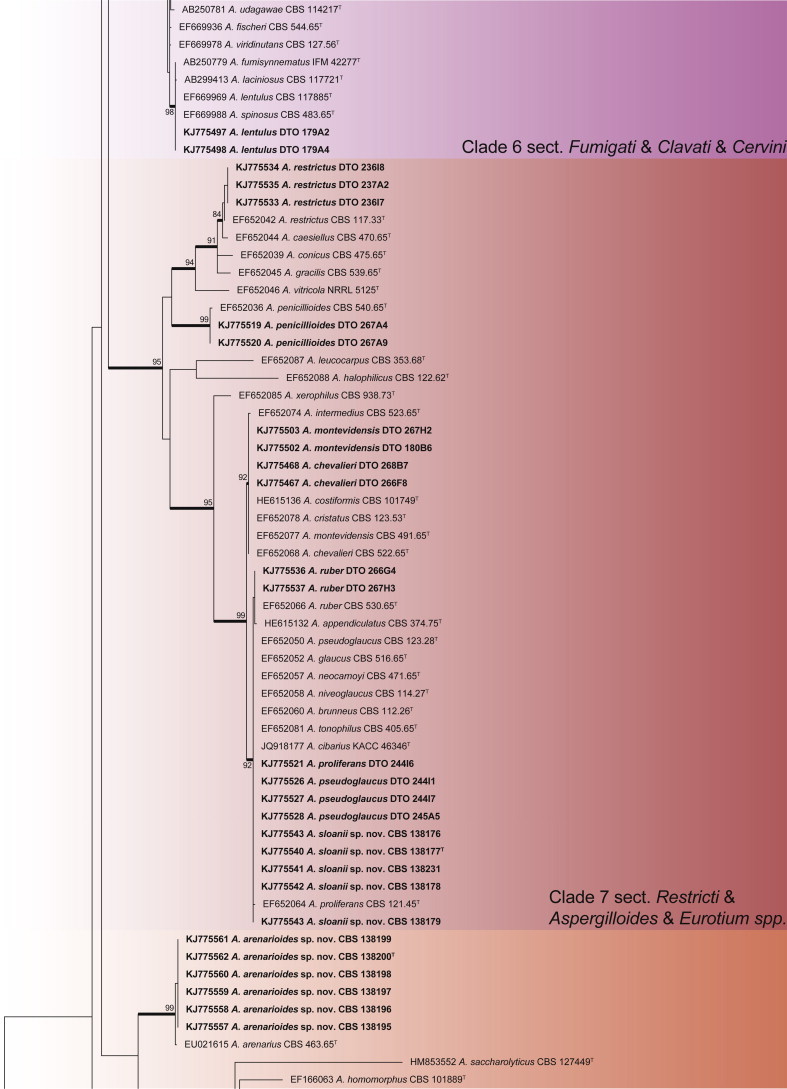
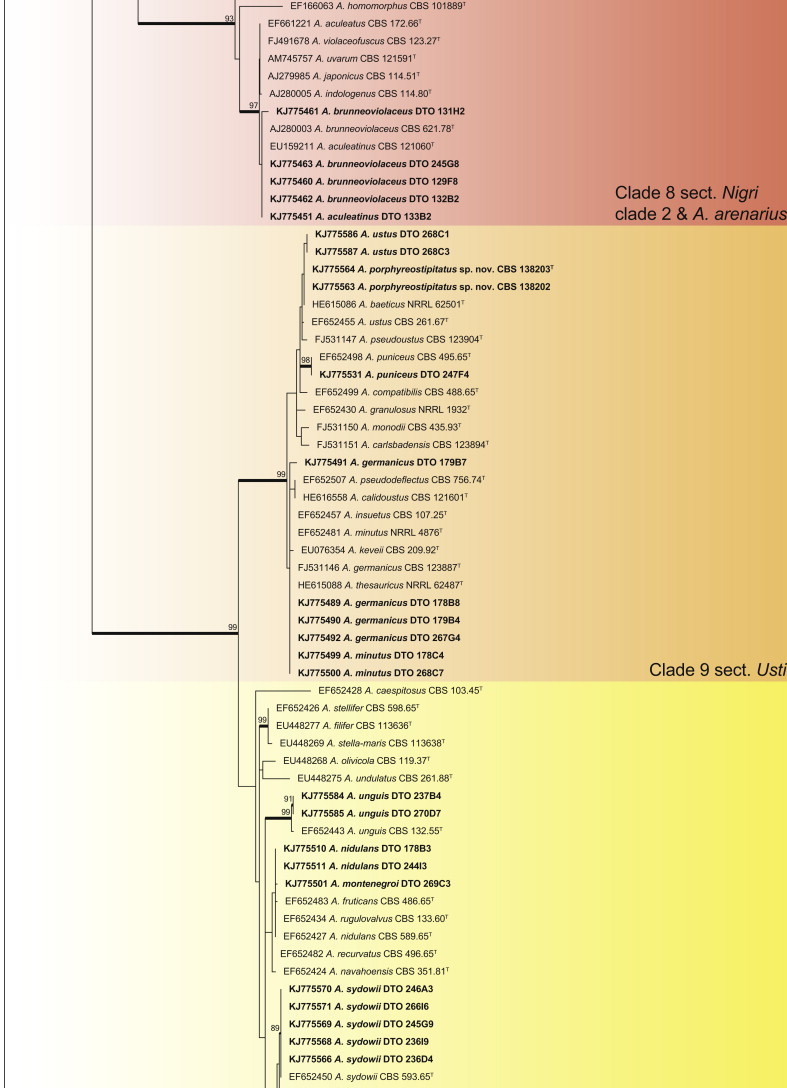
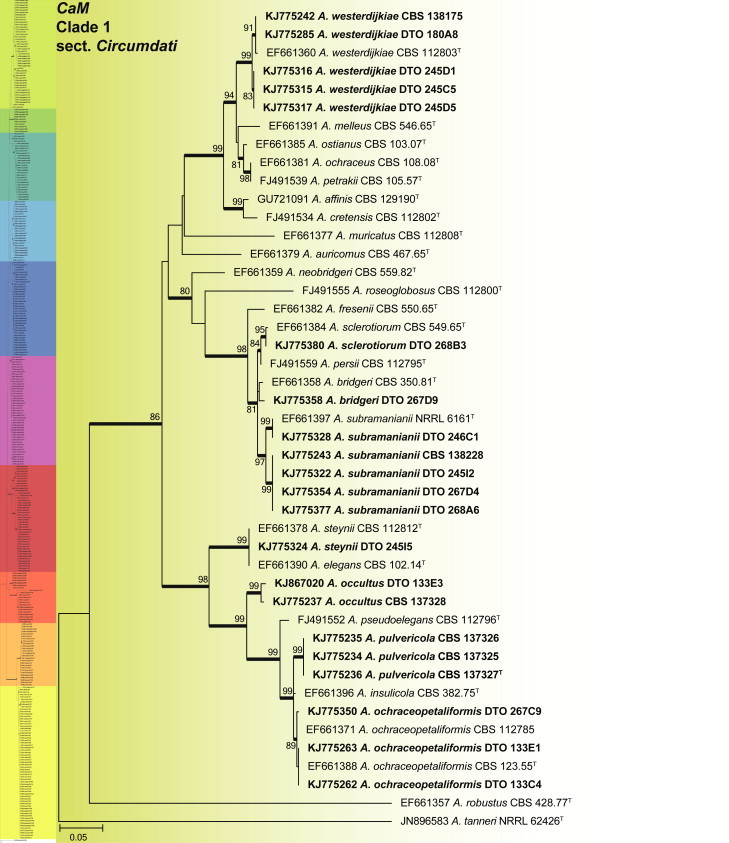
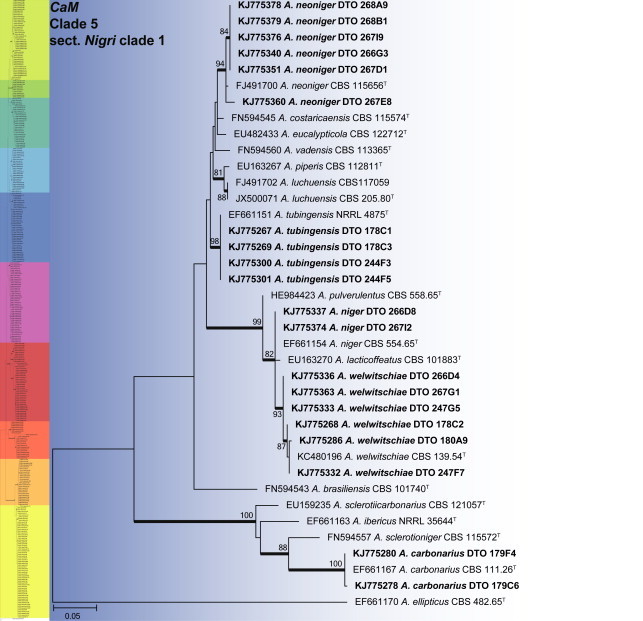
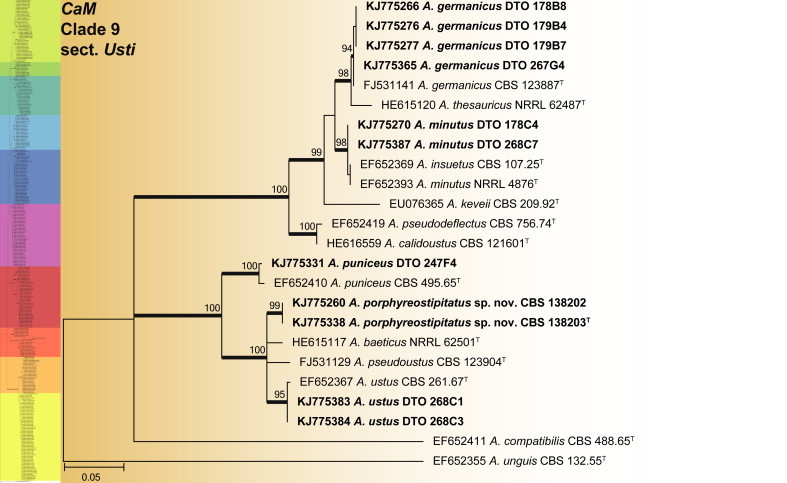
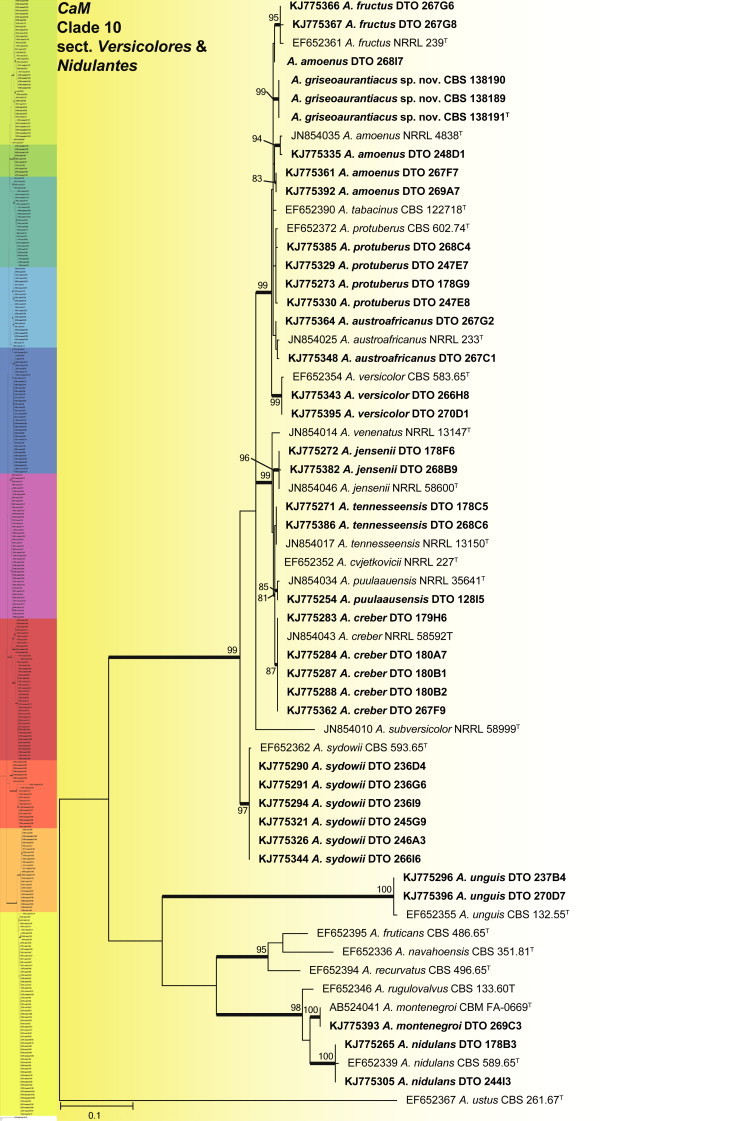
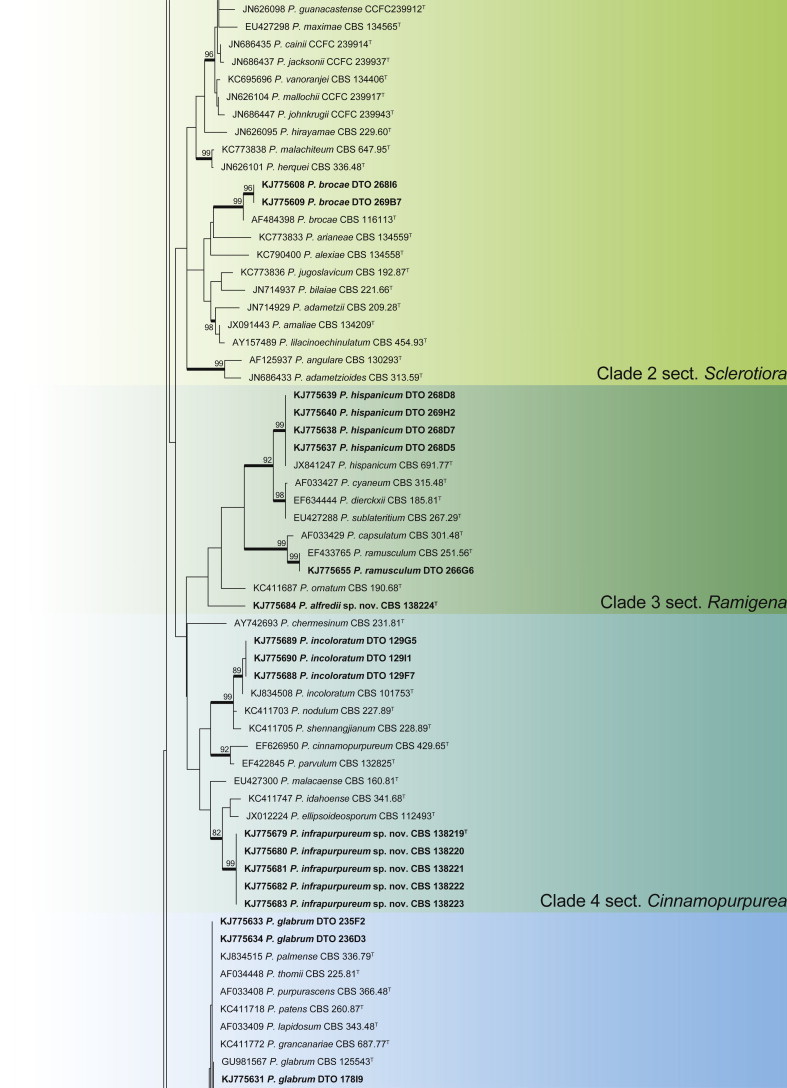
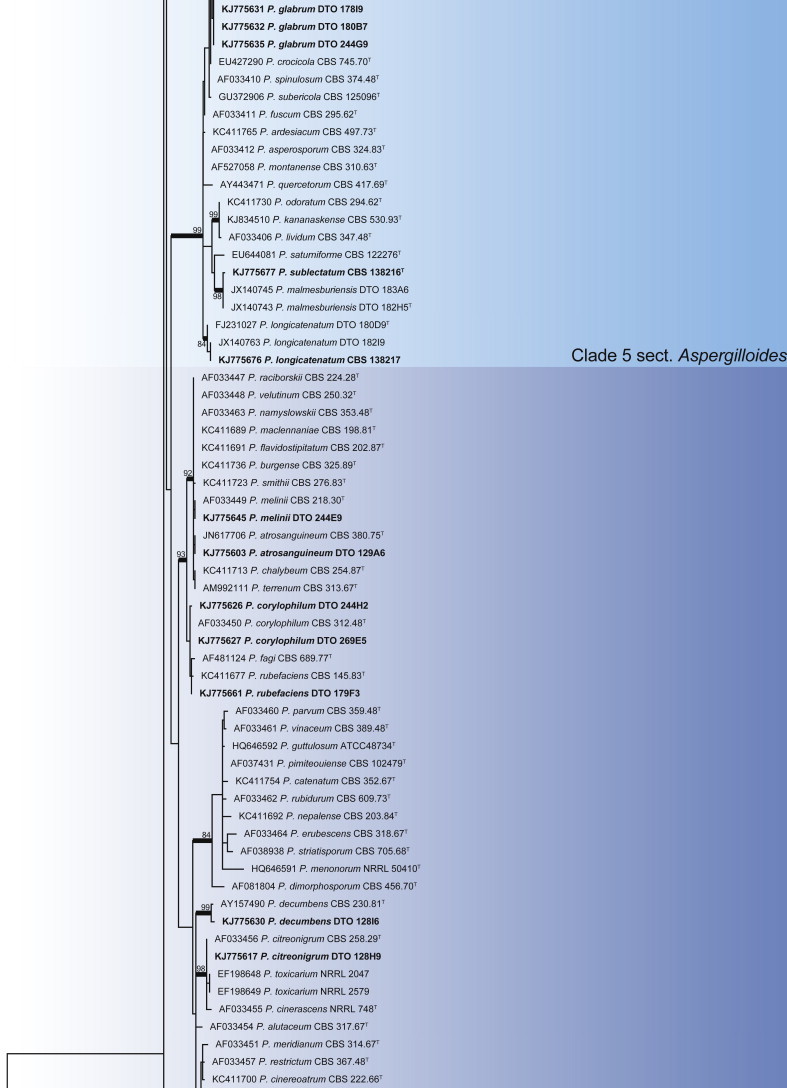
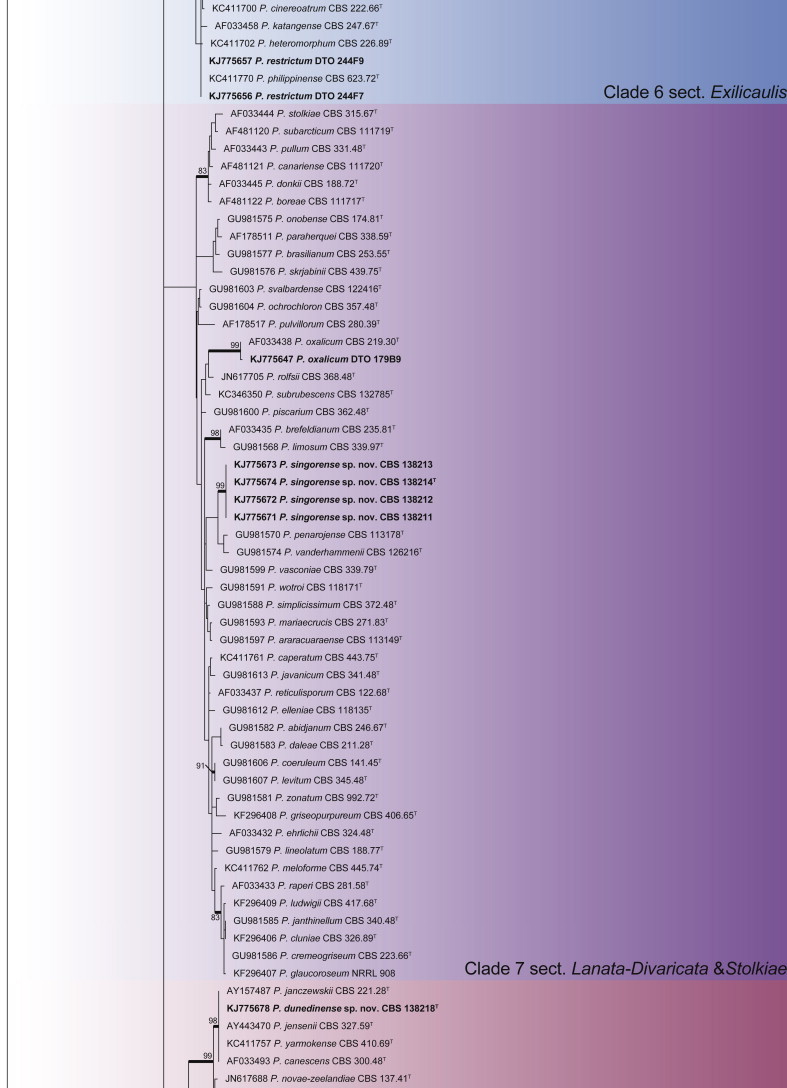
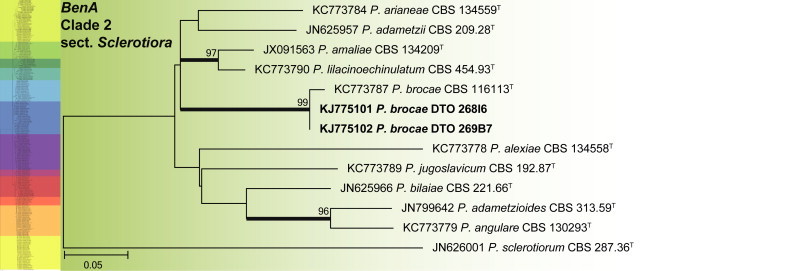
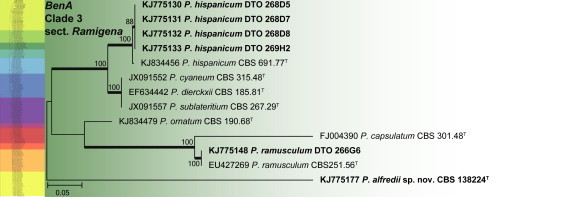
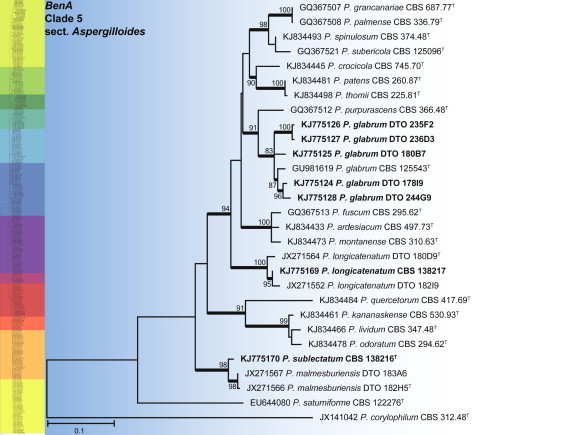
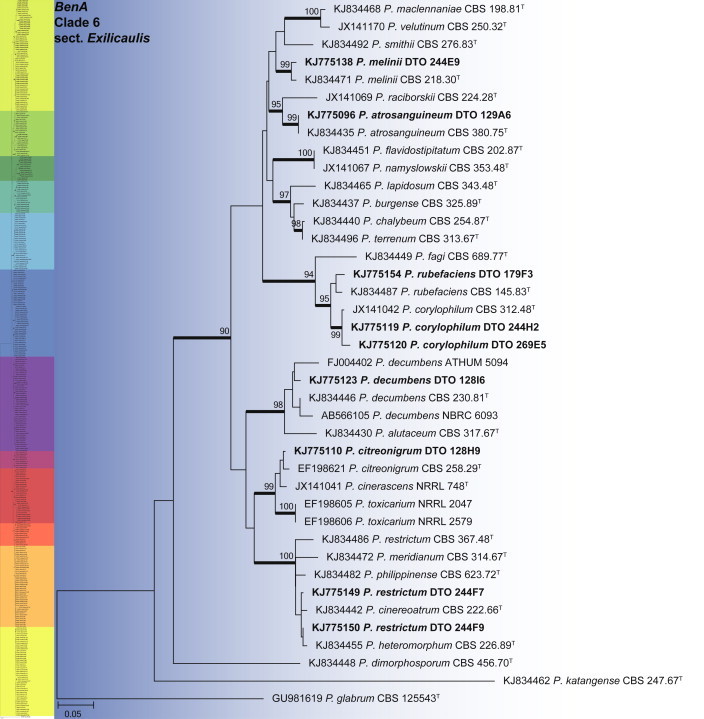
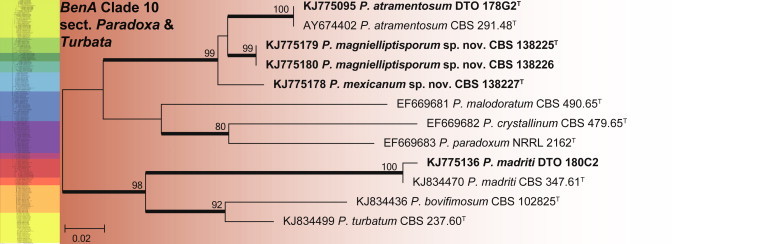
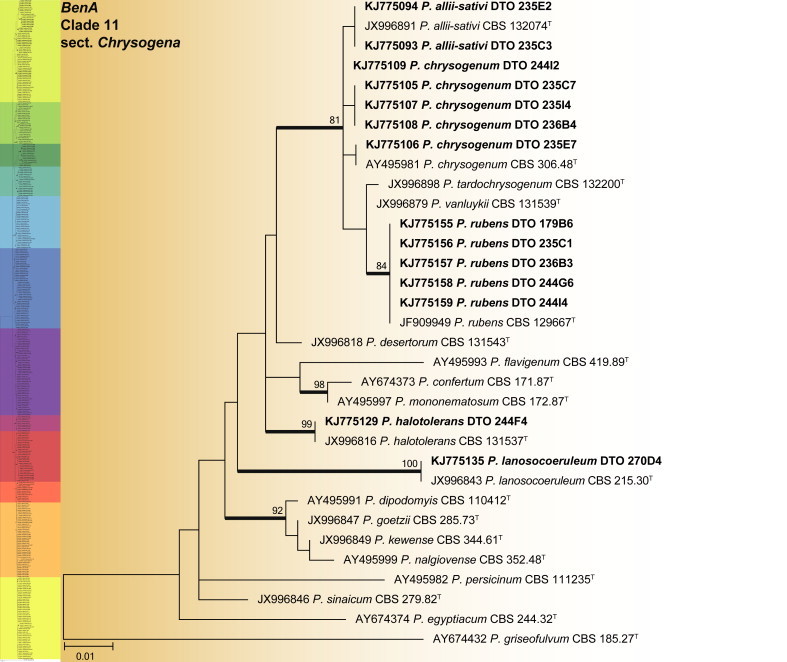
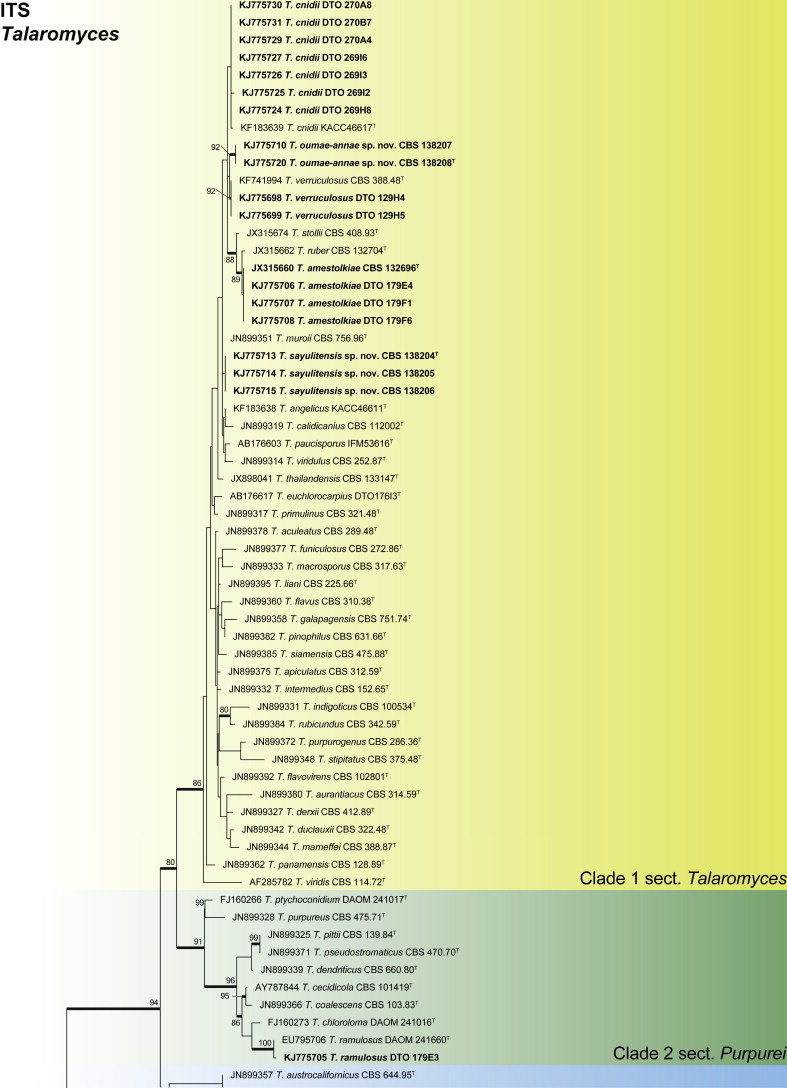
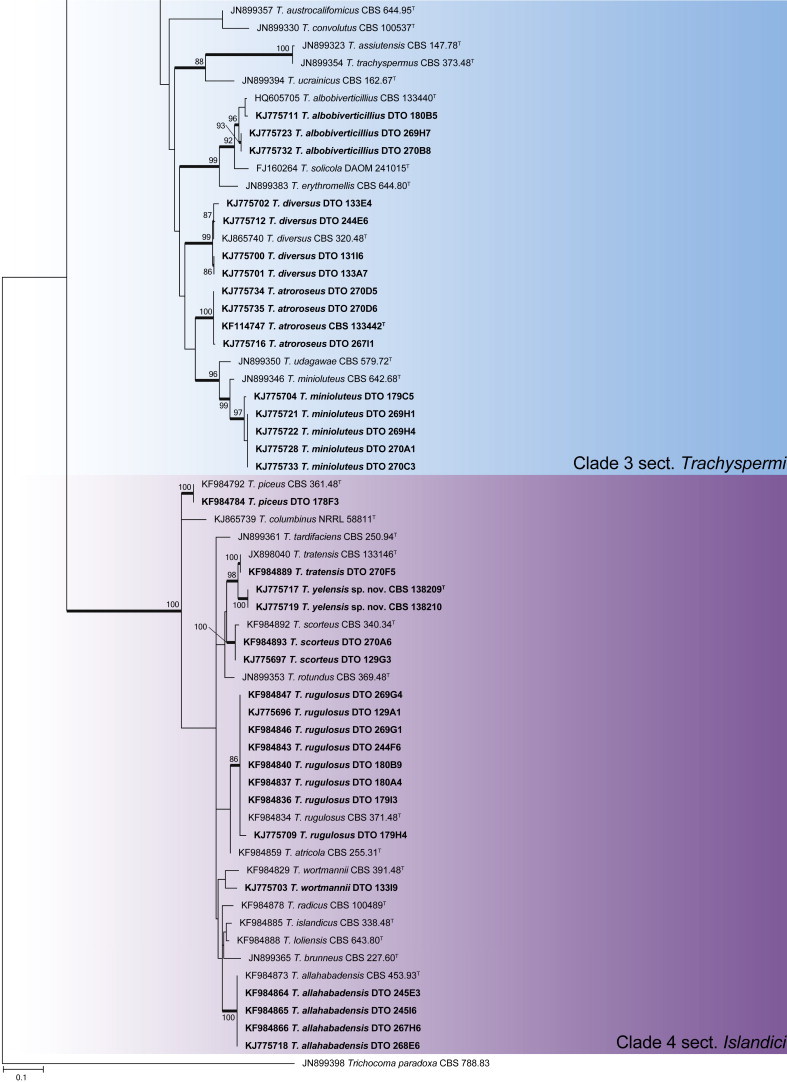
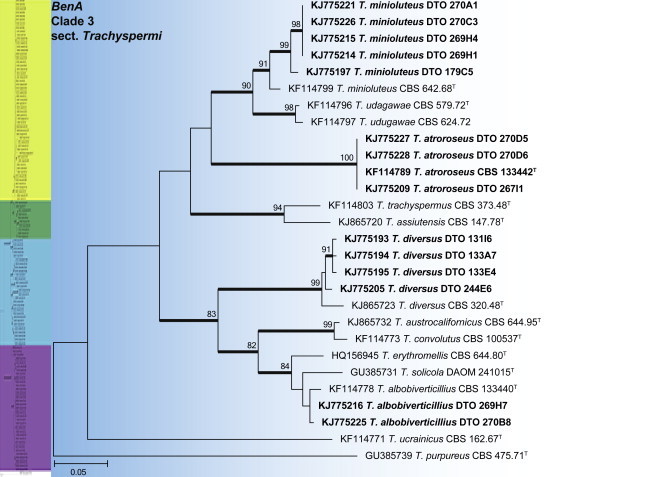
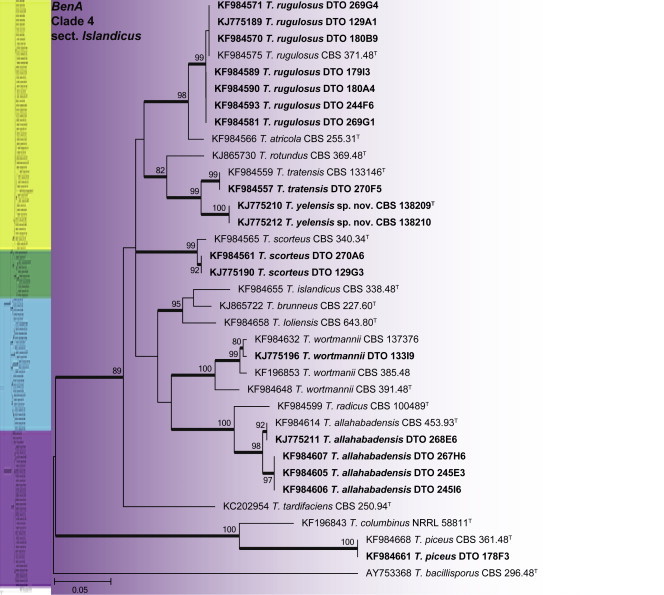
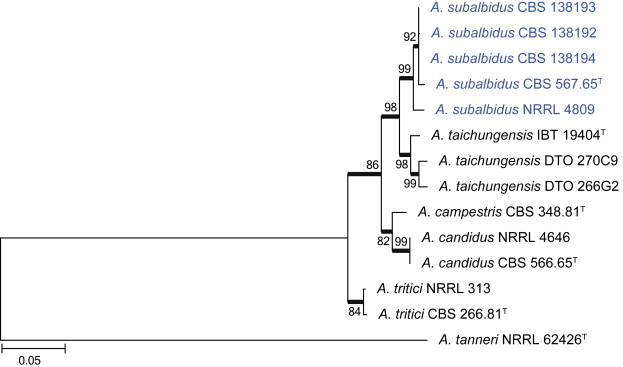
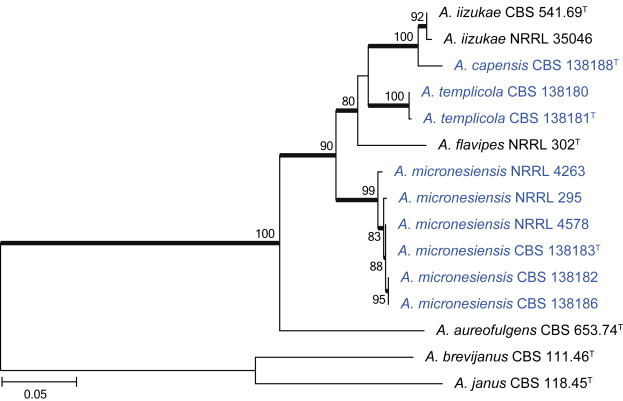
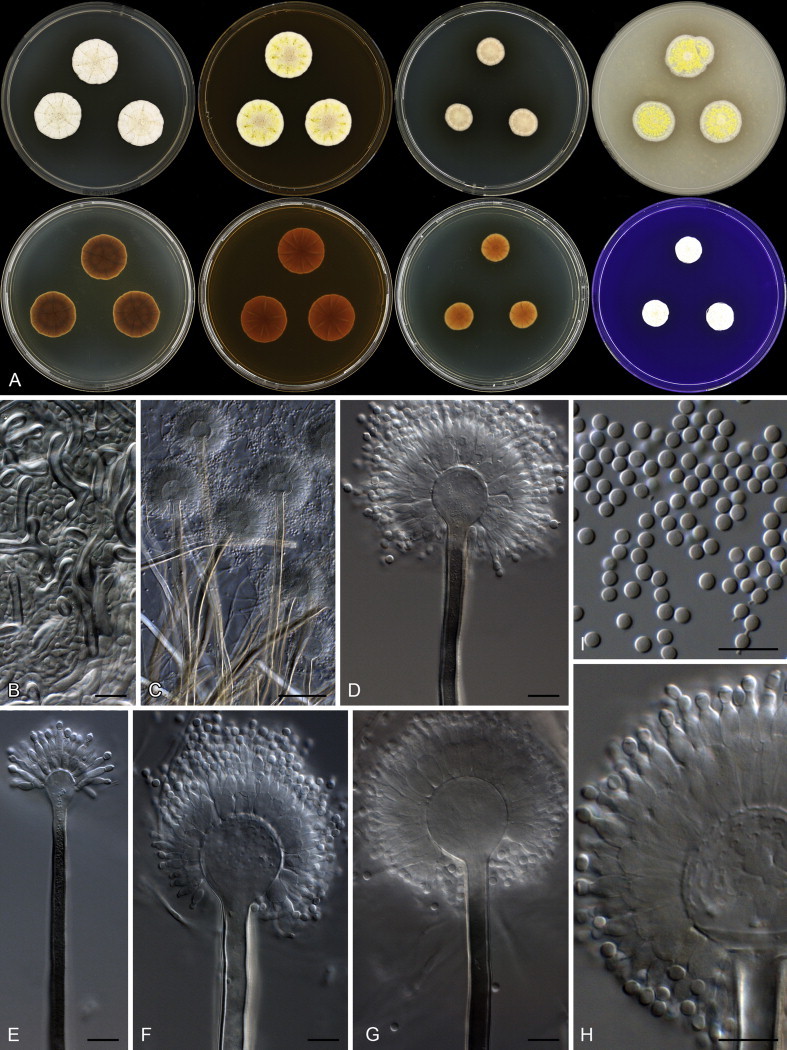
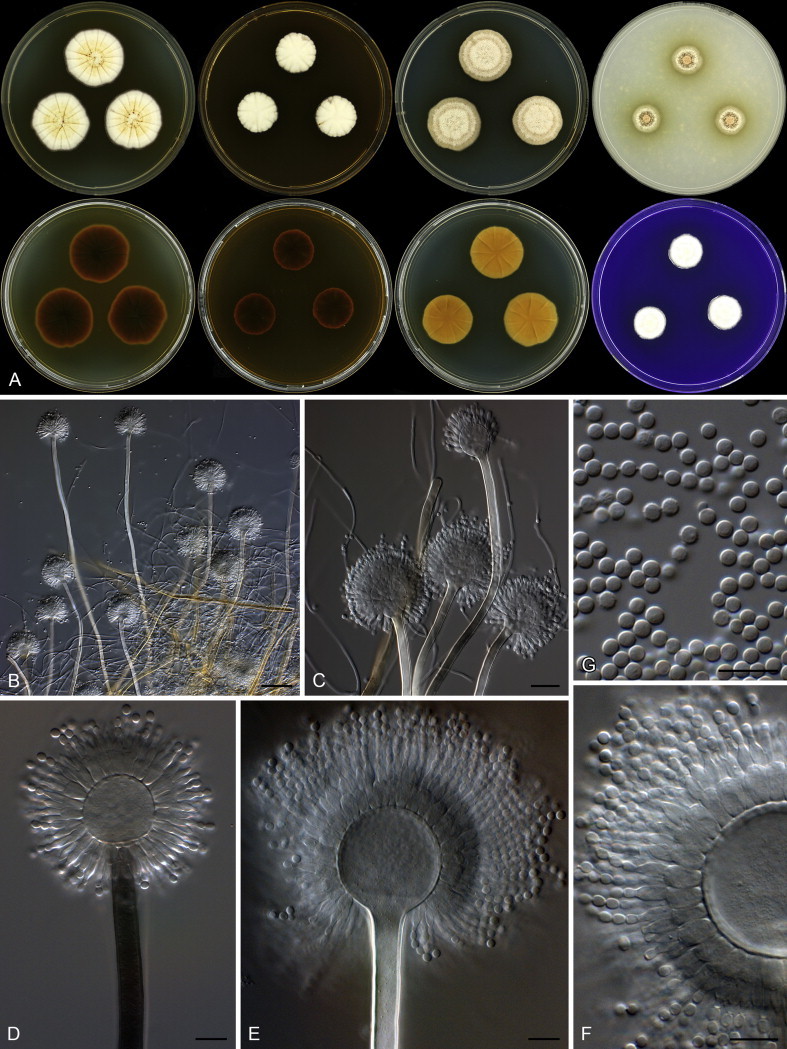
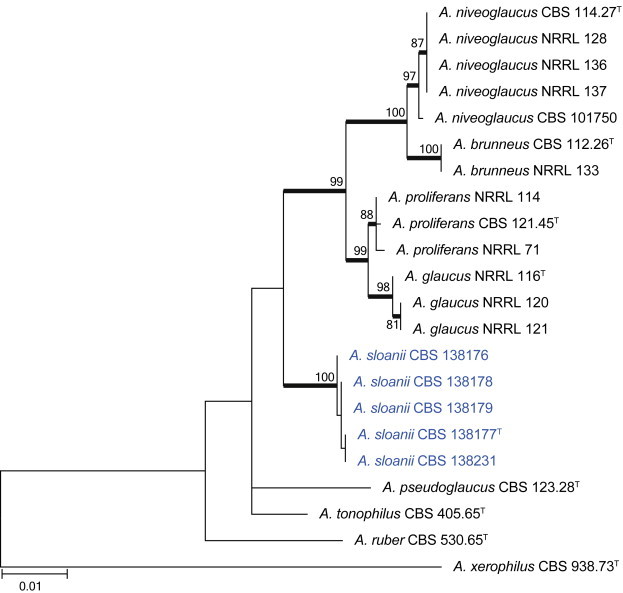
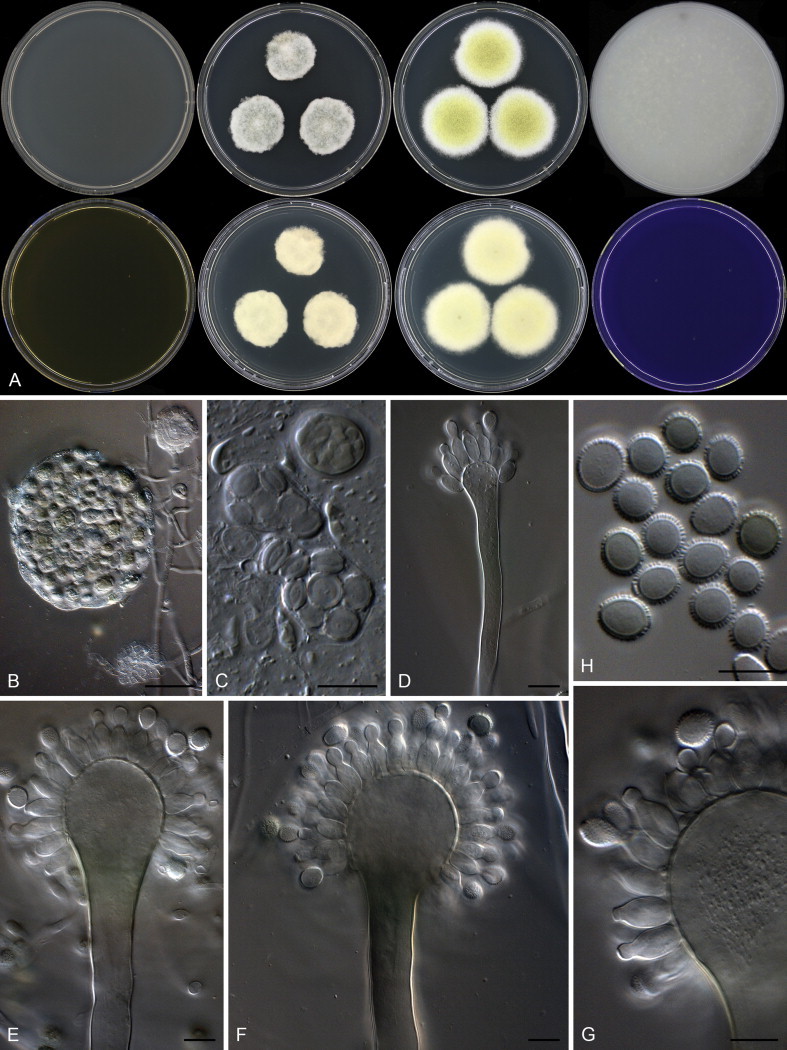
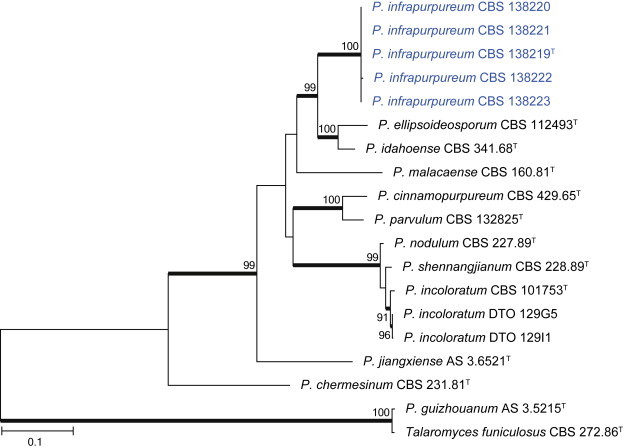
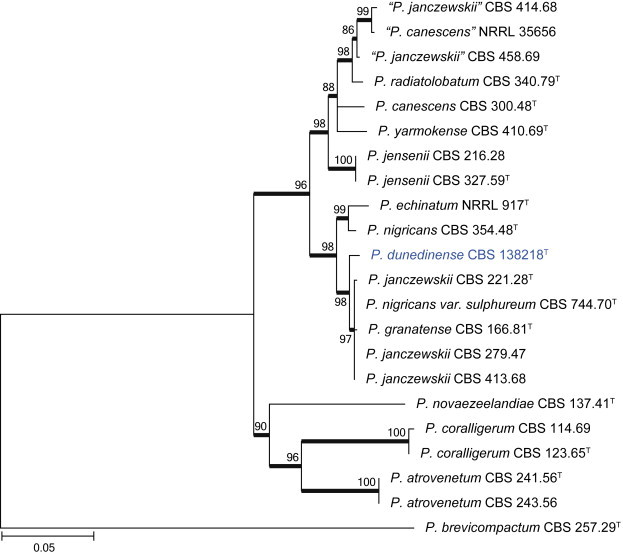
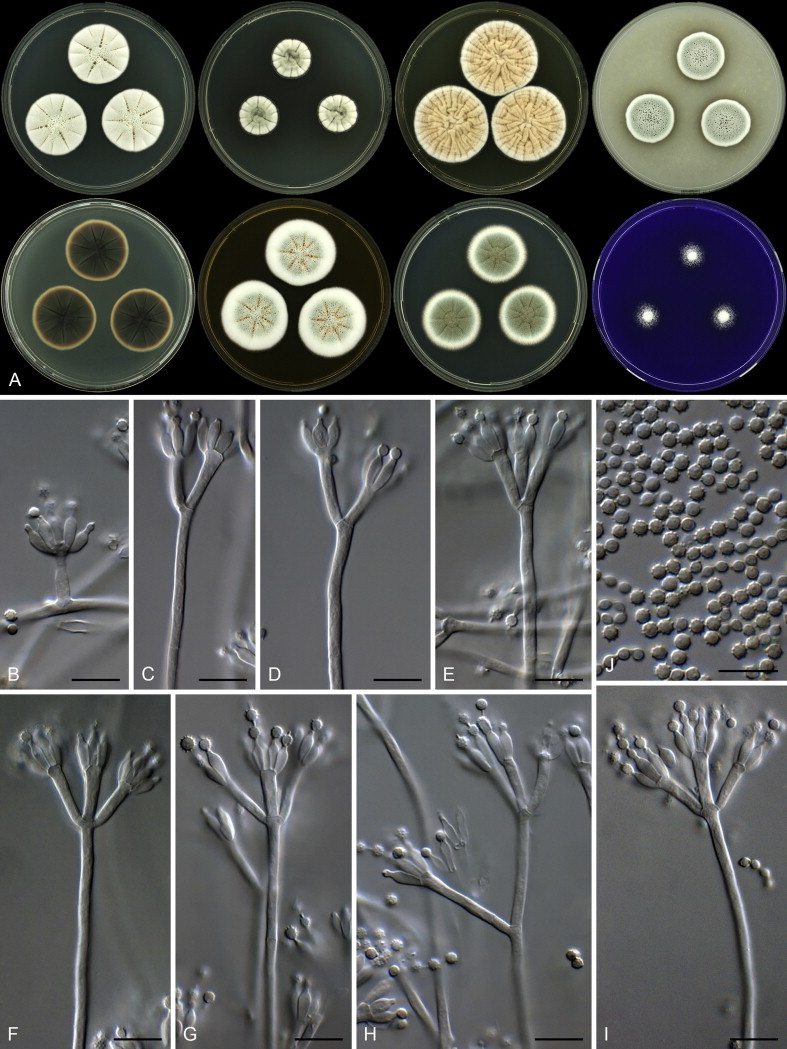
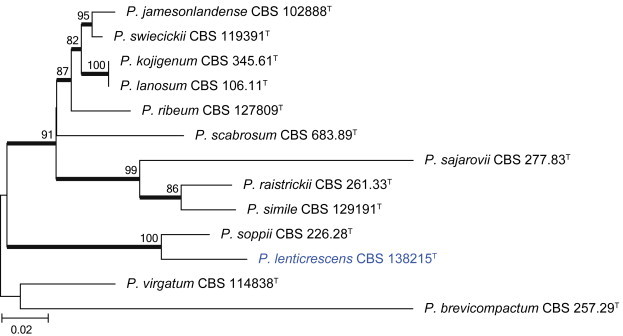
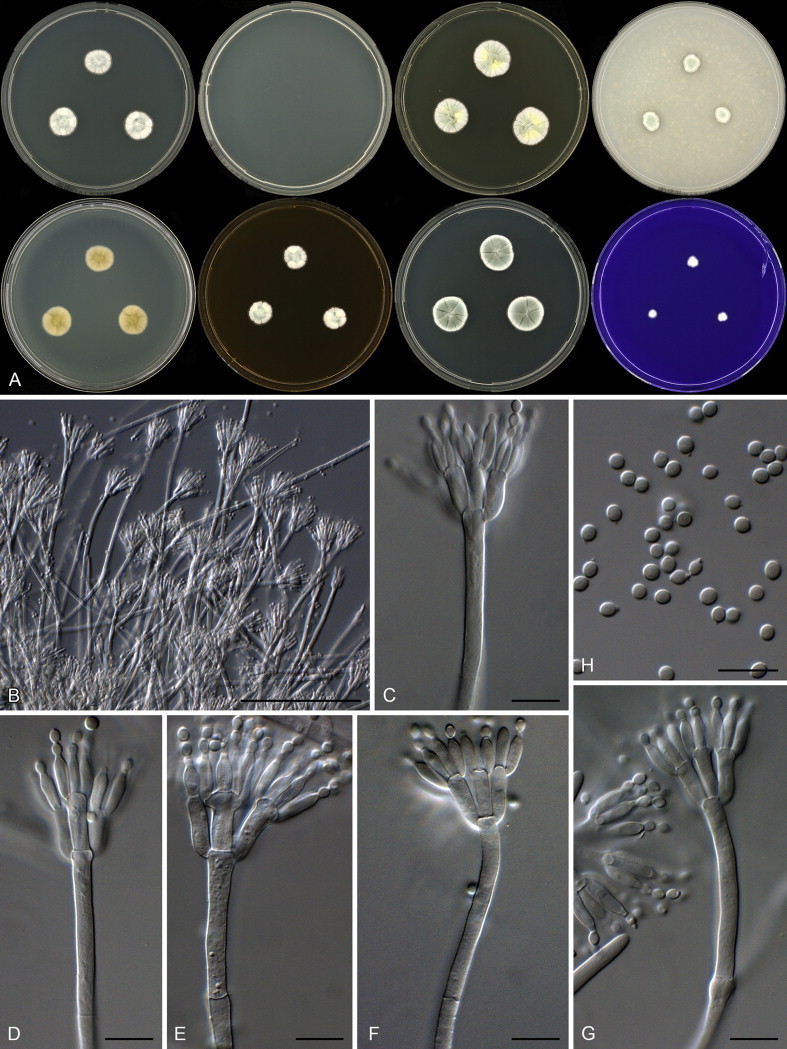
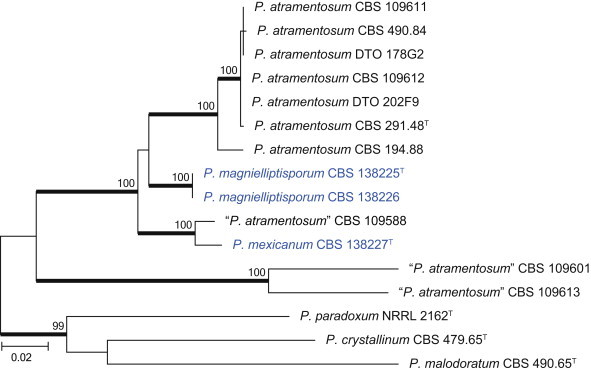
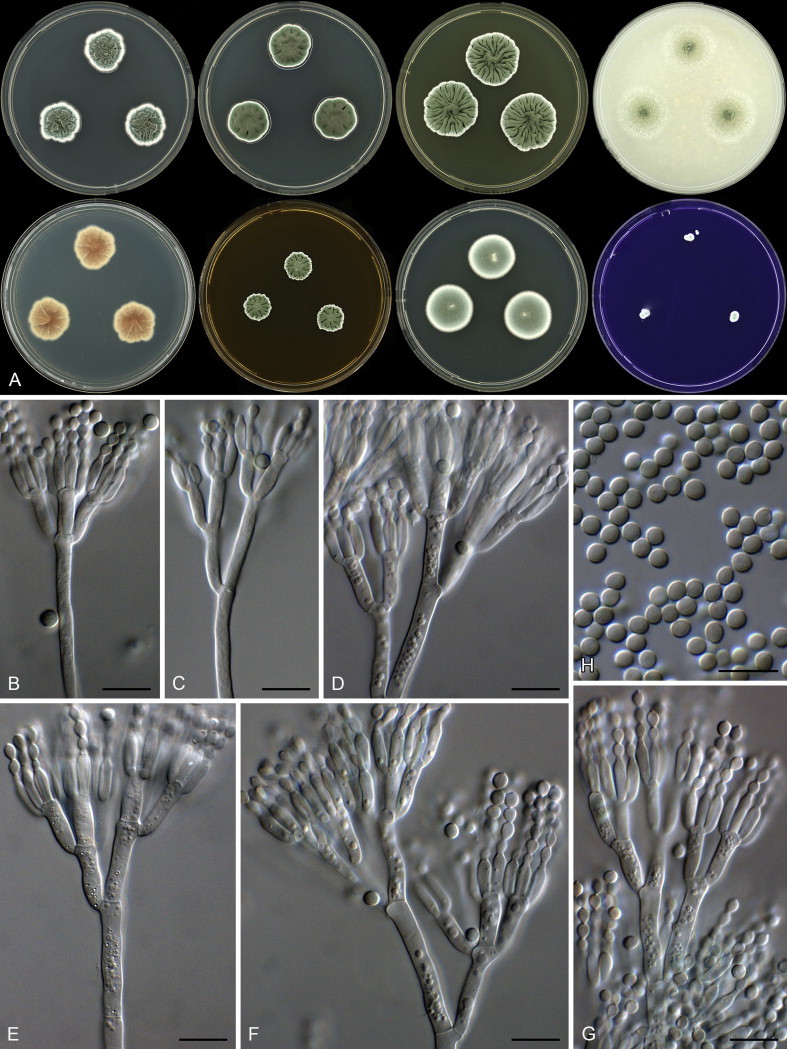
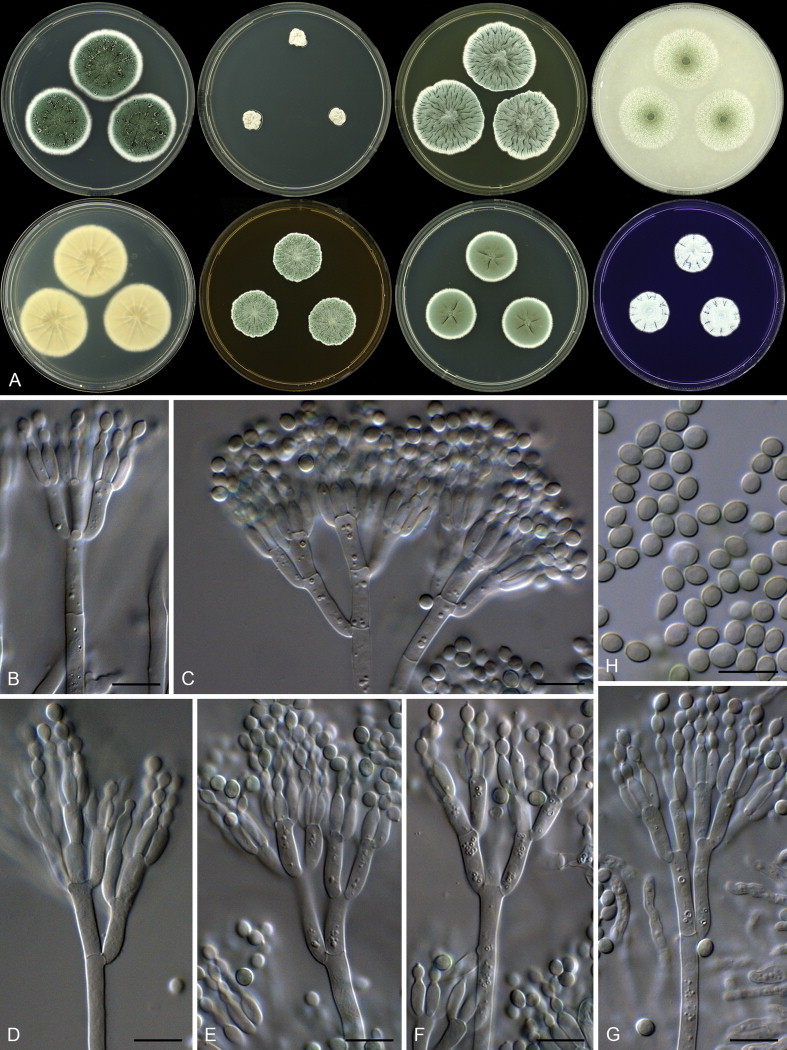
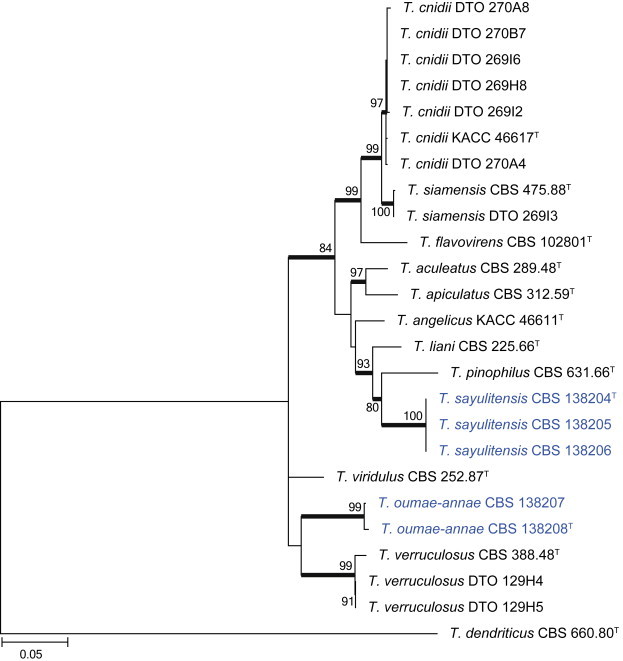
As part of a worldwide survey of the indoor mycobiota, dust was collected from nine countries. Analyses of dust samples included the culture-dependent dilution-to-extinction method and the culture-independent 454-pyrosequencing. Of the 7 904 isolates, 2 717 isolates were identified as belonging to Aspergillus, Penicillium and Talaromyces. The aim of this study was to identify isolates to species level and describe the new species found. Secondly, we wanted to create a reliable reference sequence database to be used for next-generation sequencing projects. Isolates represented 59 Aspergillus species, including eight undescribed species, 49 Penicillium species of which seven were undescribed and 18 Talaromyces species including three described here as new. In total, 568 ITS barcodes were generated, and 391 β-tubulin and 507 calmodulin sequences, which serve as alternative identification markers.

Keywords: Environmental metagenomics; Eurotiales; Indoor moulds; Trichocomaceae.


Figures

Fig. 1
Fig. 1
Aspergillus phylogeny of the ITS gene region showing the placement of representative strains isolated from house dust in bold. The coloured blocks indicate the different clades referred to in the text. The tree was rooted to Talaromyces flavus.
Fig. 1
Fig. 1
Aspergillus phylogeny of the ITS gene region showing the placement of representative strains isolated from house dust in bold. The coloured blocks indicate the different clades referred to in the text. The tree was rooted to Talaromyces flavus.
Fig. 1
Fig. 1
Aspergillus phylogeny of the ITS gene region showing the placement of representative strains isolated from house dust in bold. The coloured blocks indicate the different clades referred to in the text. The tree was rooted to Talaromyces flavus.
Fig. 1
Fig. 1
Aspergillus phylogeny of the ITS gene region showing the placement of representative strains isolated from house dust in bold. The coloured blocks indicate the different clades referred to in the text. The tree was rooted to Talaromyces flavus.
Fig. 1
Fig. 1
Aspergillus phylogeny of the ITS gene region showing the placement of representative strains isolated from house dust in bold. The coloured blocks indicate the different clades referred to in the text. The tree was rooted to Talaromyces flavus.
Fig. 1
Fig. 1
Aspergillus phylogeny of the ITS gene region showing the placement of representative strains isolated from house dust in bold. The coloured blocks indicate the different clades referred to in the text. The tree was rooted to Talaromyces flavus.
Fig. 2
Fig. 2
CaM phylogeny of Aspergillus section Circumdati, showing identities of species isolated from house dust in bold.
Fig. 3
Fig. 3
CaM phylogeny of Aspergillus section Candidi, showing identities of species isolated from house dust in bold.
Fig. 4
Fig. 4
CaM phylogeny of Aspergillus section Flavi showing identities of species isolated from house dust in bold.
Fig. 5
Fig. 5
CaM phylogeny of Aspergillus sections Terrei and Flavipedes, showing identities of species isolated from house dust in bold.
Fig. 6
Fig. 6
CaM phylogeny of Aspergillus section Nigri clade 1, showing identities of species isolated from house dust in bold.
Fig. 7
Fig. 7
CaM phylogeny of Aspergillus sections Fumigati, Clavati and Cervini, showing identities of species isolated from house dust in bold.
Fig. 8
Fig. 8
CaM phylogeny of Aspergillus sections Restricti, Aspergillus and Eurotium, showing identities of species isolated from house dust in bold.
Fig. 9
Fig. 9
CaM phylogeny of Aspergillus section Nigri clade 2 and A. arenarius, showing identities of species isolated from house dust in bold.
Fig. 10
Fig. 10
CaM phylogeny of Aspergillus section Usti, showing identities of species isolated from house dust in bold.
Fig. 11
Fig. 11
CaM phylogeny of Aspergillus sections Versicolores and Nidulantes, showing identities of species isolated from house dust in bold.
Fig. 12
Fig. 12
Penicillium phylogeny of the ITS gene region showing the placement of representative strains isolated from house dust in bold. The coloured blocks indicate the different clades referred to in the text. The tree was rooted to Talaromyces flavus.
Fig. 12
Fig. 12
Penicillium phylogeny of the ITS gene region showing the placement of representative strains isolated from house dust in bold. The coloured blocks indicate the different clades referred to in the text. The tree was rooted to Talaromyces flavus.
Fig. 12
Fig. 12
Penicillium phylogeny of the ITS gene region showing the placement of representative strains isolated from house dust in bold. The coloured blocks indicate the different clades referred to in the text. The tree was rooted to Talaromyces flavus.
Fig. 12
Fig. 12
Penicillium phylogeny of the ITS gene region showing the placement of representative strains isolated from house dust in bold. The coloured blocks indicate the different clades referred to in the text. The tree was rooted to Talaromyces flavus.
Fig. 12
Fig. 12
Penicillium phylogeny of the ITS gene region showing the placement of representative strains isolated from house dust in bold. The coloured blocks indicate the different clades referred to in the text. The tree was rooted to Talaromyces flavus.
Fig. 12
Fig. 12
Penicillium phylogeny of the ITS gene region showing the placement of representative strains isolated from house dust in bold. The coloured blocks indicate the different clades referred to in the text. The tree was rooted to Talaromyces flavus.
Fig. 13
Fig. 13
BenA phylogeny of Penicillium section Citrina, showing identities of species isolated from house dust in bold.
Fig. 14
Fig. 14
BenA phylogeny of Penicillium section Sclerotiora, showing identities of species isolated from house dust in bold.
Fig. 15
Fig. 15
BenA phylogeny of Penicillium section Ramigena, showing identities of species isolated from house dust in bold.
Fig. 16
Fig. 16
BenA phylogeny of Penicillium section Cinnamopurpurea, showing identities of species isolated from house dust in bold.
Fig. 17
Fig. 17
BenA phylogeny of Penicillium section Aspergilloides, showing identities of species isolated from house dust in bold.
Fig. 18
Fig. 18
BenA phylogeny of Penicillium section Exilicaulis, showing identities of species isolated from house dust in bold.
Fig. 19
Fig. 19
BenA phylogeny of Penicillium section Lanata-Divaricata, showing identities of species isolated from house dust in bold.
Fig. 20
Fig. 20
BenA phylogeny of Penicillium section Canescentia, showing identities of species isolated from house dust in bold.
Fig. 21
Fig. 21
BenA phylogeny of Penicillium sections Brevicompacta & Ramosa, showing identities of species isolated from house dust in bold.
Fig. 22
Fig. 22
BenA phylogeny of Penicillium sections Paradoxa & Turbata, showing identities of species isolated from house dust in bold.
Fig. 23
Fig. 23
BenA phylogeny of Penicillium section Chrysogena, showing identities of species isolated from house dust in bold.
Fig. 24
Fig. 24
BenA phylogeny of Penicillium sections Penicillium & Fasciculata, showing identities of species isolated from house dust in bold.
Fig. 25
Fig. 25
Talaromyces phylogeny of the ITS gene region showing the placement of representative strains isolated from house dust in bold. The coloured blocks indicate the different clades referred to in the text. The tree was rooted to Trichocoma paradoxa.
Fig. 25
Fig. 25
Talaromyces phylogeny of the ITS gene region showing the placement of representative strains isolated from house dust in bold. The coloured blocks indicate the different clades referred to in the text. The tree was rooted to Trichocoma paradoxa.
Fig. 26
Fig. 26
BenA phylogeny of Talaromyces section Talaromyces, showing identities of species isolated from house dust in bold.
Fig. 27
Fig. 27
BenA phylogeny of Talaromyces section Purpurei, showing identities of species isolated from house dust in bold.
Fig. 28
Fig. 28
BenA phylogeny of Talaromyces section Trachyspermi, showing identities of species isolated from house dust in bold.
Fig. 29
Fig. 29
BenA phylogeny of Talaromyces section Islandici, showing identities of species isolated from house dust in bold.
Fig. 30
Fig. 30
Combined phylogeny for ITS, BenA and CaM of Aspergillus section Candidi. Aspergillus tanneri was used as outgroup. Names in blue are new species described in this study. Model selected: K2 + G, combined alignment 1 529 bp.
Fig. 31
Fig. 31
Aspergillus subalbidus. A. Colonies: top row left to right, obverse CYA, MEA, DG18 and OA; bottom row left to right, reverse CYA, MEA, DG18 and obverse CREA. B. Purple to black sclerotia on OA. C–G. Conidiophores on DG18 (E. on MEA). H. Conidia. Scale bars: C, D, F–H = 10 μm; E = 50 μm.
Fig. 32
Fig. 32
Combined phylogeny for ITS, BenA and CaM of Aspergillus section Flavipedes. Names in blue are new species described in this study. Aspergillus janus and A. brevijanus was used as outgroup. Model selected: Tamura-Nei (TN93) combined alignment 1 695 bp.
Fig. 33
Fig. 33
Aspergillus templicola. A. Colonies: top row left to right, obverse CYA, MEA, DG18 and OA; bottom row left to right, reverse CYA, MEA, DG18 and obverse CREA. B–H. Conidiophores. I. Conidia. Scale bars: B = 50 μm; C–I = 10 μm.
Fig. 34
Fig. 34
Aspergillus micronesiensis. A. Colonies: top row left to right, obverse CYA, MEA, DG18 and OA; bottom row left to right, reverse CYA, MEA, DG18 and obverse CREA. B. Hülle cells. C–H. Conidiophores. I. Conidia. Scale bars: B, D–I = 10 μm; C = 50 μm.
Fig. 35
Fig. 35
Aspergillus capensis. A. Colonies: top row left to right, obverse CYA, MEA, DG18 and OA; bottom row left to right, reverse CYA, MEA, DG18 and obverse CREA. B–F. Conidiophores. G. Conidia. Scale bars: B = 50 μm; C = 20 μm; C–G = 10 μm.
Fig. 36
Fig. 36
Combined phylogeny for ITS, BenA and CaM of selected Aspergillus section Aspergillus. Names in blue are new species described in this study. Aspergillus xerophilus was used as outgroup. Model selected: K2 + G, combined alignment 1 695 bp.
Fig. 37
Fig. 37
Aspergillus sloanii. A. Colonies: top row left to right, obverse CYA, DG18 of non-sexual strain, DG18 of sexual strain and OA; bottom row left to right, MEA, reverse DG18 of non-sexual strain, reverse DG18 of sexual strain and obverse CREA. B. Ascoma. C. Asci with ascospores. D–G. Conidiophores. H. Conidia. Scale bars: B = 50 μm; C–H = 10 μm.
Fig. 38
Fig. 38
Combined phylogeny for ITS, BenA and CaM of Aspergillus arenarius and A. arenarioides. Names in blue are new species described in this study. Aspergillus saccharolyticus was used as outgroup. Model selected: Tamura-3-parameter (T92) +G, combined alignment 1 549 bp.
Fig. 39
Fig. 39
Aspergillus arenarioides. A. Colonies: top row left to right, obverse CYA, MEA, DG18 and OA; bottom row left to right, reverse CYA, MEA, DG18 and obverse CREA. B. Sclerotia on CYA. C–I. Conidiophores. J. Conidia. Scale bars: B = 1000 μm; C–J = 10 μm.
Fig. 40
Fig. 40
Combined phylogeny for ITS, BenA and CaM of selected Aspergillus section Usti species. Names in blue are new species described in this study. Aspergillus compatibilis was used as outgroup. Model selected: K2 + G, combined alignment 1 345 bp.
Fig. 41
Fig. 41
Aspergillus porphyreostipitatus. A. Colonies: top row left to right, obverse CYA, MEA, DG18 and OA; bottom row left to right, reverse CYA, MEA, DG18 and obverse CREA. B, D–H. Conidiophores on MEA. C. Hülle cell on OA. I. Conidia. Scale bars: B = 50 μm; C–I = 10 μm.
Fig. 42
Fig. 42
Combined phylogeny for ITS, BenA and CaM of Aspergillus section Versicolores. Names in blue are new species described in this study. Aspergillus fruticans was used as outgroup. Model selected: T92 + G, combined alignment 1 612 bp.
Fig. 43
Fig. 43
Aspergillus griseoaurantiacus. A. Colonies: top row left to right, obverse CYA, MEA, DG18 and OA; bottom row left to right, reverse CYA, MEA, DG18 and obverse CREA. B, C, E–H. Conidiophores. D. Hülle cells. I. Conidia. Scale bars: B, C, E–I = 10 μm; D = 20 μm; E = 100 μm.
Fig. 44
Fig. 44
RPB2 phylogeny of the genus Penicillium, showing the unique position of P. alfredii. Names in blue are new species described in this study. Talaromyces wortmanii was used as outgroup. Model selected: K2 + G, combined alignment 953 bp.
Fig. 45
Fig. 45
Penicillium alfredii. A. Colonies: top row left to right, obverse CYA, CYA 30 °C, YES and OA; bottom row left to right, reverse CYA, obverse MEA, DG18 and CREA. B–G. Conidiophores. H. Conidia. Scale bars: B–H = 10 μm.
Fig. 46
Fig. 46
Combined phylogeny for ITS, BenA and CaM of Penicillium section Cinnamopurpurea. Names in blue are new species described in this study. Talaromyces funiculosus and P. guizhouanum was used as outgroup. Model selected: TN93 + G, combined alignment 1 449 bp.
Fig. 47
Fig. 47
Penicillium infrapurpureum. A. Colonies: top row left to right, obverse CYA, CYA 30 °C, YES and OA; bottom row left to right, reverse CYA, obverse MEA, DG18 and CREA. B–G. Conidiophores. H. Conidia. Scale bars: B–H = 10 μm.
Fig. 48
Fig. 48
Combined phylogeny for ITS, BenA and CaM of Penicillium section Lanata-Divaricata. Names in blue are new species described in this study. Penicillium oxalicum was used as outgroup. Model selected: K2 + G, combined alignment 1 535 bp.
Fig. 49
Fig. 49
Penicillium singorense. A. Colonies: top row left to right, obverse CYA, CYA 30 °C, YES and OA; bottom row left to right, reverse CYA, obverse MEA, DG18 and CREA. B–G. Conidiophores. H. Conidia. Scale bars: B–H = 10 μm.
Fig. 50
Fig. 50
Combined phylogeny for BenA and CaM of Penicillium section Canescentia species. Names in blue are new species described in this study. Penicillium brevicompactum was used as outgroup. Model selected: K2 + G, combined alignment 789 bp.
Fig. 51
Fig. 51
Penicillium dunedinense. A. Colonies: top row left to right, obverse CYA, CYA 30 °C, YES and OA; bottom row left to right, reverse CYA, obverse MEA, DG18 and CREA. B–I. Conidiophores. J. Conidia. Scale bars: B–J = 10 μm.
Fig. 52
Fig. 52
Combined phylogeny for ITS, BenA and CaM of Penicillium section Ramosa species. Names in blue are new species described in this study. Penicillium brevicompactum was used as outgroup. Model selected: GTR + G, combined alignment 1 360 bp.
Fig. 53
Fig. 53
Penicillium lenticrescens. A. Colonies: top row left to right, obverse CYA, CYA 30 °C, YES and OA; bottom row left to right, reverse CYA, obverse MEA, DG18 and CREA. B–G. Conidiophores. H. Conidia. Scale bars: B = 100 μm; C–H = 10 μm.
Fig. 54
Fig. 54
Combined phylogeny for BenA and CaM of Penicillium section Paradoxa species. Names in blue are new species described in this study. The tree was rooted to P. paradoxum, P. crystallinum and P. malodoratum. Model selected: K2 + G, combined alignment 853 bp.
Fig. 55
Fig. 55
Penicillium mexicanum. A. Colonies: top row left to right, obverse CYA, CYA 30 °C, YES and OA; bottom row left to right, reverse CYA, obverse MEA, DG18 and CREA. B–G. Conidiophores. H. Conidia. Scale bars: B–H = 10 μm.
Fig. 56
Fig. 56
Penicillium magnielliptisporum. A. Colonies: top row left to right, obverse CYA, CYA 30 °C, YES and OA; bottom row left to right, reverse CYA, obverse MEA, DG18 and CREA. B–G. Conidiophores. H. Conidia. Scale bars: B–H = 10 μm.
Fig. 57
Fig. 57
Combined phylogeny for ITS, BenA and CaM of Talaromyces section. Talaromyces species closely related to the new species from house dust. The tree was rooted to T. dendriticus. Model selected: K2 + G, combined alignment 1 452 bp.
Fig. 58
Fig. 58
Talaromyces oumae-annae. A. Colonies: top row left to right, obverse CYA, MEA, DG18 and OA; bottom row left to right, reverse CYA, MEA, obverse YES and CREA. B–H. Conidiophores. I. Conidia. Scale bars: B–I = 10 μm.
Fig. 59
Fig. 59
Talaromyces sayulitensis. A. Colonies: top row left to right, obverse CYA, MEA, DG18 and OA; bottom row left to right, reverse CYA, MEA, obverse YES and CREA. B–H. Conidiophores. I. Conidia. Scale bars: B–I = 10 μm.
Fig. 60
Fig. 60
Combined phylogeny for ITS and BenA of Talaromyces section Islandici. Names in blue are new species described in this study. The tree was rooted to T. piceus. Model selected: K2 + G, combined alignment 738 bp.
Fig. 61
Fig. 61
Talaromyces yelensis. A. Colonies: top row left to right, obverse CYA, MEA, DG18 and OA; bottom row left to right, reverse CYA, MEA, obverse YES and CREA. B–G. Conidiophores. H. Conidia. Scale bars: B–H = 10 μm.

References

    1. Adams R.I., Miletto M., Taylor J.W. Dispersal in microbes: fungi in indoor air are dominated by outdoor air and show dispersal limitation at short distances. The ISME Journal. 2013;7:1262–1273. - PMC - PubMed
    1. Adams R.I., Miletto M., Taylor J.W. The diversity and distribution of fungi on residential surfaces. PLoS One. 2013;8:e78866. - PMC - PubMed
    1. Aimanianda V., Bayry J., Bozza S. Surface hydrophobin prevents immune recognition of airborne fungal spores. Nature. 2009;460:1117–1121. - PubMed
    1. Amend A.S., Seifert K.A., Samson R.A. Indoor fungal composition is geographically patterned and more diverse in temperate zones than in the tropics. PNAS. 2010;107:13748–13753. - PMC - PubMed
    1. Andersen B., Frisvad J.C., Søndergaard I. Associations between fungal species and water-damaged building materials. Applied and Environmental Microbiology. 2011;77:4180–4188. - PMC - PubMed

LinkOut - more resources