. 2014 Sep;1(9):679-91.
doi: 10.1002/acn3.97. Epub 2014 Sep 30.

Subplate in a rat model of preterm hypoxia-ischemia

Affiliations

Subplate in a rat model of preterm hypoxia-ischemia

Chika Okusa et al. Ann Clin Transl Neurol. 2014 Sep.

Abstract

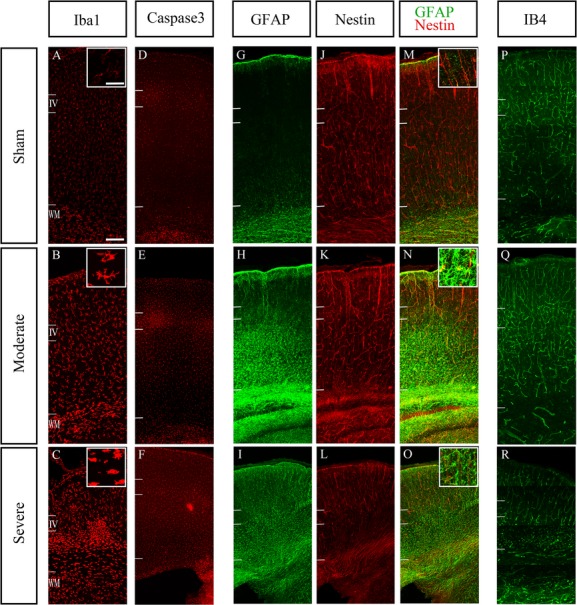
Objective: Hypoxia-ischemia (HI) in preterm infants primarily leads to injuries in the cerebral white matter. However, there is growing evidence that perinatal injury in preterms can also involve other zones including the cortical gray matter. In a neonatal rat model of HI, selective vulnerability of subplate has been suggested using BrdU birth-dating methods. In this study, we aimed to investigate the neuropathological changes of the subplate and deep layers of the cortex following cerebral HI in neonatal rats with specific cell markers.

Methods: P2 rats underwent permanent occlusion of the right common carotid artery followed by a period of hypoxia. P8 rats were analyzed using immunohistochemistry; subplate and deep layers cells were quantified and compared with sham-operated case.

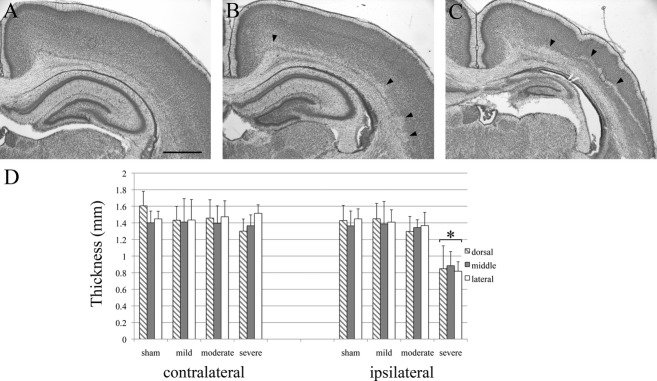
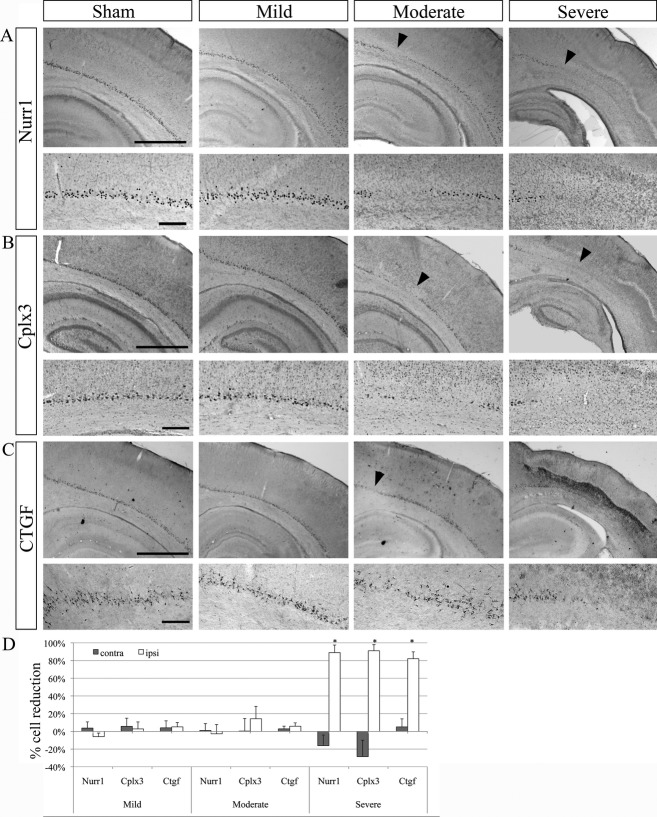
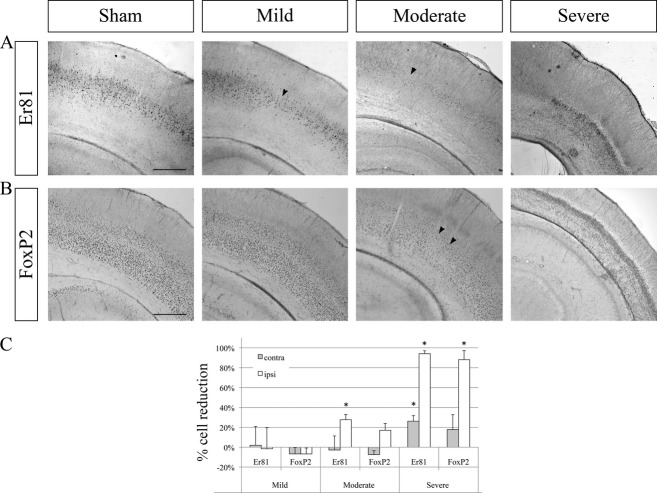
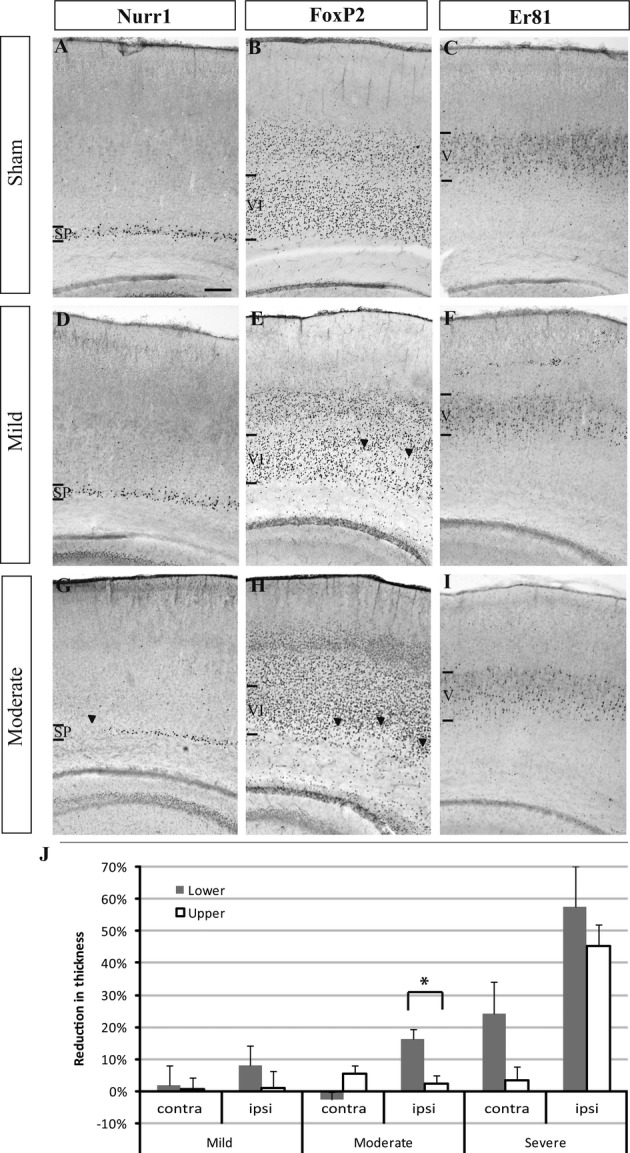
Results: A large variability in the extent of the cerebral injury was apparent. For the three analyzed subplate populations (Nurr1+, Cplx3+, and Ctgf+ cells), no significant cell reduction was observed in mild and moderate cases. Only in severe cases, subplate cells were strongly affected, but these injuries were always accompanied by the cell reductions in layers VI and V.

Interpretation: We could therefore not confirm a specific vulnerability of subplate cells compared to other deep layers or the white matter in our model.


Figures

Figure 1
Figure 1
Histological assessment of cortical injuries after hypoxia–ischemia. Cresyl-violet-stained sections from the ipsilateral hemispheres at P8 after hypoxia–ischemia at P2. Sections at the level of the somatosensory cortex in a mildly (A), a moderately (B), and a severely affected brain (C). In the mild case (A), structural and cellular morphologies appear normal. In the moderate case (B), small patches of necrotic cells and cell loss are visible in and above the subplate zone (arrowheads). In the severe case, a large band of necrotic cells spans the lower cortical layers and a prominent scar crosses the cortical wall. The hippocampus is severely degenerated (C). Scale bar: 1 mm. (D) Quantification of the cortical thickness. There is no observable difference in cortical thickness between ipsi and contralateral cortices in sham, and mild cases. In moderate cases, there is a trend for a slight reduction in thickness compared to the contralateral side. In severe cases, the cortical thickness at all locations (dorso-medial, middle, and lateral) is significantly reduced compared to sham cases. There was no significant difference among dorso-medial, middle, and lateral areas. Asterisks (*) indicate significant difference in thickness, most probably due to cell death, compared to ipsilateral sham controls (P < 0.05). Error bars are SEM.
Figure 2
Figure 2
Changes in Nurr1+, Cplx3+, and Ctgf+ subplate cell populations after hypoxia–ischemia. Examples of Nurr1 (A), Cplx3 (B), and Ctgf (C) immunoreactive subplate cells in the ipsilateral hemisphere of sham (control) and mild, moderate and severe cases after hypoxia–ischemia. In the mild case, subplate cell populations appear unaffected. In the moderate case, a few patches of cell loss are visible in the subplate with all of markers (arrowheads). In the severe case, only subplate cells in the most dorso-medial cortex are preserved. Scale bars: 1 mm (large panels); 200 μm (small panels). Quantification of cell death of Nurr1+, Cplx3+, and Ctgf+ in the ipsi- and contralateral hemispheres compared to sham controls (D). In the ipsilateral cortex of severe cases, a large proportion of Cplx3+, Nurr1+, and Ctgf+ cells underwent cell death (~80%). n = 7 (mild), five (moderate), and five (severe) for Nurr1 and Cplx3; n = 4 for Ctgf. Error bars are SEM. Asterisks (*) indicate significant cell death compared to sham controls (P < 0.05).
Figure 3
Figure 3
Changes in deep cortical layer IV–VI cell populations after hypoxia–ischemia. Examples of Er81 immunoreactivity labeling layer VI (A), for the immunoreactivity for FoxP2 labeling layer VI (B) in the ipsilateral hemisphere of sham (control) and mild, moderate, and severe case after hypoxia–ischemia. In the mild case, the FoxP2+ layer VI appears unaffected while a few patches of cell loss are seen in the Er81+ layer V (arrowhead). In the moderate case, cell loss is visible in the Er81+ layer V and the FoxP2+ layer VI (arrowhead). In severe cases, a very large proportion of Er81+ and FoxP2+ cells underwent cell death. Scale bar: 500 μm. (C) Quantification of differences in Er81+ and FoxP2+ cell numbers in the ipsi- and contralateral hemispheres compared to sham controls. In severe cases, a large proportion of Er81+ and FoxP2+ cells underwent cell death (~90%). Error bars are SEM. Asterisks (*) indicate significant cell death compared to sham controls (P < 0.05).
Figure 4
Figure 4
Thickness of deep cortical layers V and VI after hypoxia–ischemia. Examples of immunohistochemistry signals of the subplate (SP) marker Nurr1 (A, D, and G), the layer VI marker FoxP2 (B, E, and H) and the layer V marker Er81 (C, F, and I) in the ipsilateral hemisphere of sham (control) and mild and moderate cases after hypoxia–ischemia. In the mild case (D–F), the Nurr1+ SP appears unaffected (D) while a few patches of cell loss are seen in the Foxp2+ layer VI (E, arrowheads). In the moderate case (G–I), cell loss is visible in the Nurr1+ SP (G) and the FoxP2+ layer VI (H) (arrowheads). Staining for Er81 in layer V appears less dense (I) than in the sham control (C). Scale bar: 200 μm. (J) Quantification of the reduction in thickness of upper and lower layers in the ipsilateral (IL) and contralateral (CL) cortex compared to sham controls. In the IL hemisphere of mild and moderate cases, reduction in thickness was more pronounced for the lower layers than the upper layers. This difference reached statistical significance for moderate cases (indicated by an asterisk *, P = 0.008). In severe cases, the thickness of lower layers was reduced both ipsi- as well as contralaterally, and the upper layer thickness was reduced on the ipsilateral side. Error bars are SEM.
Figure 5
Figure 5
Changes in white matter and oligodendrocytes after hypoxia–ischemia. Examples of immunohistochemistry signals of MBP+ oligodendrocytes and cortical white matter in the ipsilateral hemisphere of sham (control) (A) and mild (B), moderate (C), and severe cases (D) after hypoxia–ischemia. In the mild case (B), MBP+ cells and fibers are reduced in length in the lateral cortex compared to the sham control (arrowheads). In the moderate case (C), the lesioned area in layer V/VI is filled with MBP+ cells. The insert in (C) shows the morphology of two of these cells. In the severe case (D), the entire cortex below the scar contains MBP+ cells. These cells appear degenerated and do not have the same morphology as observed in moderate cases. (E) Immunohistochemistry signals of MBP and IB4 within the cortical lesion. The MBP+ cells (green, filled arrowheads) filling the lesions in moderate cases (C) do not coexpress the microglial marker IB4 (red, empty arrowheads) and the two cell types have very different morphologies. Scale bars: 1 mm (A–D); 50 μm (E and insert in C).
Figure 6
Figure 6
Measures of cell death and inflammation. Immunoreactivity imaged with confocal microscopy for the microglial marker Iba1 (A–C), the apoptotic cell death marker cleaved caspase3 (D–F), the astrocyte marker GFAP (G–I), Nestin (J–L) and IB4 as a marker of endothelial cells to delineate blood vessels (P–R) in the ipsilateral hemisphere after HI in sham (upper row), moderate (middle row), and severe (lower row) cases. Qualitative analysis suggests a larger number of Iba1+ cell in the moderate case (B) compared to sham (A). Moreover, the labeled cells exhibited hypertrophic bodies and concentrated below the layer IV in severe case (C). Caspase3+ cells appear more abundant in moderate and severe cases compared to sham (D–F). Caspase3 immunoreactivity appears strongest in layer 4, but it was observed across the entire depth of cortex, suggesting an increase in apoptosis in all layers of the cortex after HI. GFAP immunoreactive astrocytes were distributed within white matter and deep layers in moderate case (H), but in severe case, GFAP+ cell were extending into the entire thickness of the cortex (I). In the severe case, Nestin+ cells are less frequent than sham in deep layers (L). In the moderate case (Q), IB4 immunoreactive blood vessels were more abundant and possibly also more branched compared to sham cases (P). The density of labeled structures was similar between sham (P) and severe cases (R), but the IB4+ structures did not have the appearance of normal blood vessels in the deep layers. Scale bars: 50 μm (A–L), 200 μm (M–R).

References

    1. Inder TE, Volpe JJ. Mechanisms of perinatal brain injury. Semin Neonatal. 2000;5:3–16. - PubMed
    1. Khawaja O, Volpe JJ. Pathogenesis of cerebral white matter injury of prematurity. Arch Dis Child Fetal Neonatal Ed. 2008;93:F153–F161. - PMC - PubMed
    1. Eastwood SL, Harrison PJ. Interstitial white matter neuron density in the dorsolateral prefrontal cortex and parahippocampal gyrus in schizophrenia. Schizophr Res. 2005;79:181–188. - PubMed
    1. McQuillen PS, Ferriero DM. Selective vulnerability in the developing central nervous system. Pediatr Neurol. 2004;30:227–235. - PubMed
    1. Kostović I, Judaš M, Radoš M, et al. Laminar organization of the human fetal cerebrum revealed by histochemical markers and magnetic resonance imaging. Cereb Cortex. 2002;12:536–544. - PubMed