

Open-source three-dimensional printing of biodegradable polymer scaffolds for tissue engineering
- PMID: 25493313
- PMCID: PMC4266185
- DOI: 10.1002/jbm.a.35108
Open-source three-dimensional printing of biodegradable polymer scaffolds for tissue engineering
Abstract
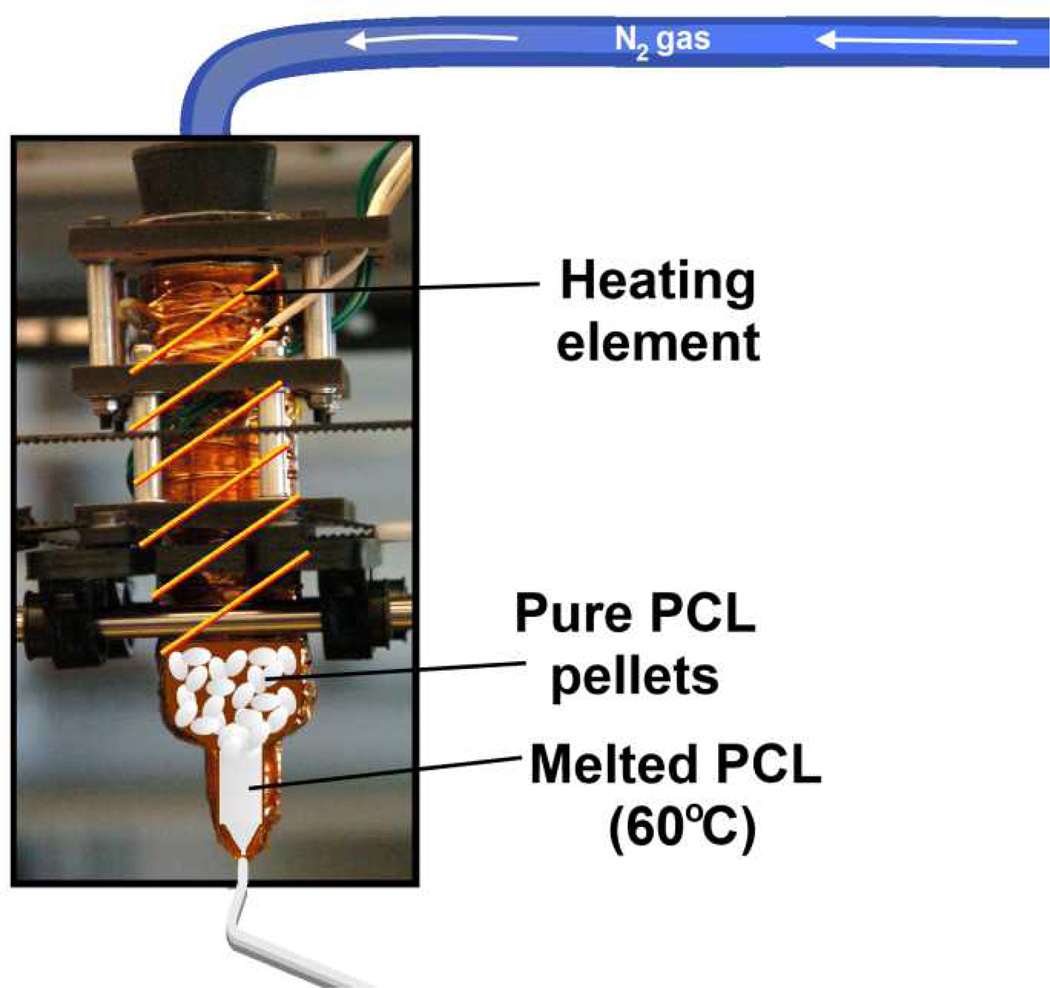
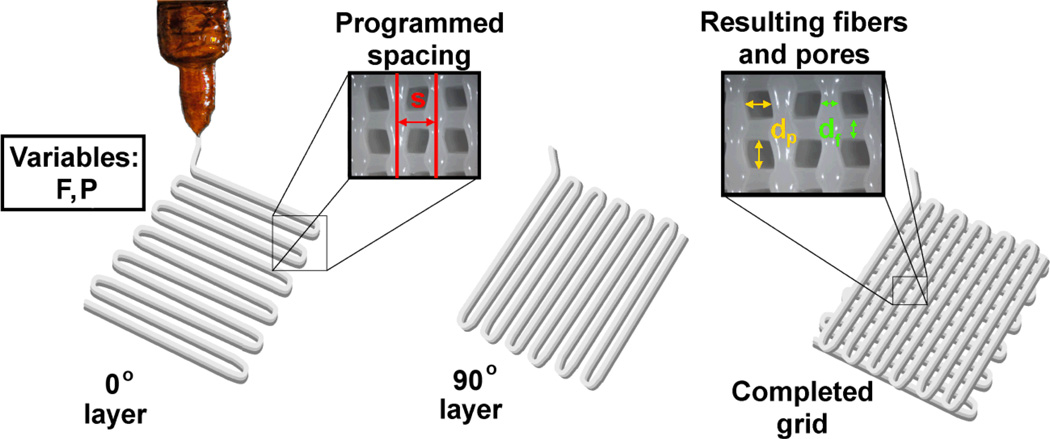
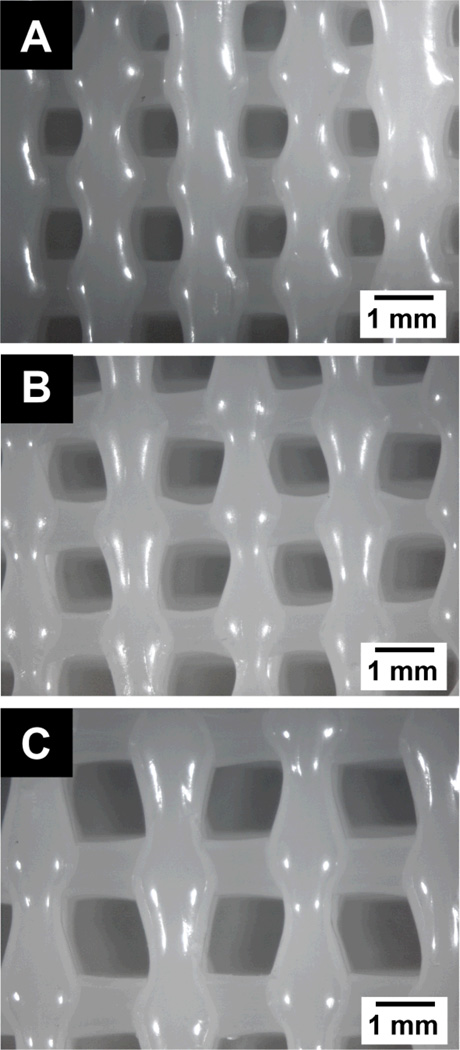
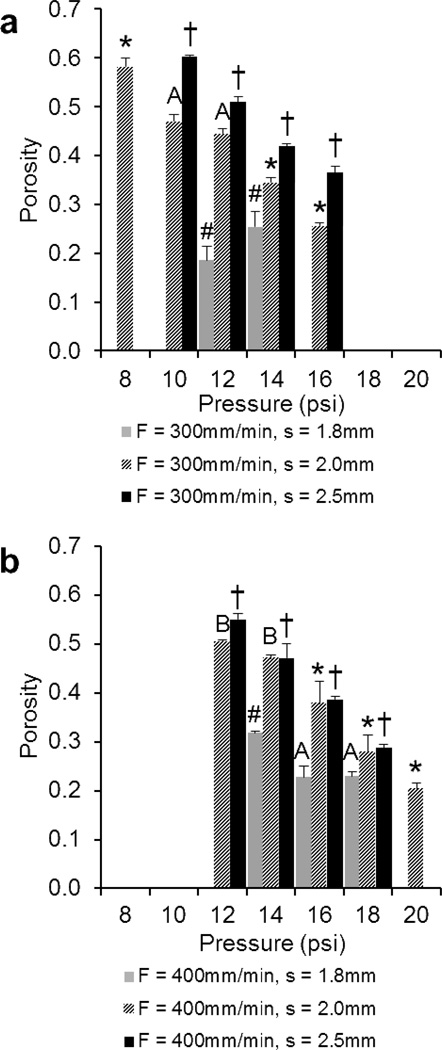
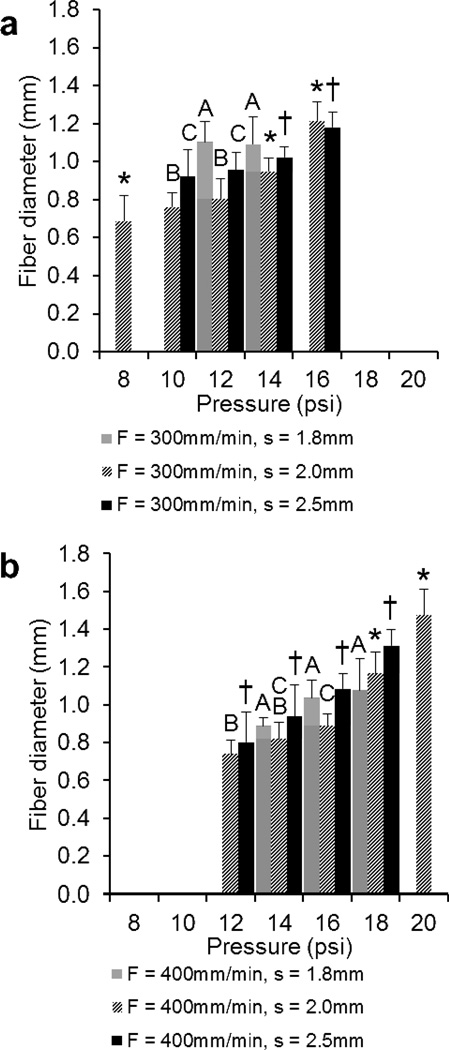
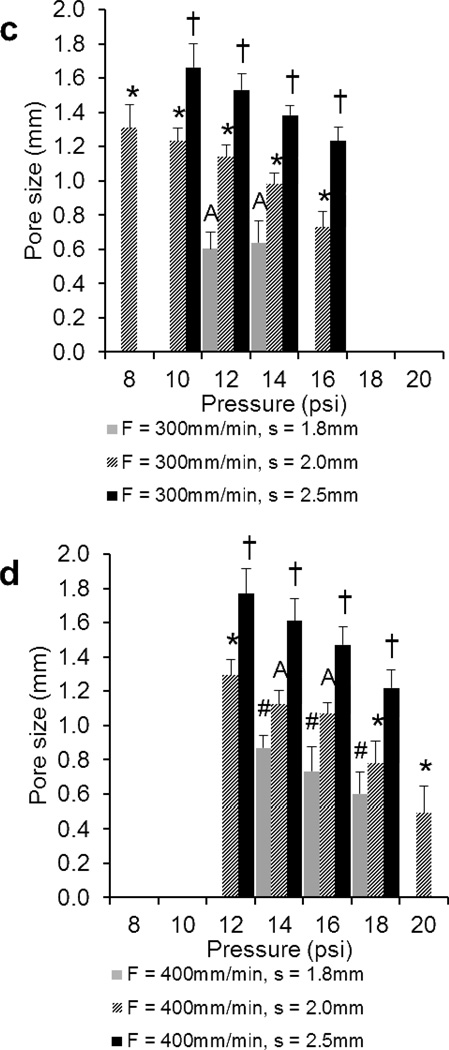
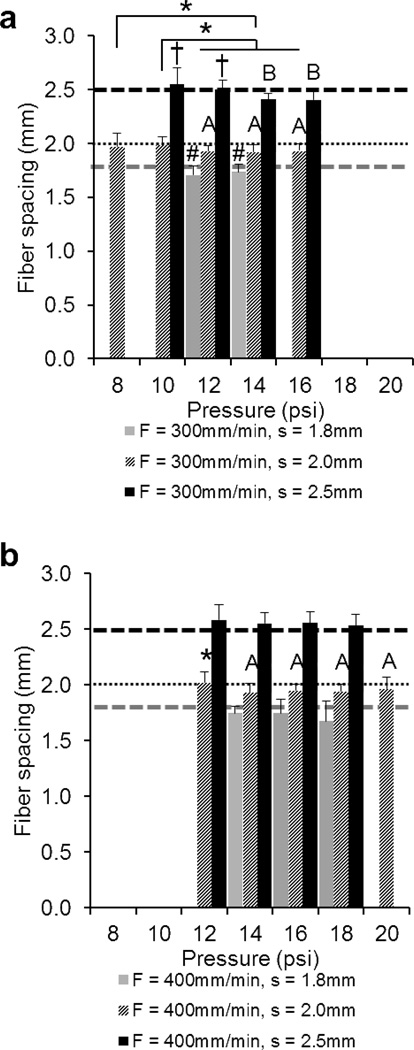
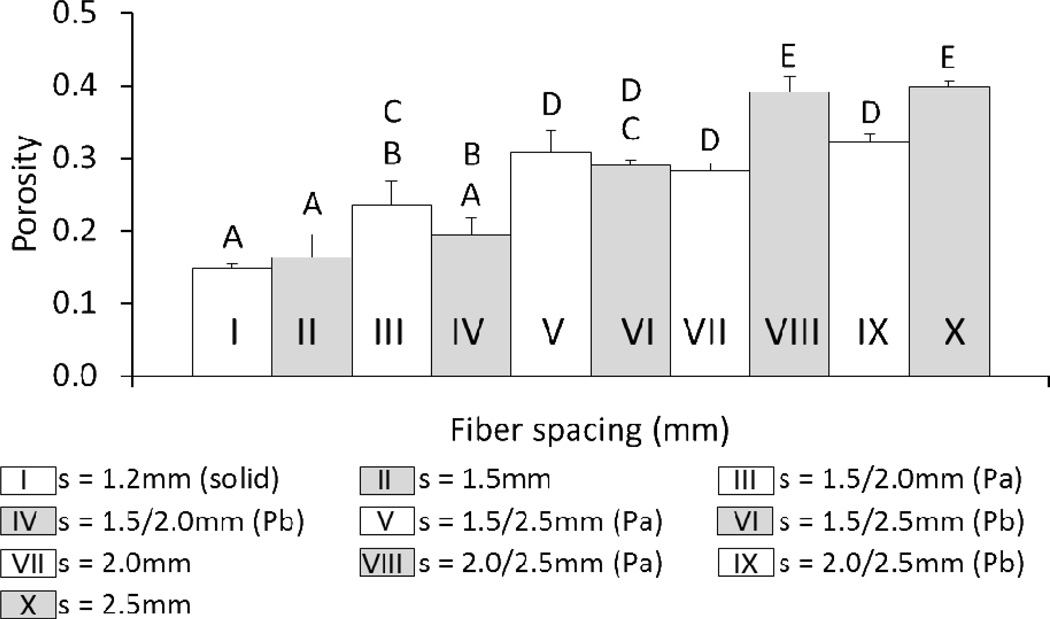
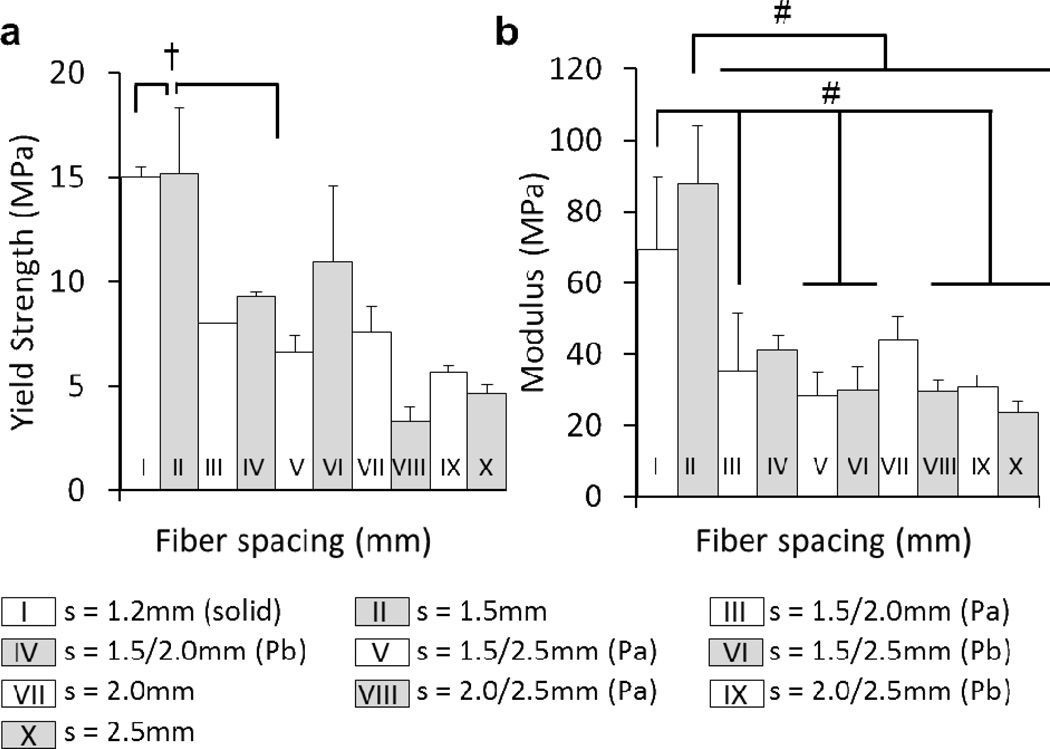
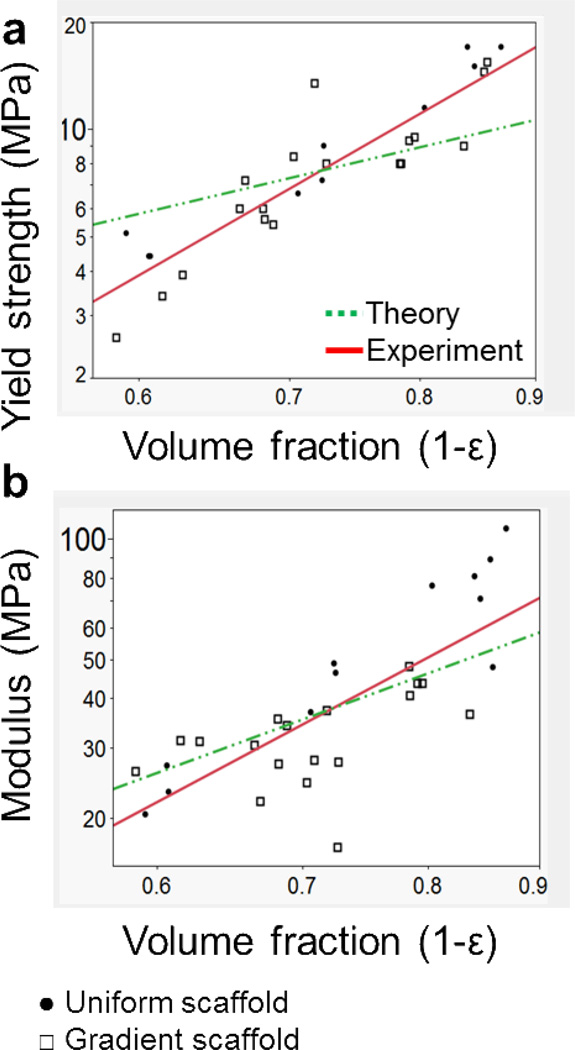
The fabrication of scaffolds for tissue engineering requires elements of customization depending on the application and is often limited due to the flexibility of the processing technique. This investigation seeks to address this obstacle by utilizing an open-source three-dimensional printing (3DP) system that allows vast customizability and facilitates reproduction of experiments. The effects of processing parameters on printed poly(ε-caprolactone) scaffolds with uniform and gradient pore architectures have been characterized with respect to fiber and pore morphology and mechanical properties. The results demonstrate the ability to tailor the fiber diameter, pore size, and porosity through modification of pressure, printing speed, and programmed fiber spacing. A model was also used to predict the compressive mechanical properties of uniform and gradient scaffolds, and it was found that modulus and yield strength declined with increasing porosity. The use of open-source 3DP technologies for printing tissue-engineering scaffolds provides a flexible system that can be readily modified at a low cost and is supported by community documentation. In this manner, the 3DP system is more accessible to the scientific community, which further facilitates the translation of these technologies toward successful tissue-engineering strategies.
Figures
Similar articles
-
Fabrication and mechanical characterization of 3D printed vertical uniform and gradient scaffolds for bone and osteochondral tissue engineering.Acta Biomater. 2019 May;90:37-48. doi: 10.1016/j.actbio.2019.03.041. Epub 2019 Mar 21. Acta Biomater. 2019. PMID: 30905862 Free PMC article.
-
Additive Manufacturing of a Photo-Cross-Linkable Polymer via Direct Melt Electrospinning Writing for Producing High Strength Structures.Biomacromolecules. 2016 Jan 11;17(1):208-14. doi: 10.1021/acs.biomac.5b01316. Epub 2015 Dec 8. Biomacromolecules. 2016. PMID: 26620885
-
Effects of poly (ε-caprolactone) coating on the properties of three-dimensional printed porous structures.J Mech Behav Biomed Mater. 2017 Jun;70:68-83. doi: 10.1016/j.jmbbm.2016.04.035. Epub 2016 May 4. J Mech Behav Biomed Mater. 2017. PMID: 27233445
-
Design and Structure-Function Characterization of 3D Printed Synthetic Porous Biomaterials for Tissue Engineering.Adv Healthc Mater. 2018 Apr;7(7):e1701095. doi: 10.1002/adhm.201701095. Epub 2017 Dec 27. Adv Healthc Mater. 2018. PMID: 29280325 Review.
-
Recent advances in 3D-printed polylactide and polycaprolactone-based biomaterials for tissue engineering applications.Int J Biol Macromol. 2022 Oct 1;218:930-968. doi: 10.1016/j.ijbiomac.2022.07.140. Epub 2022 Jul 24. Int J Biol Macromol. 2022. PMID: 35896130 Review.
Cited by
-
Engineering Breast Cancer Microenvironments and 3D Bioprinting.Front Bioeng Biotechnol. 2018 May 24;6:66. doi: 10.3389/fbioe.2018.00066. eCollection 2018. Front Bioeng Biotechnol. 2018. PMID: 29881724 Free PMC article. Review.
-
Engineering cancer microenvironments for in vitro 3-D tumor models.Mater Today (Kidlington). 2015 Dec;18(10):539-553. doi: 10.1016/j.mattod.2015.05.002. Mater Today (Kidlington). 2015. PMID: 28458612 Free PMC article.
-
3D printing for the design and fabrication of polymer-based gradient scaffolds.Acta Biomater. 2017 Jul 1;56:3-13. doi: 10.1016/j.actbio.2017.03.030. Epub 2017 Mar 22. Acta Biomater. 2017. PMID: 28342878 Free PMC article. Review.
-
Review of additive manufactured tissue engineering scaffolds: relationship between geometry and performance.Burns Trauma. 2018 Jul 3;6:19. doi: 10.1186/s41038-018-0121-4. eCollection 2018. Burns Trauma. 2018. PMID: 29988731 Free PMC article. Review.
-
Imaging stem cell distribution, growth, migration, and differentiation in 3-D scaffolds for bone tissue engineering using mesoscopic fluorescence tomography.Biotechnol Bioeng. 2018 Jan;115(1):257-265. doi: 10.1002/bit.26452. Biotechnol Bioeng. 2018. PMID: 28921540 Free PMC article.
References
-
- Kohane DS, Langer R. Polymeric biomaterials in tissue engineering. Pediatr. Res. 2008;63(5):487–491. - PubMed
-
- Pham QP, Sharma U, Mikos AG. Electrospun poly(epsilon-caprolactone) microfiber and multilayer nanofiber/microfiber scaffolds: characterization of scaffolds and measurement of cellular infiltration. Biomacromolecules. 2006;7(10):2796–2805. - PubMed
Publication types
MeSH terms
Substances
Grants and funding
LinkOut - more resources
Full Text Sources
Other Literature Sources
