. 2014 Dec 10:5:5619.
doi: 10.1038/ncomms6619.

An epigenomic roadmap to induced pluripotency reveals DNA methylation as a reprogramming modulator

Affiliations

An epigenomic roadmap to induced pluripotency reveals DNA methylation as a reprogramming modulator

Dong-Sung Lee et al. Nat Commun. .

Abstract

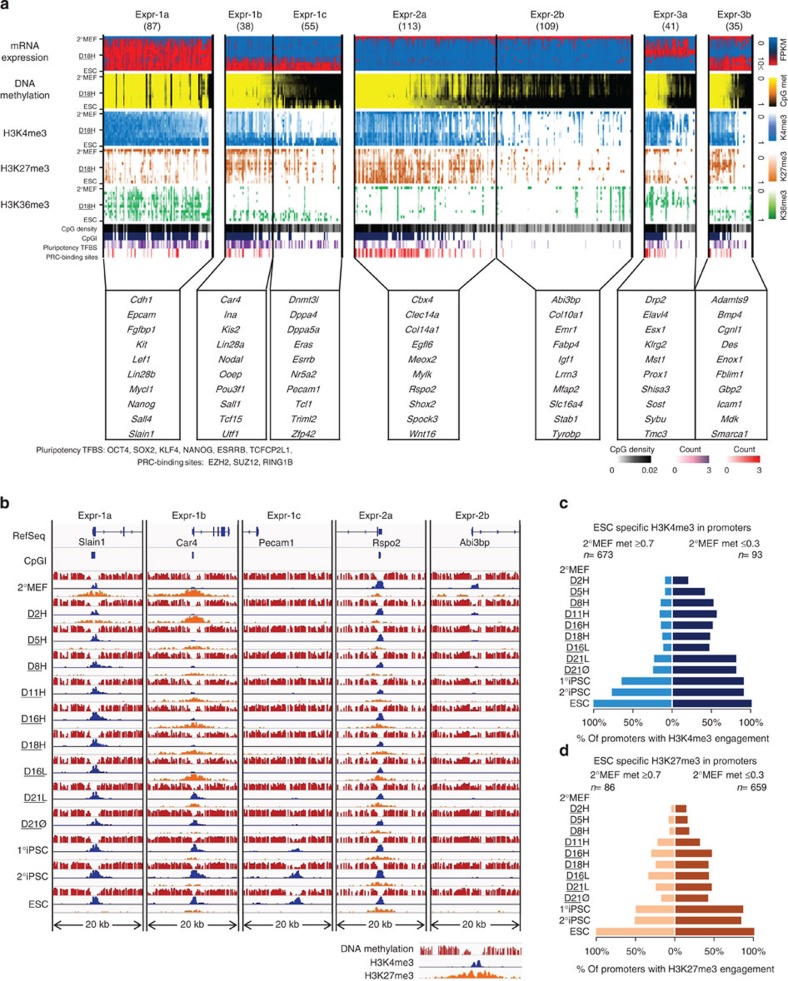
Reprogramming of somatic cells to induced pluripotent stem cells involves a dynamic rearrangement of the epigenetic landscape. To characterize this epigenomic roadmap, we have performed MethylC-seq, ChIP-seq (H3K4/K27/K36me3) and RNA-Seq on samples taken at several time points during murine secondary reprogramming as part of Project Grandiose. We find that DNA methylation gain during reprogramming occurs gradually, while loss is achieved only at the ESC-like state. Binding sites of activated factors exhibit focal demethylation during reprogramming, while ESC-like pluripotent cells are distinguished by extension of demethylation to the wider neighbourhood. We observed that genes with CpG-rich promoters demonstrate stable low methylation and strong engagement of histone marks, whereas genes with CpG-poor promoters are safeguarded by methylation. Such DNA methylation-driven control is the key to the regulation of ESC-pluripotency genes, including Dppa4, Dppa5a and Esrrb. These results reveal the crucial role that DNA methylation plays as an epigenetic switch driving somatic cells to pluripotency.


Figures

Figure 1
Figure 1. Experimental and computational analysis overview of the study.
(a) Establishment of secondary system and sample collection. (b) MethylC-Seq was performed on samples from secondary system. DMRs were identified. RNA-Seq and ChIP-Seq data were integrated with MethylC-Seq data based on transcripts. (c) Base-level visualization of DNA methylation and histone distribution around Dppa2.
Figure 2
Figure 2. DMRs and features affecting DNA methylation change during reprogramming.
(a) Hierarchical clustering based on the DNA methylation level of DMRs in each sample. Each DMR was centred with the mean and normalized. DMRs were clustered into six groups based on pairwise correlations. (b) Base-level visualization of two DMRs from group DMR-3b in the promoter regions of Dppa4 and Dppa2, known ESC-pluripotency predictor genes. (c) DMR accumulation during reprogramming. DMRs were defined as hyper- and hypo-DMRs at each time point. Dark red and dark blue bars represent ESC-specific Hyper- and Hypo-DMRs. Other colours indicate Hyper- and Hypo-DMRs in the order of left to right. (d) Proportion of DMRs containing various genomic features. (e) Fold enrichment of examined genomic features within DMRs. (f) Percentage of DMRs containing H3K4me3 or H3K27me3 based on the methylation level (low-methylated ≤30%, high-methylated ≥70%).
Figure 3
Figure 3. Histone modification and DNA methylation change at transcription factor-binding sites.
RNA expression level (FPKM) of transcription factors (line plots), average DNA methylation change (upper bar plots), average H3K4me3 change (blue bar plots) and average H3K27me3 change (red bar plots) at binding sites of each transcription factor. Selected transcriptionally active genes during high-dox treatment (blue box), transcriptionally silent genes during high-dox treatment (green box) and polycomb repressive complexes (red box) are shown.
Figure 4
Figure 4. Histone modification and DNA methylation change around transcription factor-binding sites.
Average DNA methylation change (left), average H3K4me3 change (middle) and average H3K27me3 change (right) in the 80-kb neighbourhood of transcription factor-binding sites.
Figure 5
Figure 5. Epigenetic features of gene classes and model of gene expression control.
(a) Genes were separated into clusters based on gene expression patterns and DNA methylation. The heatmap presents mRNA expression, DNA methylation level of promoter regions, normalized H3K4me3 level, normalized H3K27me3 level, CpG densities, pluripotency transcription factor-binding sites and binding sites of PRCs. (b) Base-level visualization of DNA methylation and histone modifications in the promoter regions of representative genes for each class across all samples. (c) Percentage of ESC-specific H3K4me3 mark for promoters with high and low initial methylation. (d) Percentage of ESC-specific H3K27me3 mark for promoters with high and low initial methylation.
Figure 6
Figure 6. A model summarizing DNA methylation and histone modification-driven control of gene expression.
Dashed arrow represents the strict control of demethylation. Gene classes affected by changes are shown in brackets accompanying arrows.

References

    1. Takahashi K. & Yamanaka S. Induction of pluripotent stem cells from mouse embryonic and adult fibroblast cultures by defined factors. Cell 126, 663–676 (2006). - PubMed
    1. Maherali N. et al.. Directly reprogrammed fibroblasts show global epigenetic remodeling and widespread tissue contribution. Cell Stem Cell 1, 55–70 (2007). - PubMed
    1. Takahashi K. et al.. Induction of pluripotent stem cells from adult human fibroblasts by defined factors. Cell 131, 861–872 (2007). - PubMed
    1. Yu J. et al.. Induced pluripotent stem cell lines derived from human somatic cells. Science 318, 1917–1920 (2007). - PubMed
    1. Park I. H. et al.. Reprogramming of human somatic cells to pluripotency with defined factors. Nature 451, 141–146 (2008). - PubMed

LinkOut - more resources