

Surface imaging-based analysis of intrafraction motion for breast radiotherapy patients
- PMID: 25493520
- PMCID: PMC5711123
- DOI: 10.1120/jacmp.v15i6.4957
Surface imaging-based analysis of intrafraction motion for breast radiotherapy patients
Abstract
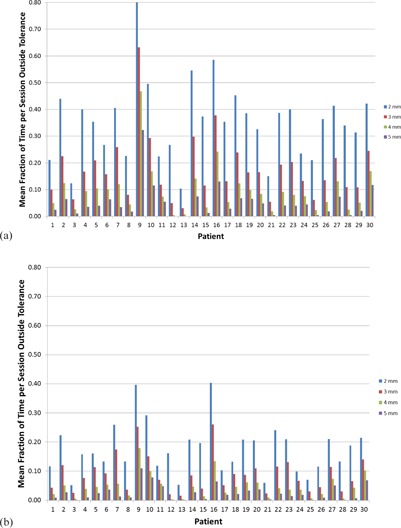
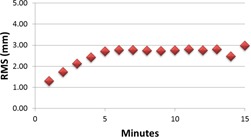
Breast treatments are becoming increasingly complex as the use of modulated and partial breast therapies becomes more prevalent. These methods are predicated on accurate and precise positioning for treatment. However, the ability to quantify intrafraction motion has been limited by the excessive dose that would result from continuous X-ray imaging throughout treatment. Recently, surface imaging has offered the opportunity to obtain 3D measurements of patient position throughout breast treatments without radiation exposure. Thirty free-breathing breast patients were monitored with surface imaging for 831 monitoring sessions. Mean translations and rotations were calculated over each minute, each session, and over all sessions combined. The percentage of each session that the root mean squares (RMS) of the linear translations were outside of defined tolerances was determined for each patient. Correlations between mean translations per minute and time, and between standard deviation per minute and time, were evaluated using Pearson's r value. The mean RMS translation averaged over all patients was 2.39 mm ± 1.88 mm. The patients spent an average of 34%, 17%, 9%, and 5% of the monitoring time outside of 2 mm, 3 mm, 4 mm, and 5 mm RMS tolerances, respectively. The RMS values averaged over all patients were 2.71 mm ± 1.83 mm, 2.76 ± 2.27, and 2.98 mm ± 2.30 mm over the 5th, 10th, and 15th minutes of monitoring, respectively. The RMS values (r = 0.73, p = 0) and standard deviations (r = 0.88, p = 0) over all patients showed strong significant correlations with time. We see that the majority of patients' treatment time is spent within 5 mm of the isocenter and that patient position drifts with increasing treatment time. Treatment length should be consid- ered in the planning process. An 8 mm margin on a target volume would account for 2 SDs of motion for a treatment up to 15 minutes in length.
Figures


References
-
- Van Tienhoven G, Lanson JH, Crabeels D, Heukelom S, Mijnheer BJ. Accuracy in tangential breast treatment set‐up: a portal imaging study. Radiother Oncol. 1991;22(4):317–22. - PubMed
-
- Fein DA, McGee KP, Schultheiss TE, Fowble BL, Hanks GE. Intra‐ and interfractional reproducibility of tangential breast fields: a prospective on‐line portal imaging study. Int J Radiat Oncol Biol Phys. 1996;34(3):733–40. - PubMed
-
- Kron T, Lee C, Perera F, Yu E. Evaluation of intra‐ and inter‐fraction motion in breast radiotherapy using electronic portal cine imaging. Technol Cancer Res Treat. 2004;3(5):443–49. - PubMed
-
- Koseoglu FG, Tuncel N, Kizildag AU, Garipagaoglu M, Adli M, Andic C. Assessment of setup accuracy in patients receiving postmastectomy radiotherapy using electronic portal imaging. Radiat Med. 2007;25(2):45–52. - PubMed
-
- Thilmann C, Adamietz IA, Saran F, Mose S, Kostka A, Böttcher HD. The use of a standardized positioning support cushion during daily routine of breast irradiation. Int J Radiat Oncol Biol Phys. 1998;41(2):459–63. - PubMed
MeSH terms
LinkOut - more resources
Full Text Sources
Other Literature Sources
Medical
