. 2014 Dec 10;9(12):e114573.
doi: 10.1371/journal.pone.0114573. eCollection 2014.

Dose-Dependent AMPK-Dependent and Independent Mechanisms of Berberine and Metformin Inhibition of mTORC1, ERK, DNA Synthesis and Proliferation in Pancreatic Cancer Cells

Affiliations

Dose-Dependent AMPK-Dependent and Independent Mechanisms of Berberine and Metformin Inhibition of mTORC1, ERK, DNA Synthesis and Proliferation in Pancreatic Cancer Cells

Ming Ming et al. PLoS One. .

Abstract

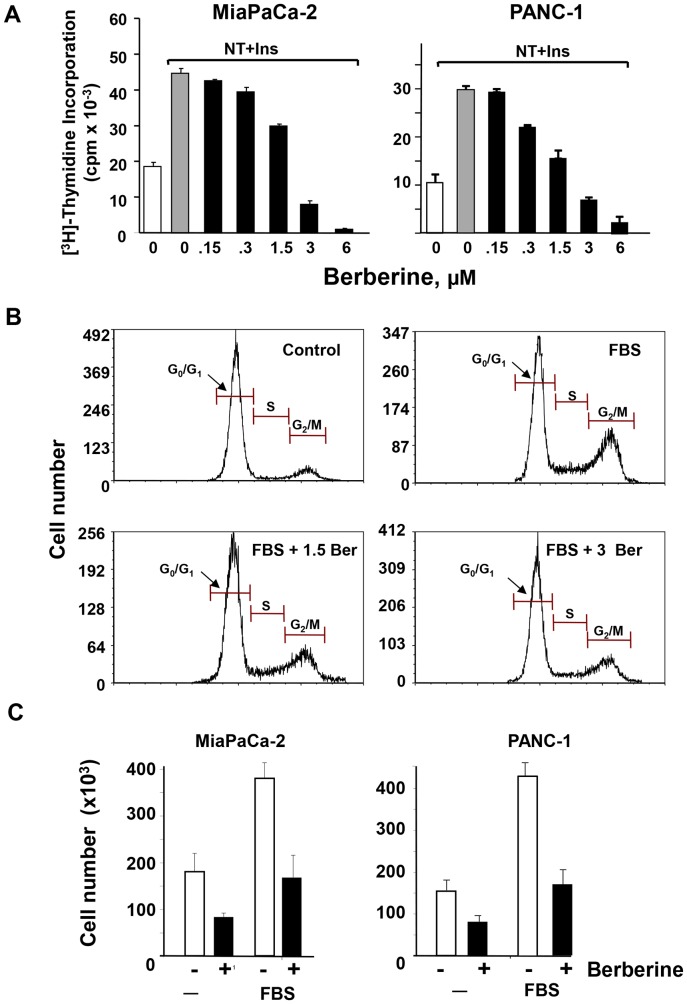
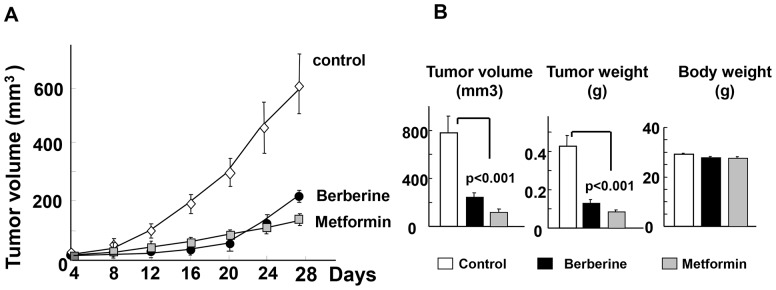
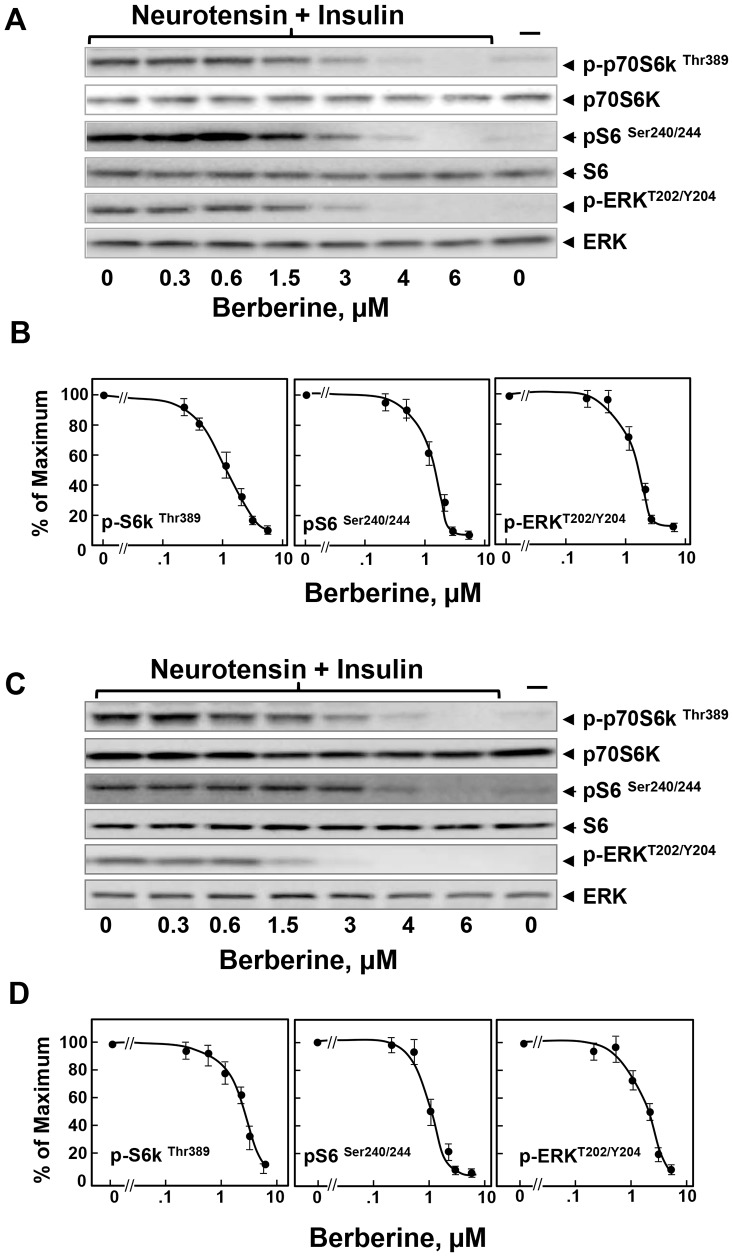
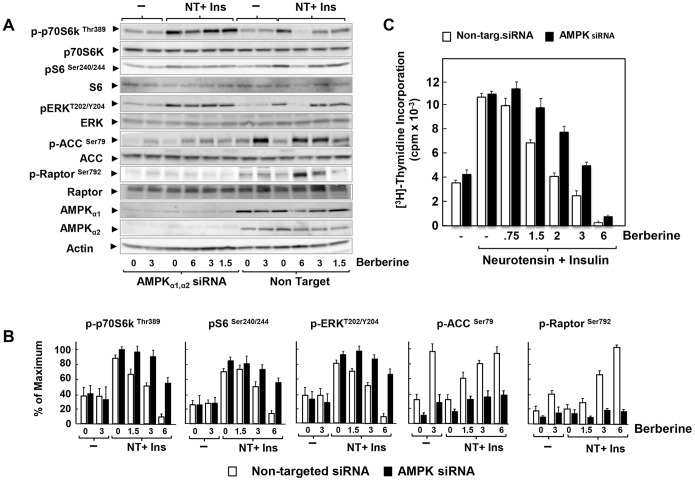
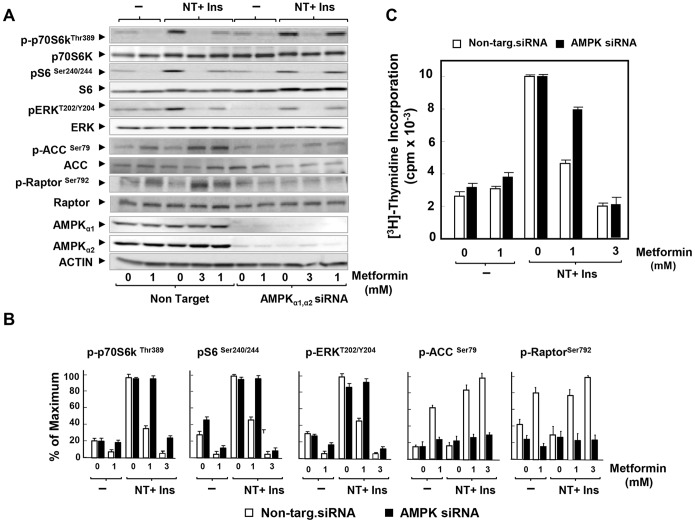
Natural products represent a rich reservoir of potential small chemical molecules exhibiting anti-proliferative and chemopreventive properties. Here, we show that treatment of pancreatic ductal adenocarcinoma (PDAC) cells (PANC-1, MiaPaCa-2) with the isoquinoline alkaloid berberine (0.3-6 µM) inhibited DNA synthesis and proliferation of these cells and delay the progression of their cell cycle in G1. Berberine treatment also reduced (by 70%) the growth of MiaPaCa-2 cell growth when implanted into the flanks of nu/nu mice. Mechanistic studies revealed that berberine decreased mitochondrial membrane potential and intracellular ATP levels and induced potent AMPK activation, as shown by phosphorylation of AMPK α subunit at Thr-172 and acetyl-CoA carboxylase (ACC) at Ser79. Furthermore, berberine dose-dependently inhibited mTORC1 (phosphorylation of S6K at Thr389 and S6 at Ser240/244) and ERK activation in PDAC cells stimulated by insulin and neurotensin or fetal bovine serum. Knockdown of α1 and α2 catalytic subunit expression of AMPK reversed the inhibitory effect produced by treatment with low concentrations of berberine on mTORC1, ERK and DNA synthesis in PDAC cells. However, at higher concentrations, berberine inhibited mitogenic signaling (mTORC1 and ERK) and DNA synthesis through an AMPK-independent mechanism. Similar results were obtained with metformin used at doses that induced either modest or pronounced reductions in intracellular ATP levels, which were virtually identical to the decreases in ATP levels obtained in response to berberine. We propose that berberine and metformin inhibit mitogenic signaling in PDAC cells through dose-dependent AMPK-dependent and independent pathways.


Conflict of interest statement

Competing Interests: The authors have declared that no competing interests exist.

Figures

Figure 1
Figure 1. Berberine inhibits DNA synthesis, cell cycle progression and proliferation in PANC-1 and Mia PaCa-2 cells.
A, Mia PaCa-2 or PANC-1 cells were incubated without (open bars) or with 5 nM neurotensin and 10 ng/ml insulin (closed bars) in the presence of increasing concentration of berberine for 17 h at 37°C prior to the addition of [3H]-thymidine for 6 h. The radioactivity incorporated into acid-insoluble pools was measured in a scintillation counter, as described in “Materials and Methods. The values shown are the mean ± SEM obtained in 3 independent experiments; B, PANC-1 cells were treated without (control) or with berberine at 1.5 µM or 3 µM in medium containing 2.5% FBS for 3 days (indicated by cont., FBS, FBS +1.5 Ber and FBS +3 Ber). Cell cycle was analyzed by PI-staining and flow cytometry. Similar results were obtained in 3 independent experiments. C, Single-cell suspension of Mia PaCa-2 or PANC-1 cells were plated on tissue culture dishes at a density of 2×10⁴ cells per dish. After 24 h of incubation the medium was removed and the cultures shifted to medium without or with 3% FBS in the absence (open bars) or presence (closed bars) of 3 µM berberine. The cultures were incubated for 4 days as described in “Materials and Methods”. Cell count was determined from 4 to 6 replicate plates per condition using a Coulter Counter. Results are presented as mean ± SEM of 3 biological replicates.
Figure 2
Figure 2. Berberine inhibits the growth of MiaPaCa-2 tumor xenografts as effectively as metformin.
Xenografts of MiaPaca-2 were generated by implantation of 2×10⁶ cells into the right flanks of male nu/nu mice. When the tumors reached a mean diameter of 2 mm the animals were randomized into control and treated groups (10 mice per group). Berberine was given once daily intraperitoneally at 5 mg/kg for the duration of the experiment. For comparison, metformin was given intraperitoneally to another group of mice at 250 mg/kg. The 1st day of treatment was designated as day 0. Control animals received an equivalent volume of saline. A, Tumor volumes were measured every 4 days as described in “Materials and Methods”. At the end of the experiment (day 29, the tumors were removed, weighted and measured and tumor volumes estimated as V = 0.52 (length × width × depth). The results are shown in panel B (mean ± SEM). Treatment of mice with berberine significantly reduced the volume and weight of the tumors as compared with the tumors from the control group (p<0.001), as indicated. A similar inhibition of tumor growth was obtained by administration of metformin (p<0.001). The curves corresponding to the growth of MiaPaca-2 xenografts in mice treated with berberine or metformin were superimposable during the first 24 days. At day 29, metformin was slightly more effective than berberine as assessed by tumor volume (p<0.05) but the difference of the effects between these drugs did not reach statistical significance (p>0.07) when scored by tumor weight (Fig. 2, B). At the concentrations used, berberine and metformin were well tolerated with no apparent toxicity based on body weight changes.
Figure 3
Figure 3. Berberine and metformin induce mitochondrial membrane depolarization, reduce ATP levels and activate AMPK in PDAC cells.
A, Cultures of PANC-1 and MiaPaca-2 cells were incubated in the absence or in the presence of 3 µM berberine (Berb) or 1 mM metformin (Met) for 17 h in DMEM containing 5 mM glucose. The change in mitochondrial membrane potential was measured using the mitochondrial membrane potential indicator JC-1. The results are expressed as an average ratio of red/green florescent intensity in a single visual field (mean ± SEM). At least 5 fields were studied in each condition. P values were determined using the t-test (SigmaPlot 12.); *p<0.002. B, Cultures of PANC-1 and MiaPaca-2 cells were incubated in the absence or in the presence of berberine or metformin at the indicated concentrations for 17 h in DMEM containing 5 mM glucose and 2.5% FBS. C, Cultures of PANC-1 (upper panels) and MiaPaCa-2 (lower panels) were incubated in the absence or in the presence of berberine at the indicated doses for 17 h. Then, the cells were stimulated for 1 h with 5 nM neurotensin and 10 ng/ml insulin and lysed with 2X SDS-PAGE sample buffer. The samples were analyzed by SDS-PAGE and immunoblotting with antibodies that detect the phosphorylated state of Acetyl-CoA Carboxylase (ACC) at Ser79. Western blotting for actin was used to verify equal loading in the same membrane and a separate gel confirmed that expression of total ACC protein was not changed by any of the treatments. D, Quantification was performed using Multi Gauge V3.0. The values represent the mean ± SEM; n = 3, fold increase in ACC phosphorylation at Ser79. Inset, phosphorylated state of AMPK at Thr172 at the indicated concentrations of berberine (µM).
Figure 4
Figure 4. Berberine inhibits mTORC1 signaling and ERK activation in PDAC cells.
Cultures of MiaPaCa-2 (Panels A and B) or PANC-1 cells (panels C and D) were incubated in the absence or in the presence of increasing concentrations of berberine. Then, the cells were stimulated for 1 h with 5 nM neurotensin and 10 ng/ml insulin and lysed with 2X SDS-PAGE sample buffer. The samples were analyzed by SDS-PAGE and immunoblotting with antibodies that detect the phosphorylated state of S6K at Thr389, S6 at Ser240/244, and ERK at Thr202 and Tyr204. Immunoblotting with total S6K, S6 and ERK was used to verify equal gel loading. The quantification of the immune signals was performed using Multi Gauge V3.0. The results are presented in the plots shown in panels B and D. The values represent the mean ± SEM (n = 3) of S6K, S6 and ERK phosphorylation expressed as a percentage of the maximal response obtained in 3 independent experiments.
Figure 5
Figure 5. Knockdown of the α subunits of AMPK reverses inhibition of mTORC1, ERK and DNA synthesis induced by low but not high doses of berberine.
A, PANC-1 cells were transfected with either non-targeting negative control (Non Target.) or 10 nM AMPKα1 and 10 nM AMPKα2 siRNA (AMPKα1, α2 siRNA) in DMEM containing 5 mM glucose and 10% FBS. After 3 days the cells were incubated either in the absence or presence of berberine for 17 h in serum free DMEM containing 5 mM glucose. Then, the cells were stimulated for 1 h with 5 nM neurotensin and 10 ng/ml insulin and lysed with 2X SDS-PAGE sample buffer. The samples were analyzed by SDS-PAGE and immunoblotting with the following phospho antibodies: S6K at Thr389, S6 at Ser240/244, and ERK at Thr202 and Tyr204, ACC at Ser79 and Raptor at Ser792. Shown here is a representative autoluminogram; similar results were obtained in 4 independent experiments. B, Quantification was performed using Multi Gauge V3.0. Results are expressed as the percentage of the maximum (mean ±SEM: n = 4). C, PANC-1 cells were transfected with either non-targeting negative control (open bars) or 10 nM AMPKα1 and 10 nM AMPKα2 siRNA (black bars) in DMEM containing 5 mM glucose and 10% FBS. After 3 days the cells were incubated for 6 h in serum-free medium containing 5 mM glucose. Then, 5 nM neurotensin and 10 ng/ml insulin and the indicated concentration of berberine were added for 17 h at 37°C prior to the addition of [3H]-thymidine for 6 h. The radioactivity incorporated into acid-insoluble pools was measured in a scintillation counter, as described in “Materials and Methods”. Results are expressed as the percentage of maximum mean ± SEM obtained in 4 independent experiments (3 replicate cultures per point in each experiment).
Figure 6
Figure 6. Knockdown of the α subunits of AMPK reverses inhibition of mTORC1, ERK and DNA synthesis induced by low doses of metformin.
A, PANC-1 cells were transfected with either non-targeting negative control (Non Target.) or 10 nM AMPKα1 and 10 nM AMPKα2 siRNA (AMPKα1, α2 siRNA) in DMEM containing 5 mM glucose and 10% FBS. After 3 days the cells were incubated either in the absence or presence of 1 mM or 3 mM metformin (as indicated) for 17 h in serum free DMEM containing 5 mM glucose. The samples were analyzed by SDS-PAGE and immunoblotting with the following phospho antibodies: S6K at Thr389, S6 at Ser240/244, ERK at Thr202 and Tyr204, ACC at Ser79 and Raptor at Ser792 Shown here is a representative autoluminogram; similar results were obtained in 3 independent experiments. B, Quantification was performed using Multi Gauge V3.0. Results are expressed as the percentage of maximum (mean ±SEM; n = 3). C, PANC-1 cells were transfected with either non-targeting negative control (open bars) or 10 nM AMPKα1 and 10 nM AMPKα2 siRNA (black bars) in DMEM containing 3 mM glucose and 10% FBS. After 3 days the cells were incubated for 6 h in serum-free medium containing 5 mM glucose. Then, 5 nM neurotensin and 10 ng/ml insulin and metformin at either 1 mM or 3 mM were added for 17 h at 37°C prior to the addition of [3H]-thymidine for 6 h. The radioactivity incorporated into acid-insoluble pools was measured in a scintillation counter, as described in “Materials and Methods”. Results are expressed as the percentage of maximum mean ±SEM obtained in 3 independent experiments (3 replicate cultures per point in each experiment).

Similar articles

Cited by

References

    1. Rahib L, Smith BD, Aizenberg R, Rosenzweig AB, Fleshman JM, et al. (2014) Projecting Cancer Incidence and Deaths to 2030: The Unexpected Burden of Thyroid, Liver, and Pancreas Cancers in the United States. Cancer Res 74:2913–2921. - PubMed
    1. Siegel R, Ma J, Zou Z, Jemal A (2014) Cancer statistics, 2014. CA: A Cancer Journal for Clinicians 64:9–29. - PubMed
    1. Brand RE, Tempero MA (1998) Pancreatic cancer. Curr Opin Oncol 10:362–366. - PubMed
    1. Rozengurt E, Walsh JH (2001) Gastrin, CCK, signaling, and cancer. Annu Rev Physiol 63:49–76. - PubMed
    1. Rozengurt E (2002) Neuropeptides as growth factors for normal and cancer cells. Trends Endocrinol Metabol 13:128–134. - PubMed

MeSH terms