. 2014 Dec 10;9(12):e113827.
doi: 10.1371/journal.pone.0113827. eCollection 2014.

Modeling Wood Encroachment in Abandoned Grasslands in the Eifel National Park - Model Description and Testing

Affiliations

Modeling Wood Encroachment in Abandoned Grasslands in the Eifel National Park - Model Description and Testing

Silvana Hudjetz et al. PLoS One. .

Abstract

The degradation of natural and semi-natural landscapes has become a matter of global concern. In Germany, semi-natural grasslands belong to the most species-rich habitat types but have suffered heavily from changes in land use. After abandonment, the course of succession at a specific site is often difficult to predict because many processes interact. In order to support decision making when managing semi-natural grasslands in the Eifel National Park, we built the WoodS-Model (Woodland Succession Model). A multimodeling approach was used to integrate vegetation dynamics in both the herbaceous and shrub/tree layer. The cover of grasses and herbs was simulated in a compartment model, whereas bushes and trees were modelled in an individual-based manner. Both models worked and interacted in a spatially explicit, raster-based landscape. We present here the model description, parameterization and testing. We show highly detailed projections of the succession of a semi-natural grassland including the influence of initial vegetation composition, neighborhood interactions and ungulate browsing. We carefully weighted the single processes against each other and their relevance for landscape development under different scenarios, while explicitly considering specific site conditions. Model evaluation revealed that the model is able to emulate successional patterns as observed in the field as well as plausible results for different population densities of red deer. Important neighborhood interactions such as seed dispersal, the protection of seedlings from browsing ungulates by thorny bushes, and the inhibition of wood encroachment by the herbaceous layer, have been successfully reproduced. Therefore, not only a detailed model but also detailed initialization turned out to be important for spatially explicit projections of a given site. The advantage of the WoodS-Model is that it integrates these many mutually interacting processes of succession.


Conflict of interest statement

Competing Interests: The authors have declared that no competing interests exist.

Figures

Figure 1
Figure 1. Multimodeling approach: Individually modelled bushes and trees are embedded in a grid-based difference equation model.
All stated processes may take place in all cells. Arrows represent interactions.
Figure 2
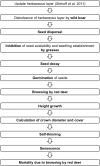
Figure 2. Flow chart of processes taking place in the individual-based WoodS-Model.
Figure 3
Figure 3. Simulated growth model (black line) fitting observed data of four tree species and one bush species.
Model efficiency EF is calculated as described by . Grey lines are the standard deviation (2s for broom).
Figure 4
Figure 4. Crown diameter as an allometric function of height fitting observed data of solitary bushes and trees in the Eifel National Park.
Raw data is publicly available online .
Figure 5
Figure 5. Proportion of seeds landing in the sink cell along one axis for studied bushes and trees starting from one parent plant as calculated from the LANDIS II double exponential seed dispersal function .
Figure 6
Figure 6. Wood encroachment starting with one parent plant in a 1 ha scenario (c.f. Fig. 7) without inhibition by the herbaceous layer.
Figure 7
Figure 7. Encroachment of beech (green: cells with a cover >50%) and broom (orange: cells with a cover >50%) on an area of 1 ha starting with one parent plant without inhibition by the herbaceous layer and not influenced by red deer.
Figure 8
Figure 8. Wood encroachment on a fallow grassland starting with one parent plant in a 1 ha scenario not influenced by red deer but considering the inhibition of the herbaceous layer.
Figure 9
Figure 9. Biomass of twigs as an allometric function of length fitting observed data of collected twigs (raw data is publicly available online [34]).
Figure 10
Figure 10. Simulation of the landscape development in the southern part of the Dreiborner Hochfläche with the actual population density of red deer (22 animals per 100 ha).
Names of bushes refer to shrub patches with a bush cover ≥10%. In forest cells, cover of trees is ≥50%.
Figure 11
Figure 11. Simulation: Vegetation dynamics depending on initial state and neighborhood.
Details of the simulation shown in Fig. 10.
Figure 12
Figure 12. Observation vs. simulation: Examples of typical patterns of succession from vegetation mapping of areas of known age after abandonment, and results of simulations showing same successional patterns over time.
A: Encroachment of broom on abandoned field paths. B: Spread of bramble and blackthorn into fallow grasslands and subsequent development of new forests from within thorny scrub. Since the observation is time point 0 for the simulation, a direct comparison is not possible. Therefore, we show examples of typical patterns in the observation and simulation for the same landscape. The intention is not to provide a direct comparison, but the changes of landscape structure within a given time frame.
Figure 13
Figure 13. Observation vs. simulation: Black bars are related to the relative number of established trees observed in the field surveys with a height >2 m , , , .
Grey bars are related to the number of simulated cells with emerging new forests.
Figure 14
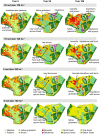
Figure 14. Simulated vegetation development of the southern part of the Dreiborner Hochfläche if abandoned with different population densities of red deer.
Initial vegetation composition as in Fig. 10.
Figure 15
Figure 15. Forest development after 100 simulated years in the southern part of the Dreiborner Hochfläche if abandoned with different population densities of red deer (R).
Same simulation as in Fig. 14. Please note that succession within forests (e.g. from birch to beech or oak) is not included in our model.

References

    1. CBD (2010) Fourth National Report under the Convention on Biological Diversity (CBD) – Germany. Available: http://www.cbd.int/reports/search/.
    1. Poschlod P, Bakker JP, Kahmen S (2005) Changing land use and its impact on biodiversity. Basic and Applied Ecology 6:93–98.
    1. GBO3 (2010) Secretariat of the Convention on Biological Diversity. Global Biodiversity Outlook 3– Executive Summary. Montreal.
    1. Lind B, Stein S, Kärcher A, Klein M (2009) Where have all the flowers gone? Grünland im Umbruch. Bonn: German Federal Agency for Nature Conservation (BfN).
    1. EU-COM. Composite Report on the Conservation Status of Habitat Types and Species as required under Article 17 of Habitats Directive, Report from the Commission to the Council and the European Parliament. COM (2009) 358 final; 2009; Brussels.

Publication types

LinkOut - more resources