. 2015 Jan 14;15(1):669-74.
doi: 10.1021/nl5041786. Epub 2014 Dec 16.

Nanooptics of molecular-shunted plasmonic nanojunctions

Affiliations
Free PMC article

Nanooptics of molecular-shunted plasmonic nanojunctions

Felix Benz et al. Nano Lett. .
Free PMC article

Abstract

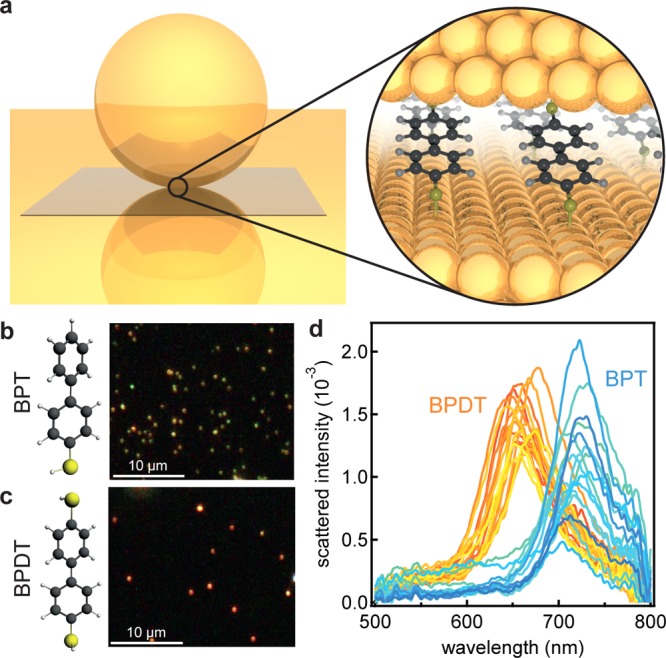
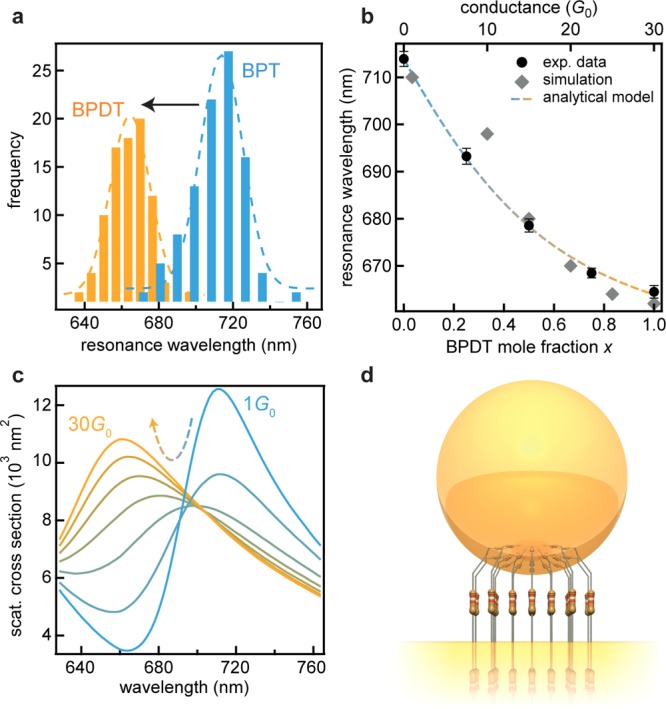
Gold nanoparticles are separated above a planar gold film by 1.1 nm thick self-assembled molecular monolayers of different conductivities. Incremental replacement of the nonconductive molecules with a chemically equivalent conductive version differing by only one atom produces a strong 50 nm blue-shift of the coupled plasmon. With modeling this gives a conductance of 0.17G(0) per biphenyl-4,4'-dithiol molecule and a total conductance across the plasmonic junction of 30G(0). Our approach provides a reliable tool quantifying the number of molecules in each plasmonic hotspot, here <200.

Keywords: Sensing; molecular conductivity; nanophotonics; plasmonic coupling; plasmonics; surface-enhanced Raman spectroscopy.


Figures

Figure 1
Figure 1
Conductive and nonconductive self-assembled monolayers in plasmonic junctions. (a) Schematic of nanoparticle on mirror geometry: a gold nanoparticle is placed on a gold film, separated by a thin molecular spacer layer. (b, c) Dark field images of 60 nm gold nanoparticles on BPT and BPDT, respectively. (d) Normalized scattered intensity from individual 60 nm gold nanoparticles on BPT and BPDT.
Figure 2
Figure 2
Conductance dependent shift of the plasmon resonance. (a) Distributions of the plasmon resonance wavelength for BPT and BPDT in 100 plasmonic gaps. (b) Blue-shift of the coupled plasmon resonance with increasing BPDT mole fraction x in mixed SAMs together with fitted analytical model (bottom axis) and full electrodynamical simulations (top axis). (c) Simulated scattering spectra for increasing total junction conductance between 1 and 30G0. The simulation assumes a facet with a diameter of 4 nm, forming a conductive link with refractive index of 1.5 (dielectric function as in ref (15)). (d) Illustration of the modeled system.
Figure 3
Figure 3
Surface enhanced Raman spectra of individual nanoparticle on mirror constructs. (a,b) SERS spectra of 20 nanoparticles, with average (black line) and modeled spectra (gray line) for BPT and BPDT, respectively. Laser wavelength 633 nm, 0.33 mW power, 10 s integration time, spectra normalized to 1585 cm–1 peak. Insets shows magnified coupled ring mode peak, the length of the scale bar is 20 cm–1. (c) Ratio of coupled ring mode (1585 cm–1) to C–H rocking mode (1080 cm–1) vs the resonance wavelength shift (100 nanoparticles each). (d) Schematic of C–H rocking and coupled ring modes. (e) Average SERS spectra normalized by the number of molecules, comparing SERS intensities from BPDT and BPT.

References

    1. Heeger A. J.; Kivelson S.; Schrieffer J. R.; Su W.-P. Rev. Mod. Phys. 1988, 60, 781–850. - PubMed
    1. Kelley T. W.; Baude P. F.; Gerlach C.; Ender D. E.; Muyres D.; Haase M. A.; Vogel D. E.; Theiss S. D. Chem. Mater. 2004, 16, 4413–4422.
    1. Burroughes J. H.; Bradley D. D. C.; Brown A. R.; Marks R. N.; Mackay K.; Friend R. H.; Burns P. L.; Holmes A. B. Nature 1990, 347, 539–541.
    1. Reineke S.; Lindner F.; Schwartz G.; Seidler N.; Walzer K.; Lüssem B.; Leo K. Nature 2009, 459, 234–238. - PubMed
    1. Günes S.; Neugebauer H.; Sariciftci N. S. Chem. Rev. 2007, 107, 1324–1338. - PubMed

Publication types