

Racial and ethnic disparities among enrollees in Medicare Advantage plans
- PMID: 25494268
- PMCID: PMC4381536
- DOI: 10.1056/NEJMsa1407273
Racial and ethnic disparities among enrollees in Medicare Advantage plans
Abstract
Background: Differences in the control of blood pressure, cholesterol, and glucose among the various racial and ethnic groups of Medicare enrollees may contribute to persistent disparities in health outcomes.
Methods: Among elderly enrollees in Medicare Advantage health plans in 2011 who had hypertension (94,171 persons), cardiovascular disease (112,039), or diabetes (105,848), we compared the respective age-and-sex-adjusted proportions with blood pressure lower than 140/90 mm Hg, low-density lipoprotein cholesterol levels below 100 mg per deciliter (2.6 mmol per liter), and a glycated hemoglobin value of 9.0% or lower, according to race or ethnic group. Comparisons were made nationally and within regions and health plans, and changes since 2006 were assessed.
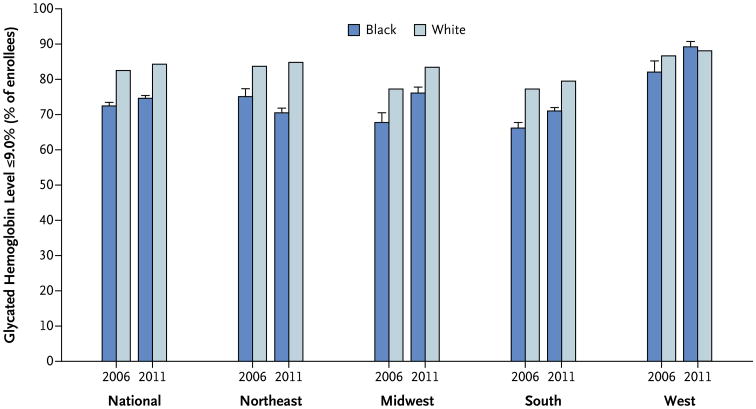
Results: Black enrollees in 2006 and 2011 were substantially less likely than white enrollees to have adequate control of blood pressure (adjusted absolute differences in proportions of enrollees in the 2 years, 7.9 percentage points and 10.3 percentage points, respectively), cholesterol (11.4 percentage points and 10.2 percentage points, respectively), and glycated hemoglobin (10.1 percentage points and 9.4 percentage points, respectively) (P<0.001 for all comparisons). Differing distributions of enrollees among health plans accounted for 39 to 59% of observed disparities in 2011. These differences persisted in 2011 in the Northeast, Midwest, and South (6.9 to 14.1 percentage points, P<0.001 for all comparisons) but were eliminated in the West for all three measures (<1.5 percentage points, P≥0.15). Hispanic enrollees were less likely than whites in 2011 to have adequate control of blood pressure (adjusted difference, 1.6 percentage points), cholesterol (adjusted difference, 1.0 percentage points), and glycated hemoglobin (adjusted difference, 3.4 percentage points) (P≤0.02 for all comparisons). Asians and Pacific Islanders were more likely than whites to have adequate control of blood pressure (difference, 4.4 percentage points; P<0.001) and cholesterol (5.5 percentage points, P<0.001) and had similar control of glycated hemoglobin (0.3 percentage points, P=0.63).
Conclusions: Disparities in control of blood pressure, cholesterol, and glucose have not improved nationally for blacks in Medicare Advantage plans, but these disparities were eliminated in the West in 2011. (Funded by the National Institute on Aging.).
Figures


Comment in
-
How to achieve health equity.N Engl J Med. 2014 Dec 11;371(24):2331-2. doi: 10.1056/NEJMe1412264. N Engl J Med. 2014. PMID: 25494273 Free PMC article. No abstract available.
References
-
- Harper S, Lynch J, Burris S, Davey Smith G. Trends in the black-white life expectancy gap in the United States, 1983-2003. JAMA. 2007;297:1224–32. - PubMed
-
- Harper S, Rushani D, Kaufman JS. Trends in the black-white life expectancy gap, 2003-2008. JAMA. 2012;307:2257–9. - PubMed
-
- Ong KL, Cheung BM, Man YB, Lau CP, Lam KS. Prevalence, awareness, treatment, and control of hypertension among United States adults 1999-2004. Hypertension. 2007;49:69–75. - PubMed
-
- Egan BM, Zhao Y, Axon RN. US trends in prevalence, awareness, treatment, and control of hypertension, 1988-2008. JAMA. 2010;303:2043–50. - PubMed
-
- Vital signs: prevalence, treatment, and control of high levels of low-density lipoprotein cholesterol — United States, 1999–2002 and 2005–2008. MMWR Morb Mortal Wkly Rep. 2011;60:109–14. - PubMed
Publication types
MeSH terms
Substances
Grants and funding
LinkOut - more resources
Full Text Sources
Other Literature Sources
Medical