. 2015 Feb 1;191(3):275-84.
doi: 10.1164/rccm.201410-1771OC.

Plasma sphingolipids associated with chronic obstructive pulmonary disease phenotypes

Affiliations

Plasma sphingolipids associated with chronic obstructive pulmonary disease phenotypes

Russell P Bowler et al. Am J Respir Crit Care Med. .

Abstract

Rationale: Chronic obstructive pulmonary disease (COPD) occurs in a minority of smokers and is characterized by intermittent exacerbations and clinical subphenotypes such as emphysema and chronic bronchitis. Although sphingolipids as a class are implicated in the pathogenesis of COPD, the particular sphingolipid species associated with COPD subphenotypes remain unknown.

Objectives: To use mass spectrometry to determine which plasma sphingolipids are associated with subphenotypes of COPD.

Methods: One hundred twenty-nine current and former smokers from the COPDGene cohort had 69 distinct sphingolipid species detected in plasma by targeted mass spectrometry. Of these, 23 were also measured in 131 plasma samples (117 independent subjects) using an untargeted platform in an independent laboratory. Regression analysis with adjustment for clinical covariates, correction for false discovery rate, and metaanalysis were used to test associations between COPD subphenotypes and sphingolipids. Peripheral blood mononuclear cells were used to test associations between sphingolipid gene expression and plasma sphingolipids.

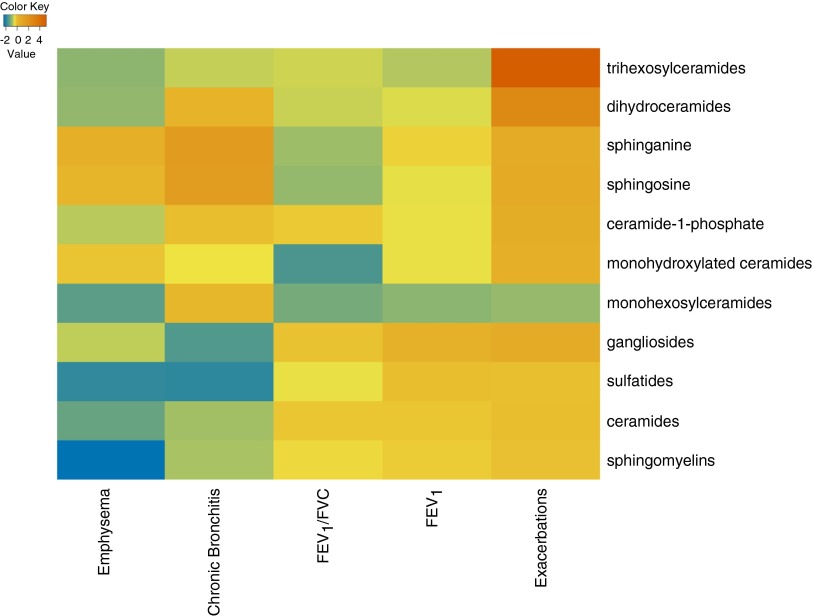
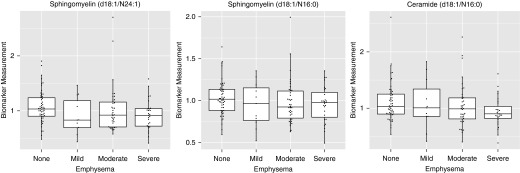
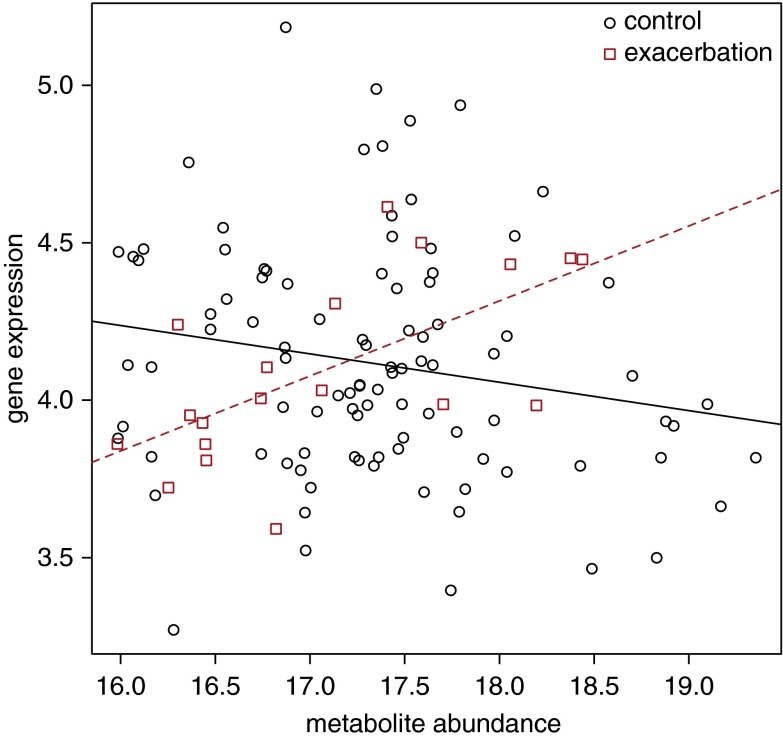
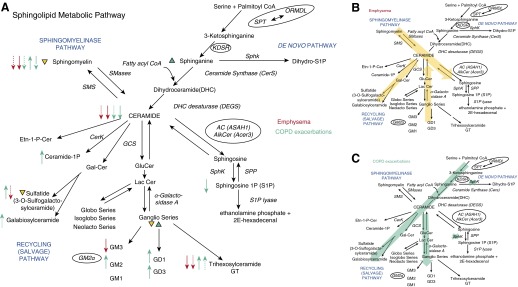
Measurements and main results: Of the measured plasma sphingolipids, five sphingomyelins were associated with emphysema; four trihexosylceramides and three dihexosylceramides were associated with COPD exacerbations. Three sphingolipids were strongly associated with sphingolipid gene expression, and 15 sphingolipid gene/metabolite pairs were differentially regulated between COPD cases and control subjects.

Conclusions: There is evidence of systemic dysregulation of sphingolipid metabolism in patients with COPD. Subphenotyping suggests that sphingomyelins are strongly associated with emphysema and glycosphingolipids are associated with COPD exacerbations.

Keywords: ceramides; emphysema; genomics; metabolomics; sphingomyelins.


Figures

Figure 1.
Figure 1.
Heat map showing sphingolipids associated with specific chronic obstructive pulmonary disease (COPD) phenotypes. Each class was represented by the first principle component. Emphysema was defined as percent of lung attenuation voxels below −950 Hounsfield units; chronic bronchitis was defined by daily productive cough for at least 3 months in the previous 2 consecutive years; exacerbations (severe) were the number of hospital admissions for a COPD admission in the previous year. Each phenotype was modeled using regression with covariates (age, sex, smoking status, body mass index, and airflow obstruction [FEV1] where appropriate), detailed in the online methods. The color legend shows shading based on the signed −10 log of the P value with negative (−) associations shown in blue and green and positive (+) associations shown in orange and red for each sphingolipid class. Non–statistically significant associations are shown in yellow and light orange.
Figure 2.
Figure 2.
Plasma ceramides are inversely associated with emphysema severity. Ceramide (d18:1/N16:0), sphingomyelin (d18:1/N24:1), and sphingomyelin (d18:1/N16:0) are representative examples (false discovery rate < 0.02 in Table E5). Shown are box plots of median, quartiles, and outliers. A total of 33, 91, 97, and 100% of subjects with no, mild, moderate, or severe emphysema, respectively, had airflow obstruction (post-bronchodilator FEV1/FVC < 0.7).
Figure 3.
Figure 3.
Receiver operating characteristics (ROC) curve analysis and area under the curve (AUC) for sphingolipids significantly associated with moderate chronic obstructive pulmonary disease exacerbations. The first model uses only the demographic and clinical covariates (Covariates only), including covariates age, sex, smoking status, body mass index, and airflow obstruction (FEV1). The second model includes the same covariates and adds plasma levels of Cer.d18.1.N18.0, which was the sphingolipid that most improved ROC.
Figure 4.
Figure 4.
Disruption of sphingolipid metabolite–gene correlations by chronic obstructive pulmonary disease (COPD) phenotype. Scatterplot of NeuGcα2-3Galβ1-4GlcNAcβ1-3Galβ1-4Glcβ-Cer(d18:1/24:1(15Z)) and C9orf47 gene expression. Subjects without severe COPD exacerbations had a correlation of −0.19, whereas subjects with a history of severe COPD exacerbations had a correlation of 0.64 (P = 0.00001; false discovery rate = 0.01).
Figure 5.
Figure 5.
Sphingolipids metabolo-genomic pathway patterns associated with chronic obstructive pulmonary disease (COPD) subphenotypes. (A) Detailed sphingolipid metabolic pathway with the major ceramide synthetic pathways noted as sphingomyelinase, de novo, and recycling pathways (abbreviations list in the text). Individual or classes of metabolites measured in the study are identified as precursors and/or products relative to synthetic or catabolic reactions with directionality marked by black arrows. Catalytic enzymes are noted next to the middle of the reactions arrow. Circled are enzymes whose genes were significantly related with COPD phenotypes in genomic analyses. In color are classes (arrowheads) or species (arrows) of metabolites that were associated with respective (color-coded) COPD phenotypes. Solid arrows indicate: 16–18 carbon chain sphingolipids; dotted arrows 24–26 carbon chain sphingolipids; single dash arrows: 14 carbon chain sphingolipids. The direction of the arrowhead or arrow marks the direction of association (i.e., up: increased; down: decreased). Closed-headed arrows represent changes with significance levels P < 0.05. (B, C) Superimposed on the sphingolipid metabolic pathways are deducted directions of sphingolipid metabolic flux, based on the results of the metabolo-genomic study, by disease phenotype, as noted.

Comment in

Similar articles

Cited by

References

    1. Murphy SL, Xu J, Kochanek KD. Deaths: final data for 2010. Natl Vital Stat Rep. 2013;61:1–117. - PubMed
    1. Friedlander AL, Lynch D, Dyar LA, Bowler RP. Phenotypes of chronic obstructive pulmonary disease. COPD. 2007;4:355–384. - PubMed
    1. Petrache I, Petrusca DN, Bowler RP, Kamocki K. Involvement of ceramide in cell death responses in the pulmonary circulation. Proc Am Thorac Soc. 2011;8:492–496. - PMC - PubMed
    1. Bahr TM, Hughes GJ, Armstrong M, Reisdorph R, Coldren CD, Edwards MG, Schnell C, Kedl R, LaFlamme DJ, Reisdorph N, et al. Peripheral blood mononuclear cell gene expression in chronic obstructive pulmonary disease. Am J Respir Cell Mol Biol. 2013;49:316–323. - PMC - PubMed
    1. Ahmed FS, Jiang XC, Schwartz JE, Hoffman EA, Yeboah J, Shea S, Burkart KM, Barr RG. Plasma sphingomyelin and longitudinal change in percent emphysema on CT. The MESA lung study. Biomarkers. 2014;19:207–213. - PMC - PubMed

Publication types