. 2015;10(1):6-18.
doi: 10.4161/15592294.2014.988035. Epub 2015 Jan 27.

ARHGEF3 controls HDACi-induced differentiation via RhoA-dependent pathways in acute myeloid leukemias

Affiliations

ARHGEF3 controls HDACi-induced differentiation via RhoA-dependent pathways in acute myeloid leukemias

Loredana D'Amato et al. Epigenetics. 2015.

Abstract

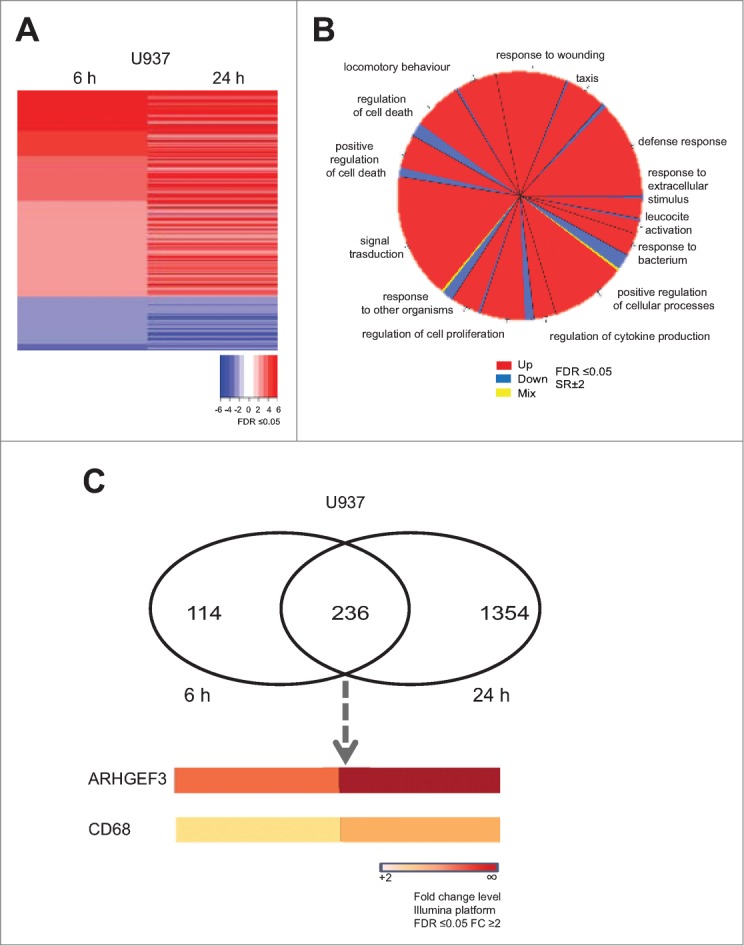
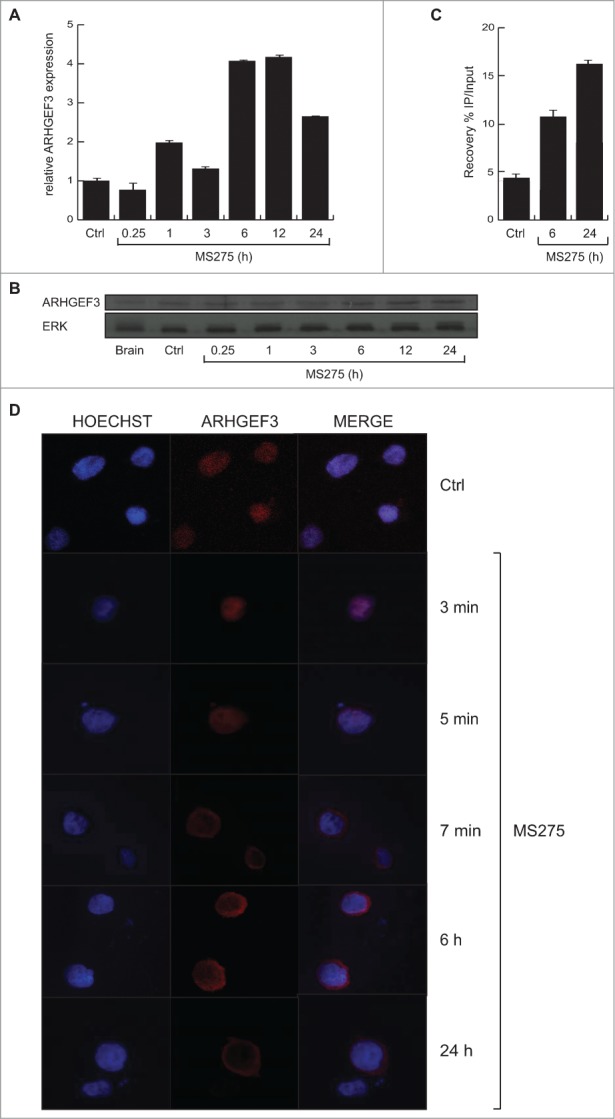
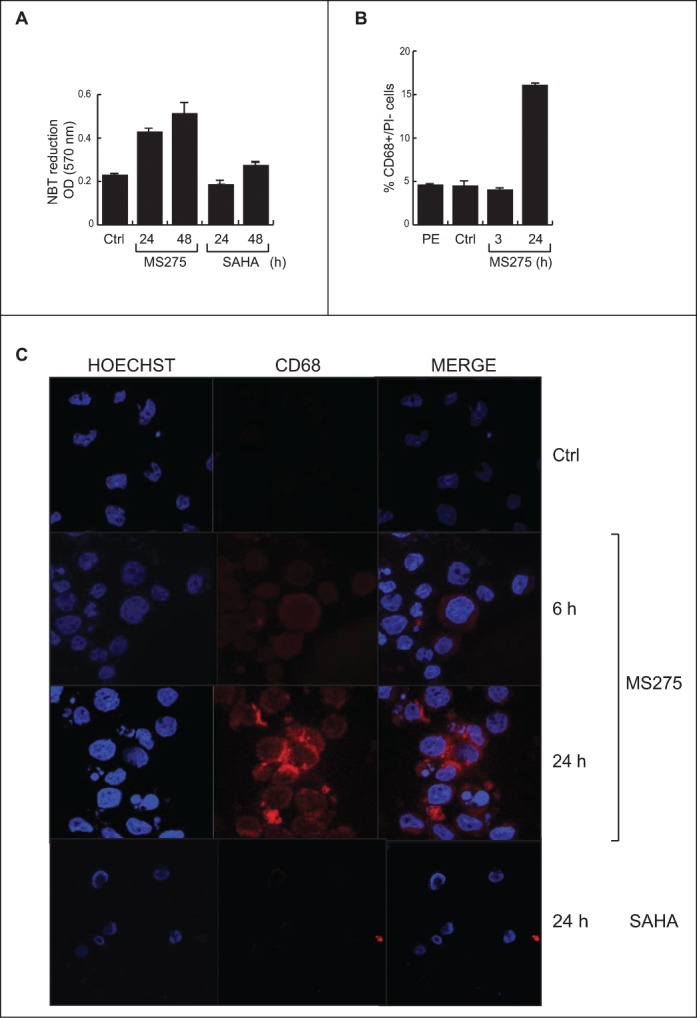
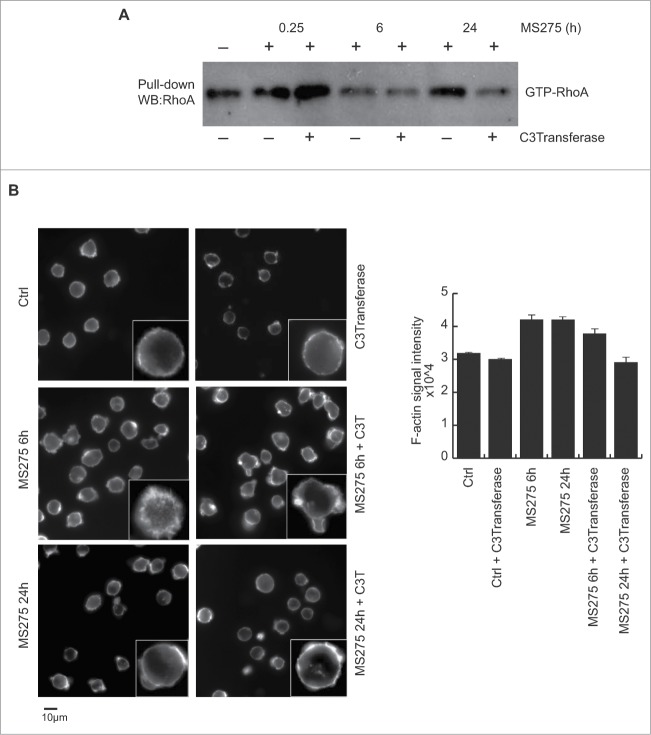
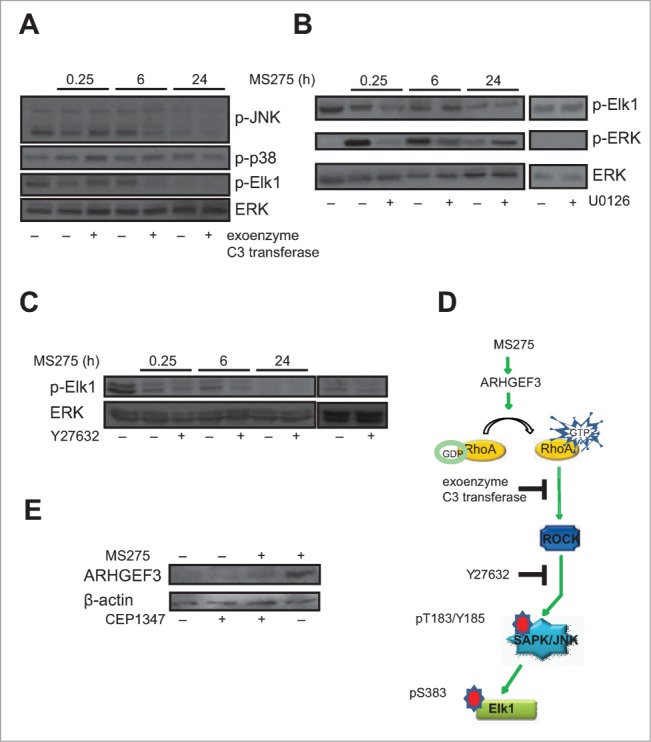
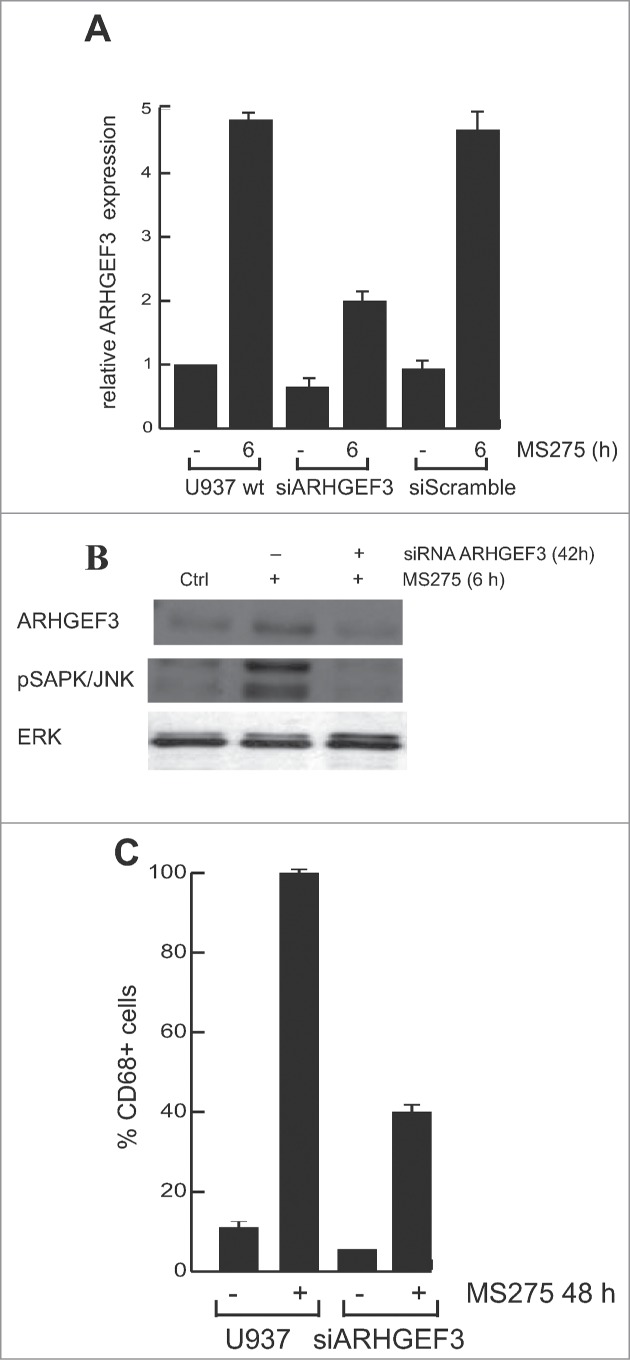
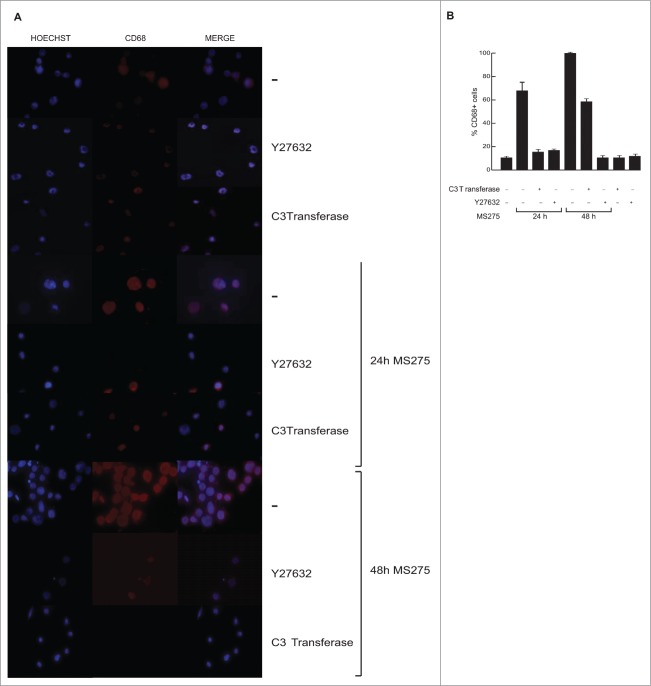
Altered expression and activity of histone deacetylases (HDACs) have been correlated with tumorigenesis. Inhibitors of HDACs (HDACi) induce acetylation of histone and non-histone proteins affecting gene expression, cell cycle progression, cell migration, terminal differentiation and cell death. Here, we analyzed the regulation of ARHGEF3, a RhoA-specific guanine nucleotide exchange factor, by the HDACi MS275 (entinostat). MS275 is a well-known benzamide-based HDACi, which induces differentiation of the monoblastic-like human histiocytic lymphoma cell line U937 to monocytes/macrophages. Incubation of U937 cells with MS275 resulted in an up regulation of ARHGEF3, followed by a significant enhancement of the marker of macrophage differentiation CD68. ARHGEF3 protein is primarily nuclear, but MS275 treatment rapidly induced its translocation into the cytoplasm. ARHGEF3 cytoplasmic localization is associated with activation of the RhoA/Rho-associated Kinase (ROCK) pathway. In addition to cytoskeletal rearrangements orchestrated by RhoA, we showed that ARHGEF3/RhoA-dependent signals involve activation of SAPK/JNK and then Elk1 transcription factor. Importantly, MS275-induced CD68 expression was blocked by exposure of U937 cells to exoenzyme C3 transferase and Y27632, inhibitors of Rho and ROCK respectively. Moreover, ARHGEF3 silencing prevented RhoA activation leading to a reduction in SAPK/JNK phosphorylation, Elk1 activation and CD68 expression, suggesting a crucial role for ARHGEF3 in myeloid differentiation. Taken together, our results demonstrate that ARHGEF3 modulates acute myeloid leukemia differentiation through activation of RhoA and pathways directly controlled by small GTPase family proteins. The finding that GEF protein modulation by HDAC inhibition impacts on cell differentiation may be important for understanding the antitumor mechanism(s) by which HDACi treatment stimulates differentiation in cancer.

Keywords: HDAC inhibitors; acute myeloid leukemia; cancer; differentiation; signal transduction.


Figures

Figure 1.
Figure 1.
MS275 induces both ARHGEF3 and CD68 transcriptional activation. (A) Heat map of gene expression profiles in U937 cells upon MS275 (5 μM) stimulation at 6 and 24 h. Experiments were carried out in biological triplicate. Student's T-test analysis was performed to compare untreated media and treated media (FDR ≤ 0.05). (B) Gene ontology (GO) of common altered genes in U937 cells after MS275 exposure at 6 and 24 h (FDR ≤ 0.05 and SR ± 2). (C) Venn diagram showing the number of differentially up regulated genes in U937 cells treated with MS275 for 6 h (left) and 24 h (right) (FDR ≤ 0.05 and FC ≥ 2 ). The lower panel shows ARHGEF3 and CD68 expression levels, commonly upregulated after MS275 treatment (FDR ≤ 0.05 and FC ≥ 2).
Figure 2.
Figure 2.
MS275 regulates both expression and localization of ARHGEF3 in leukemia. (A) Analysis of ARHGEF3 expression levels in U937 cells upon MS275 treatment (5 μM) at the indicated times by RT-PCR. The standard deviation was calculated from experiments in biological triplicate. (B) Expression levels of ARHGEF3 in U937 cells after MS275 treatment (5 μM) at the indicated times by Western blot analysis. ERK was used as loading control. (C) ChIP assays were performed in U937 cells treated with MS275 at the indicated times using H3K9,14 ac antibody. The analysis shows the recovery (% IP/Input) of H3K9,14 ac on ARHGEF3 promoter region. (D) IF analysis of ARHGEF3 showing its localization in U937 cells treated with MS275 for the indicated times. Cells were fixed and immune-stained with anti-ARHGEF 3 (red). Nuclear DNA was stained with Hoechst (blue). Scale bar 10 μm.
Figure 3.
Figure 3.
MS275, but not SAHA, induces expression of CD68 in leukemia. (A) NBT assay in U937 cells upon MS275 and SAHA treatment at 24 and 48 h. Error bars represent standard deviation from 2 independent experiments carried out in duplicate. (B) FACS analysis of CD68 expression in U937 cells upon MS275 treatment at 3 and 20 h. Error bars represent the standard deviation of 2 independent experiments carried out in duplicate. (C) IF analysis of CD68 showing CD68 localization in U937 cells treated with MS275 (5 μM) and SAHA (5 μM) for the indicated times. Cells were fixed and immune-stained with anti-CD68 (red). Nuclear DNA was stained with Hoechst (blue) and visualized using confocal microscopy. Scale bar 10 μm.
Figure 4.
Figure 4.
MS275 activates GTP-RhoA, inducing reorganization of actin cytoskeleton in leukemia. (A) RhoA-GTP GST pull-down assay in U937 cells stimulated with MS275 (5 μM) in presence or absence of the exoenzyme C3 transferase (1 μg/mL) for the indicated times. GTP-bound RhoA was visualized by Western blot analysis. The results are representative of at least 2 independent experiments. (B) Left. Inverted black-and-white images of IF staining of cytoskeletal actin filaments with Texas Red-labeled phalloidin antibody in U937 cells upon MS275 treatment (5 μM) or exoenzyme C3 transferase (1 μg/mL) for the indicated times. Scale bar 10 μm. Right. Signal intensity quantification analyzed as the media of the intensities of different areas for each sample in the same acquisition region. Differential P value is < di 0,005.
Figure 5.
Figure 5.
MS275 affects Elk phosphorylation by RhoA pathway activation. (A) Western blot analysis of expression levels of p-JNK, p-p38 and p-Elk1 in U937 cells after MS275 treatment (5 μM) at the indicated times with or without exoenzyme C3 transferase (1 μg/mL). ERK was used as loading control. (B) Protein expression levels of p-Elk1 and p-ERK in U937 cells after MS275 treatment (5 μM) with or without the MEK inhibitor U0126 (10 μM) for the indicated times. ERK was used as loading control. (C) Protein expression levels of p-Elk1 in U937 cells after MS275 treatment (5 μM) with or without the ROCK inhibitor Y27632 (10 μM) at the indicated times. ERK was used as loading control. (D) Schematic model showing MS275-induced ARHGEF3 involvement in activation of RhoA pathway by phosphorylation of JNK and its target Elk1. (E) Western blot analysis of expression levels of ARHGEF3 in U937 cells after MS275 treatment (5 μM) at the indicated times with or without CEP1347 (0.5 μM). β-actin was used as loading control.
Figure 6.
Figure 6.
ARHGEF3 knockdown inhibits pSAPK/JNK activation reducing CD68 expression. (A) Expression levels of ARHGEF3 analyzed by RT-PCR in U937 cells transiently transfected with 1 μM of either scramble siRNA (siRNA control) or specific siRNAs targeting ARHGEF3. Gene expression was analyzed at 48 h after transfection with or without MS275 at 5 μM. Error bars represent the standard deviation from 2 independent experiments carried out in triplicate and normalized to GAPDH levels. (B) Protein expression levels of ARHGEF3 and p-JNK in U937 cells in the same settings. ERK was used as loading control. (C) IF analysis of CD68 in U937 cells at 48 h after transfection with or without MS275 at 5 μM. Cells were fixed and immune-stained with anti-CD68 (red). Nuclear DNA was stained with Hoechst (blue) and visualized using confocal microscopy. Scale bar 10 μm.
Figure 7.
Figure 7.
MS275-induced CD68 expression is impaired by interference with the RhoA signaling pathway. (A) IF analysis of CD68 expression in U937 cells under the indicated conditions. Scale bar 10 μm. (B) Percentage of CD68-positive cells by positive cell counting under a microscope.

References

    1. Conte M, Altucci L. Molecular pathways: the complexity of the epigenome in cancer and recent clinical advances. Clin Cancer Res 2012; 18:5526-34; PMID:22904103; http://dx.doi.org/10.1158/1078-0432.CCR-12-2037 - DOI - PubMed
    1. Benedetti R, Conte M, Altucci L. Targeting histone deacetylases in diseases: where are we? Antioxid Redox Signal 2014; [Epub ahead of print]; PMID:24382114 - PMC - PubMed
    1. Choudhary C, Kumar C, Gnad F, Nielsen ML, Rehman M, Walther TC, Olsen JV, Mann M. Lysine acetylation targets protein complexes and co-regulates major cellular functions. Science 2009; 325:834-40; PMID:19608861; http://dx.doi.org/10.1126/science.1175371 - DOI - PubMed
    1. Di Costanzo A, Del Gaudio N, Migliaccio A, Altucci L. Epigenetic drugs against cancer: an evolving landscape. Arch Toxicol 2014; 88:1651-68; PMID:25085708; http://dx.doi.org/10.1007/s00204-014-1315-6 - DOI - PubMed
    1. Mai A, Altucci L. Epi-drugs to fight cancer: from chemistry to cancer treatment, the road ahead. Int J Biochem Cell Biol 2009; 41:199-213; PMID:18790076; http://dx.doi.org/10.1016/j.biocel.2008.08.020 - DOI - PubMed

Publication types

MeSH terms