. 2015 Feb;28(2):376-94.
doi: 10.1111/jeb.12570. Epub 2015 Jan 30.

Diversity and disparity through time in the adaptive radiation of Antarctic notothenioid fishes

Affiliations

Diversity and disparity through time in the adaptive radiation of Antarctic notothenioid fishes

M Colombo et al. J Evol Biol. 2015 Feb.

Abstract

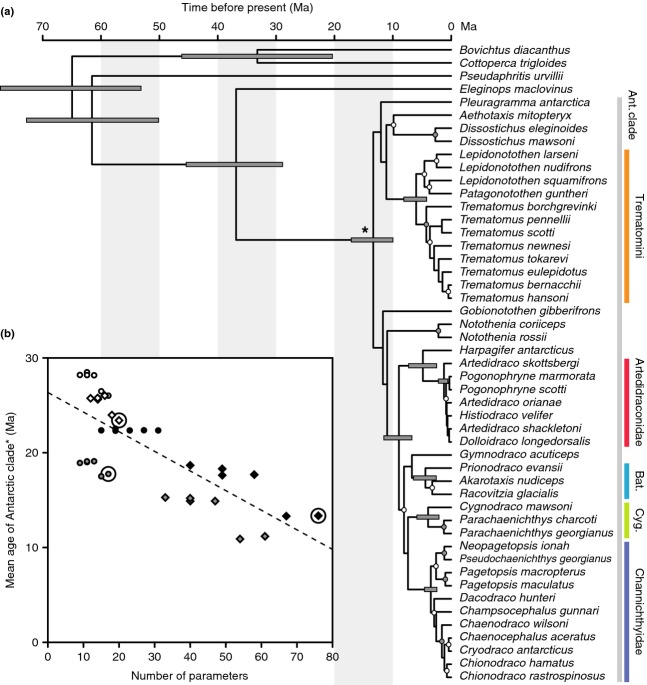
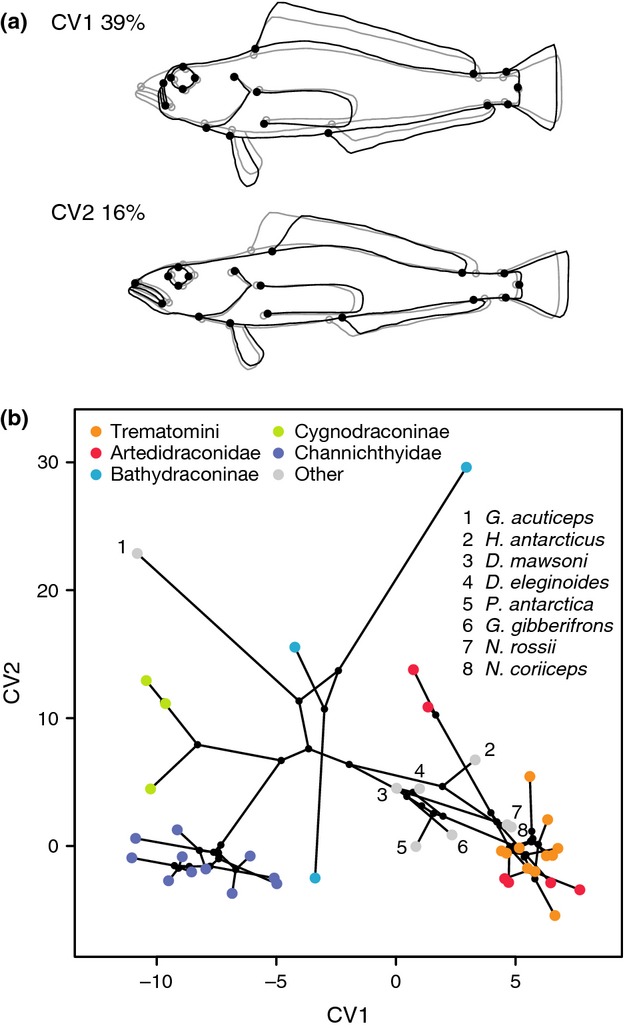
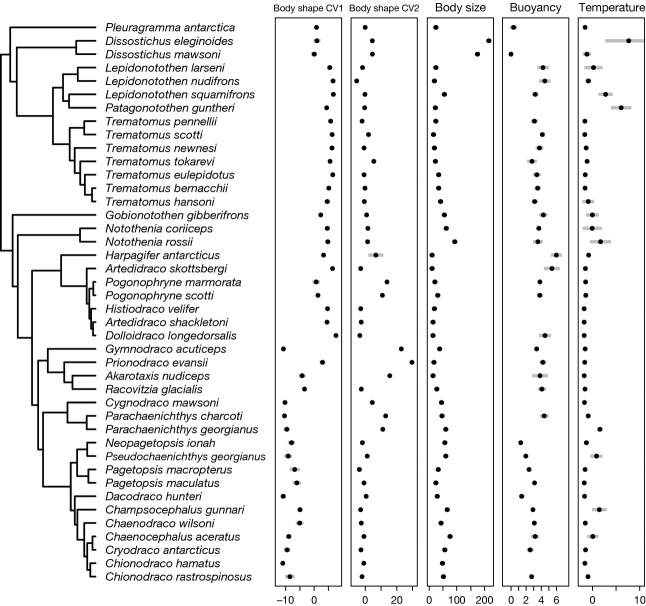
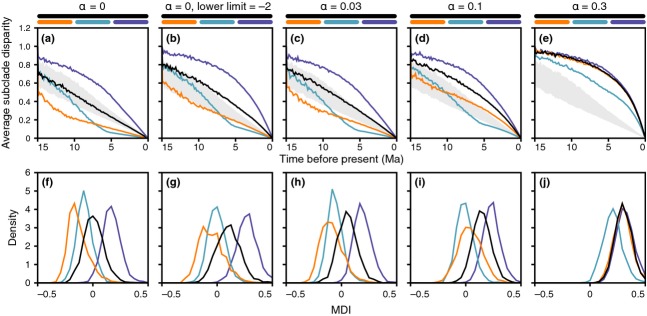
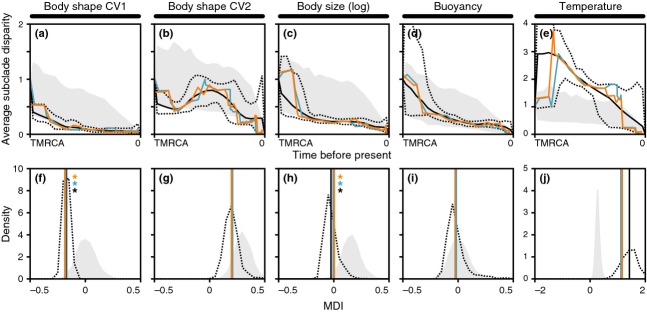
According to theory, adaptive radiation is triggered by ecological opportunity that can arise through the colonization of new habitats, the extinction of antagonists or the origin of key innovations. In the course of an adaptive radiation, diversification and morphological evolution are expected to slow down after an initial phase of rapid adaptation to vacant ecological niches, followed by speciation. Such 'early bursts' of diversification are thought to occur because niche space becomes increasingly filled over time. The diversification of Antarctic notothenioid fishes into over 120 species has become one of the prime examples of adaptive radiation in the marine realm and has likely been triggered by an evolutionary key innovation in the form of the emergence of antifreeze glycoproteins. Here, we test, using a novel time-calibrated phylogeny of 49 species and five traits that characterize notothenioid body size and shape as well as buoyancy adaptations and habitat preferences, whether the notothenioid adaptive radiation is compatible with an early burst scenario. Extensive Bayesian model comparison shows that phylogenetic age estimates are highly dependent on model choice and that models with unlinked gene trees are generally better supported and result in younger age estimates. We find strong evidence for elevated diversification rates in Antarctic notothenioids compared to outgroups, yet no sign of rate heterogeneity in the course of the radiation, except that the notothenioid family Artedidraconidae appears to show secondarily elevated diversification rates. We further observe an early burst in trophic morphology, suggesting that the notothenioid radiation proceeds in stages similar to other prominent examples of adaptive radiation.

Keywords: adaptive radiation; early burst; geometric morphometrics; incomplete lineage sorting; species tree.


Figures

Figure 1
Figure 1
Time-calibrated species tree of Notothenioidei. (a) The maximal clade credibility (MCC) tree for the BEAST analysis of the combined marker set and the best-supported model combination. Node bars are only shown for clades supported by Bayesian posterior probability (BPP) 1.0 and indicate the divergence date 95% highest posterior density. Gray circles mark nodes supported with BPP > 0.9 and white circles indicate BPP > 0.5. Support values and age estimates for all nodes are listed in Table S10. Vertical colour bars at right indicate monophyletic clades. Bat.: Bathydraconinae; Cyg.: Cygnodraconinae. The vertical gray bar spans the Antarctic clade. A lineage-through-time plot for this MCC tree is shown in Fig. S6. (b) The mean age estimate for the diversification of Antarctic notothenioids (the node marked with *) plotted against the number of parameters used in the respective BEAST analysis. Analyses using unlinked gene trees are represented by diamonds, and those with linked gene trees are marked with circles. Fill colours of circles and diamonds indicate the marker set used for the analysis (white: mitochondrial, gray: nuclear, black: combined). The best-supported model combination for each data set is encircled.
Figure 2
Figure 2
Body shape variation in notothenioid species. (a) Shape changes along the first two canonical variates. (b) Phylomorphospace plot of the first two canonical variates of body shape variation. Coloured dots show mean values of notothenioid species, whereas dot colour indicates clade membership. Colour code as in Fig.1a. Species not assigned to clades are represented by gray dots, with labels indicating species names. Black lines show phylogenetic relationships, and black dots represent hypothesized ancestral trait values.
Figure 3
Figure 3
Variation in morphological and habitat characteristics among notothenioid species. For each species, black dots indicate means of observed trait values, and gray bars represent standard variation. Body size is measured in cm, buoyancy in per cent, and temperature in °C. Buoyancy values are taken from Near et al. (2012). The phylogenetic tree is identical to the one shown in Fig.1a, excluding species with missing trait data.
Figure 4
Figure 4
Disparity through time and associated morphological disparity index (MDI) values for simulated trait evolution. (a–e) Average subclade disparity over time in simulated phylogenies with an age of 15 myr. The horizontal axis represents time. The black line represents the mean value for 2000 replicates of simulated diversification and trait evolution when the rate of trait evolution is homogeneous. Orange, turquoise and blue lines indicate mean values when the rate of trait evolution is 10-fold elevated between 15 and 10 Ma, between 10 and 5 Ma, or between 5 Ma and the present. (f–j) Densities of MDI values in 2000 trait evolution replicates, in the same sequence as (a–e).
Figure 5
Figure 5
Disparity through time and associated morphological disparity index (MDI) values for observed notothenioid traits. (a–e) Average subclade disparity over time. The horizontal axis represents time between the time of the recent common ancestor (TMRCA) and the present. Solid and dotted black lines indicate the mean and the 5% and 95% quantiles for average subclade disparity found in a posterior tree sample of 1000 trees. The orange and turquoise lines mark average subclade disparity in the maximal clade credibility (MCC) tree and in the tree based on the MP-EST species tree topology, respectively. The gray area represents the 5% and 95% quantiles for average subclade disparity according to the fitted model of trait variation (see Table1). (f–j) Solid lines represent MDI values calculated over the first 90% of the chronogram to account for tip overdispersion (Harmon et al., 2003), with colour codes as in (a). The black dotted line shows the density of MDI values in the sample of 1000 trees. The gray shape shows the density of MDI values in 2000 trees simulated with the fitted model of trait evolution (BM for body shape CV1 and buoyancy, OU with α = 0.30, 0.11 and 0.25 for body shape CV2, log body size and temperature; see Table1). Asterisks in (f) and (h) indicate that the tree sample mean MDI, the MDI of the MCC tree and the MDI of the tree based on the MP-EST topology are lower than the 5% quantile of MDI values found with the fitted model. Note the different scales for (e) and (j).

References

    1. Ackerly DD, Schwilk DW. Webb CO. Niche evolution and adaptive radiation: testing the order of trait divergence. Ecology. 2006;87:S50–S61. - PubMed
    1. Adams CE. Huntingford FA. The functional significance of inherited differences in feeding morphology in a sympatric polymorphic population of Arctic charr. Evol. Ecol. 2002;16:15–25.
    1. Alfaro ME, Santini F, Brock CD, Alamillo H, Dornburg A, Rabosky DL, et al. Nine exceptional radiations plus high turnover explain species diversity in jawed vertebrates. Proc. Natl. Acad. Sci. USA. 2009;106:13410–13414. - PMC - PubMed
    1. Balushkin AV. Morphology, classification, and evolution of Notothenioid fishes of the Southern Ocean (Notothenioidei, Perciformes) J. Ichthyol. 2000;40:S74–S109.
    1. Bargelloni L, Ritchie PA, Patarnello T, Battaglia B, Lambert DM. Meyer A. Molecular evolution at subzero temperatures: mitochondrial and nuclear phylogenies of fishes from Antarctica (suborder Notothenioidei), and the evolution of antifreeze glycopeptides. Mol. Biol. Evol. 1994;11:854–863. - PubMed

Publication types