Editorial
. 2014 Dec 11:13:486.
doi: 10.1186/1475-2875-13-486.

Fun with maths: exploring implications of mathematical models for malaria eradication

Affiliations
Editorial

Fun with maths: exploring implications of mathematical models for malaria eradication

Philip A Eckhoff et al. Malar J. .

Abstract

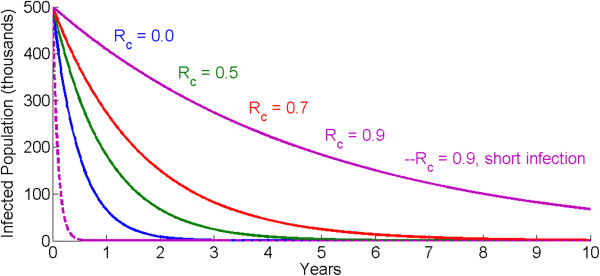
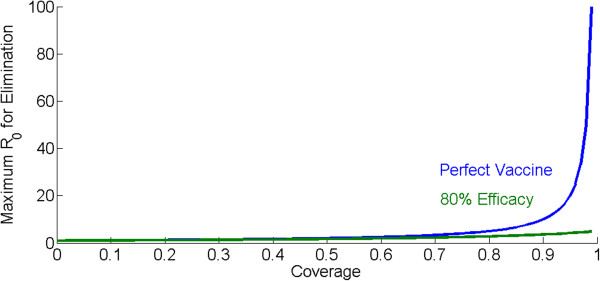
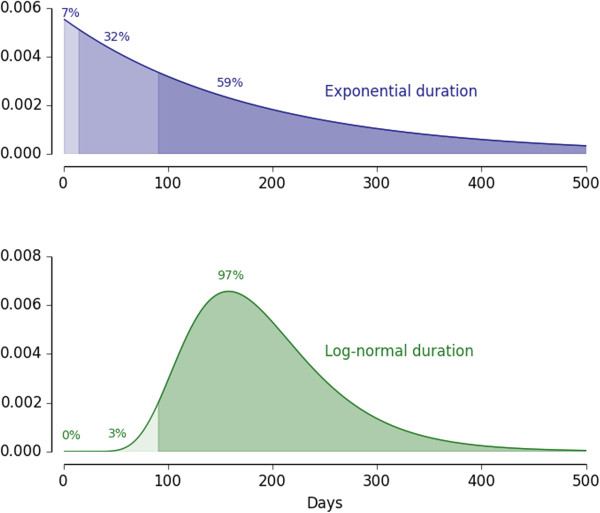
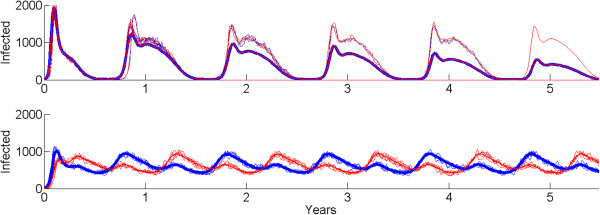
Mathematical analyses and modelling have an important role informing malaria eradication strategies. Simple mathematical approaches can answer many questions, but it is important to investigate their assumptions and to test whether simple assumptions affect the results. In this note, four examples demonstrate both the effects of model structures and assumptions and also the benefits of using a diversity of model approaches. These examples include the time to eradication, the impact of vaccine efficacy and coverage, drug programs and the effects of duration of infections and delays to treatment, and the influence of seasonality and migration coupling on disease fadeout. An excessively simple structure can miss key results, but simple mathematical approaches can still achieve key results for eradication strategy and define areas for investigation by more complex models.


Figures

Figure 1
Figure 1
Decay of the infectious reservoir for different values of R c , for an average infection duration of 180 days (solid lines) and 3.5 days (dashed line).
Figure 2
Figure 2
The maximum R 0 that can be eliminated for different levels of vaccination coverage with a perfect infection-preventing vaccine (blue) and one that prevents 80% of infections (green).
Figure 3
Figure 3
The difference in remaining distribution of infection duration following a 90-day case detection lag for an exponential distribution (blue) and a log-normal distribution (green), each with a mean of 180 days.
Figure 4
Figure 4
Two locations (red and blue) linked by migration with synchronous (top) and asynchronous (bottom) forcing. The mean number of infected individuals over 100 runs is plotted in bold for each location, along with representative trajectories. No fade-out occurs in the asynchronous simulation, and the ensemble is continuously depleted by fade-out in the synchronous case. The peak number of cases is substantially higher in the synchronous case, however.

References

    1. Macdonald G. Theory of the eradication of malaria. Bull World Health Organ. 1956;15:369–387. - PMC - PubMed
    1. Macdonald G. The Epidemiology and Control of Malaria. London, New York: Oxford University Press; 1957.
    1. Smith DL, McKenzie FE, Snow RW, Hay SI. Revisiting the basic reproductive number for malaria and its implications for malaria control. PLoS Biol. 2007;5:e42. doi: 10.1371/journal.pbio.0050042. - DOI - PMC - PubMed
    1. Smith D, Hay S. Endemicity response timelines for Plasmodium falciparum elimination. Malar J. 2009;8:87. doi: 10.1186/1475-2875-8-87. - DOI - PMC - PubMed
    1. Macdonald G, Goeckel GW. The Malaria Parasite Rate and the Interruption of Transmission. Bull World Health Organ. 1964;31:365–377. - PMC - PubMed

Publication types

MeSH terms