

Review
doi: 10.1021/cr500373h.
Epub 2014 Dec 12.
Nucleosome structure and function
Affiliations
- PMID: 25495456
- PMCID: PMC4378457
- DOI: 10.1021/cr500373h
Item in Clipboard
Review
Nucleosome structure and function
Chem Rev.
.
No abstract available
Figures
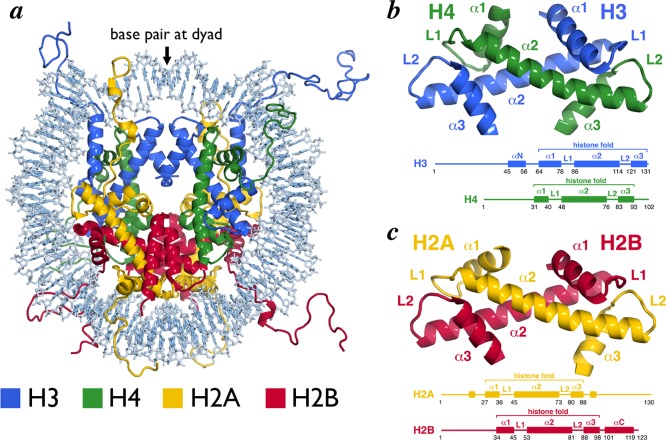
Nucleosome core particle structure and the histone-fold heterodimers.
(a) Nucleosome core particle structure (PDB ID 1KX5). Histones and DNA
are depicted in cartoon and sticks representations, respectively,
and colored as indicated. (b) H3/H4 histone-fold heterodimer. (c)
H2A/H2B histone-fold heterodimer. Structures (top) and schemes (bottom)
with secondary structure elements indicated. All molecular graphics
in this review were prepared using PyMOL software (The PyMOL Molecular
Graphics System, version 1.6, Schrodinger, LLC). All structures of
NCP using high-resolution structure (PDB
ID 1KX5) unless
indicated otherwise.
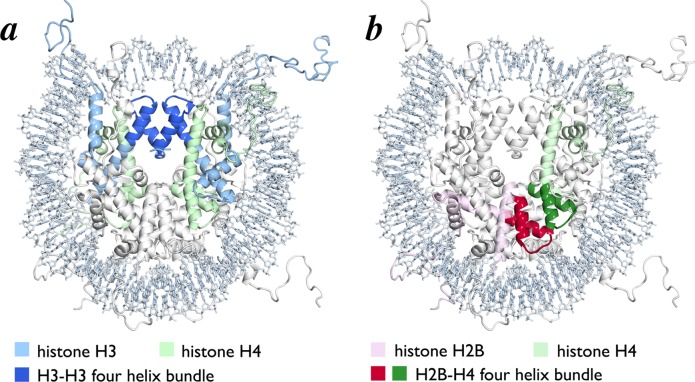
Histone octamer constructed with four helix bundles. (a)
Nucleosome
core particle structure highlighting H3–H3 four helix bundle
(blue). Remainder of H3 and H4 are shown in light blue and light green,
respectively. (b) Nucleosome core particle structure highlighting
one H4–H2B four helix bundle (green for H4 and red for H2B).
Remainder of H4 and H2B are shown in light green and pink, respectively.
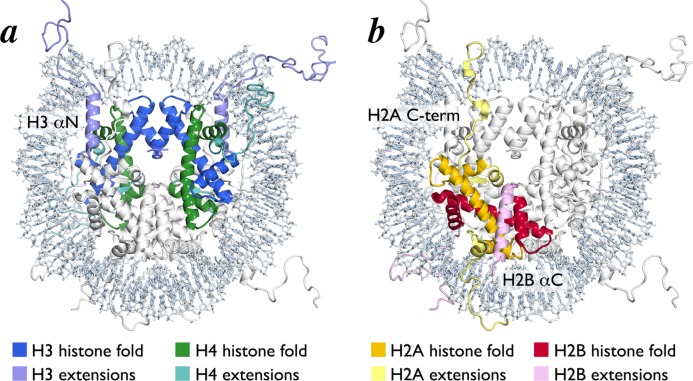
Histone-fold heterodimers in the nucleosome
core particle structure.
(a) Nucleosome core particle structure with central H3/H4 histone-fold
tetramer shown in blue (H3) and green (H4). H3 and H4 extensions are
shown in light blue and light green, respectively. (b) Nucleosome
core particle structure with one H2A/H2B histone-fold dimer shown
in yellow (H2A) and red (H2B). H2A and H2B extensions are shown in
light yellow and pink, respectively.
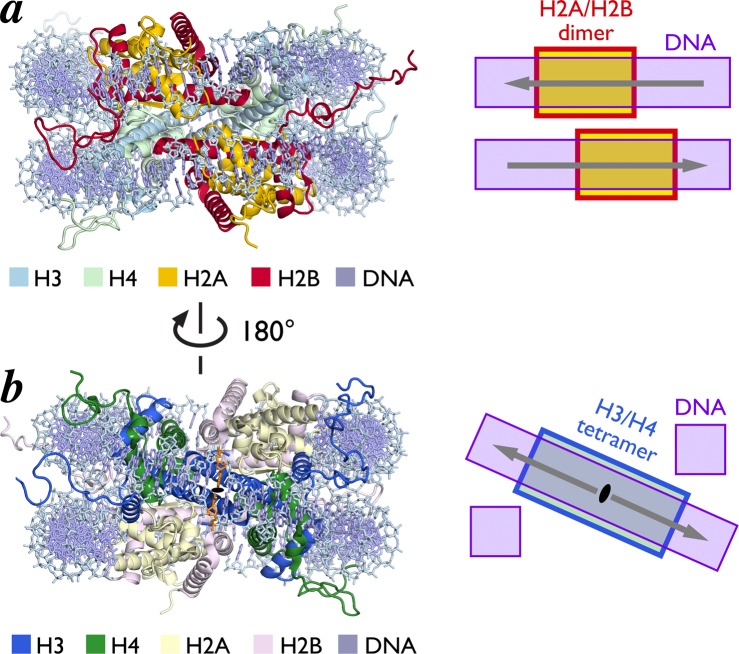
Histone-fold heterodimers form a ramp for nucleosomal
DNA. (a)
H2A/H2B histone-fold heterodimers interact with DNA in two different
parallel planes. Structure of NCP viewed from opposite dyad, highlighting
H2A and H2B in yellow and red, respectively (left) and scheme of DNA
planes (right). (b) H3/H4 tetramer forms a diagonal ramp for DNA connecting
two parallel planes. Structure of NCP view from dyad (black oval and
orange base pair) with H3 and H4 in blue and green, respectively,
(left) and scheme of diagonal DNA ramp (right). Arrows point away
from central dyad base pair.
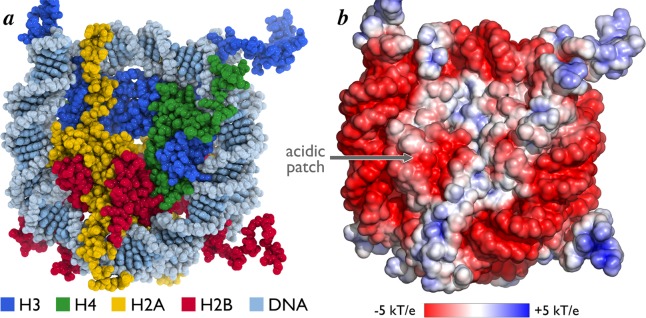
Surface topology and
charge of the nucleosome core particle. (a)
Surface of nucleosome core particle viewed down the DNA superhelical
axis in space-filling representation. (b) Surface electrostatic potential
of nucleosome core particle contoured from −5 to +5 kT/e calculated
with ABPS. Location of acidic patch
is indicated.
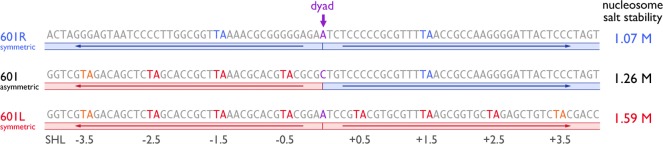
Scheme of asymmetric
and symmetric 601 sequences. Sequences of
601R symmetric, (canonical) 601 asymmetric, and 601L symmetric sequences
with H3/H4 TA steps highlighted in red for left half and blue for
right half. Nucleosome salt stability
values (molar monovalent salt) are listed at right and indicate stability
as follows: 601L > 601 > 601R. This trend correlates with the
number
of H3/H4 TA steps: 601L (6), 601 (4), 601R (2). The dyad position
is indicated (purple).
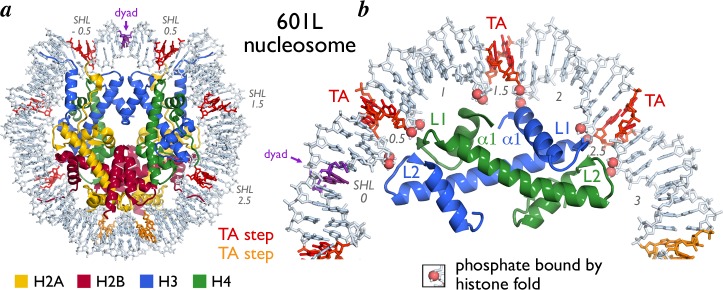
Location of TA steps in 601L nucleosome
core particle structure.
(a) 601L NCP structure viewed down the DNA superhelical axis with
TA steps interacting with H3/H4 and H2A/H2B colored red and orange,
respectively. The dyad is indicated (purple). Histones H3, H4, H2A,
and H2B are shown in cartoon representation and colored blue, green,
yellow, and red, respectively. Nucleosomal DNA is shown as sticks
(light blue). (b) Enlarged view showing one H3/H4 heterodimer bound
to DNA containing three TA steps (other histones are not shown for
clarity purposes). Backbone phosphates bound to the H3/H4 histone
folds are shown in space-filling representation as indicated. Secondary
structure elements of dimer are shown.
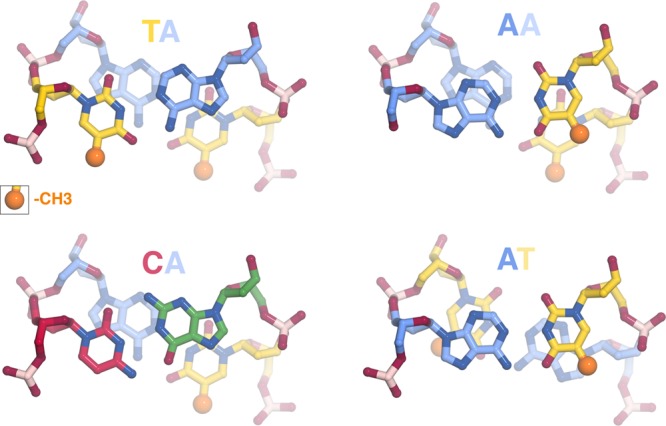
Minimal base stacking in TA and CA compared to other base
pair
steps. TA, CA, AA, and AT base pair steps colored as follows: T =
yellow, A = blue, G = green, C = red. The thymine methyl groups are
shown highlighted in space-filling representation (dark yellow), all
other non-hydrogen atoms shown in sticks representation. The minimal
base stacking and the absence of atoms close to the thymine methyl
group permit greater flexibility of the TA and CA base pair steps.
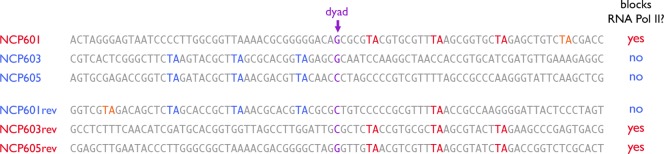
RNA polymerase II blocking by nucleosome positioning sequences.
Sequences of NCP601, NCP603, and NCP605 sequences and their reversed
counterparts together with ability to block RNA polymerase II. Multiple TA steps bound to the H3/H4 tetramer
downstream (red) of the dyad (purple) blocks RNA polymerase II passage
as compared with upstream (blue) of the dyad. TA steps bound to the
H2A/H2B dimers are shown in orange. The sequence shown for the 601
sequence is the reverse complement of what is shown in Figure 6 to be consistent with ref (73).
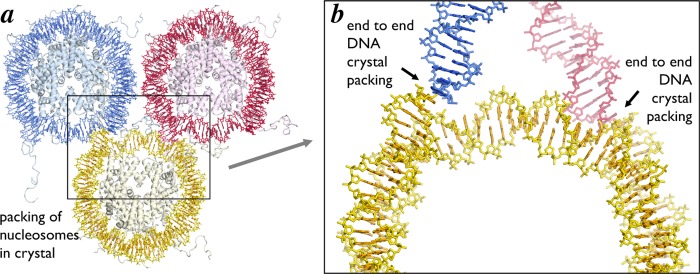
DNA end-to-end
packing in nucleosome core particle crystals. Three
nucleosome core particles from one plane of the high resolution NCP
crystal structure (PDB ID 1KX5) colored yellow, red and blue. (a) Full and (b) enlarged
views of the alignment of the DNA ends from adjacent NCP in the structure.
The DNA end-to-end packing exists in all crystals of the nucleosome
core particle on its own.
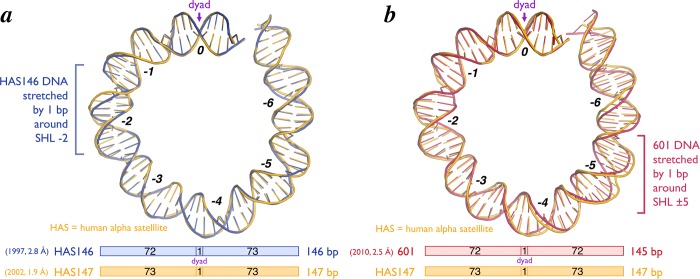
DNA stretching in nucleosome core particle structures. Cartoon
representation of structure of approximately half of the nucleosomal
DNA for (a) 146 bp human alpha-satellite (HAS146) (PDB ID 1AOI, blue) and (b) 145
bp 601 (PDB ID 3LZO, red) nucleosome positioning sequences relative to the HAS147 sequence
(PDB ID 1KX5, yellow) (top). Stretching of 1 bp is observed at superhelical location
(SHL) −2 with the HAS146 sequence and 1 bp each at SHL ±
5 with the 145 bp 601 sequence. SHLs and the dyad = SHL 0 are indicated.
The length of DNA wrapped on each side of the NCP for each of the
sequences is also shown (bottom).
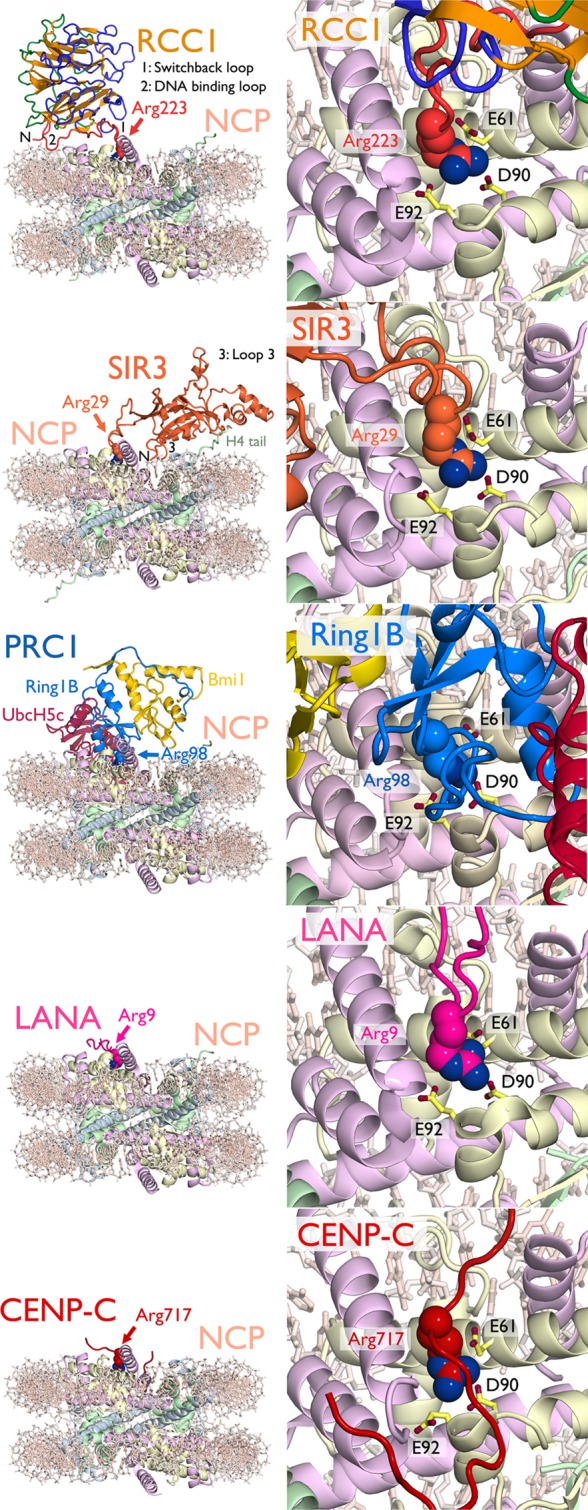
Nucleosome
recognition using the acidic patch arginine-anchor.
From top to bottom, structures of RCC1 (PDB ID 3MVD), Sir3 (PDB ID 3TU4), PRC1 (PDB ID 4R8P), LANA peptide (PDB ID 1ZLA), and CENP-C
peptide (PDB ID 4INM) bound to the nucleosome core particle.
Overview of structures as viewed from opposite the dyad (right) and
zoomed view of acidic patch (left) with arginine-anchor in space-filling
representation and key H2A residues shown as sticks. Locations of
RCC1 switchback loop (1), DNA binding loop (2), and N-terminus (N)
and Sir3 loop 3 (3) and N-terminus (N) are indicated. Histones H3,
H4, H2A, and H2B are shown in cartoon representation and colored cornflower
blue, light green, wheat, and pink, respectively. DNA (light pink)
is shown as sticks.
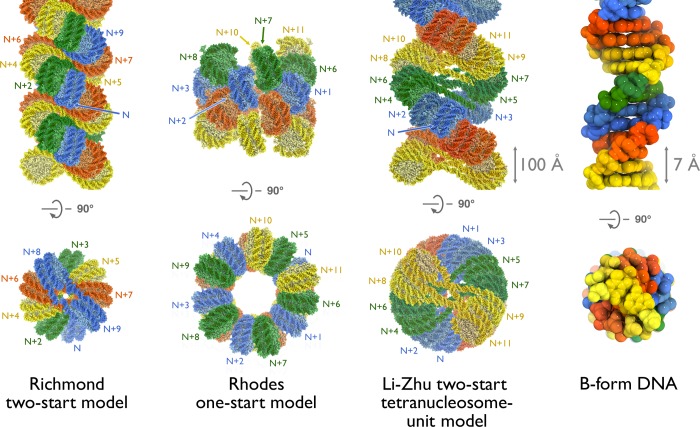
Models of
the 30 nm fiber. Orthogonal views perpendicular to the
30 nm fiber axis (top) and down the axis (bottom) of the Richmond
two-start model (left), Rhodes one-start model (center) and Li-Zhu
tetranucleosome-unit repeat two-start model (right). The sequence
of nucleosomes in each model is indicated. In the Richmond model,
each sequential pair of nucleosomes across the fiber is colored similarly.
For the Rhodes model, all nucleosomes in the same turn of the solenoid
are colored similarly. In the Li-Zhu model, each tetranucleosome repeating
unit is colored similarly. Unlabeled nucleosomes in the two-start
models are not shown in the bottom views for figure clarity. Linker
DNA is not present in the Rhodes model but, given the nature of the
solenoidal structure, must be bent. The B-form DNA double helix is
shown for comparison (far right). All models shown in space-filling
representation and scaled as indicated.
References
Publication types
MeSH terms
Substances
Grants and funding
LinkOut - more resources
Full Text Sources
Other Literature Sources
