. 2014;10(12):2193-207.
doi: 10.4161/15548627.2014.981786.

Autophagy fosters myofibroblast differentiation through MTORC2 activation and downstream upregulation of CTGF

Affiliations

Autophagy fosters myofibroblast differentiation through MTORC2 activation and downstream upregulation of CTGF

Monique Bernard et al. Autophagy. 2014.

Abstract

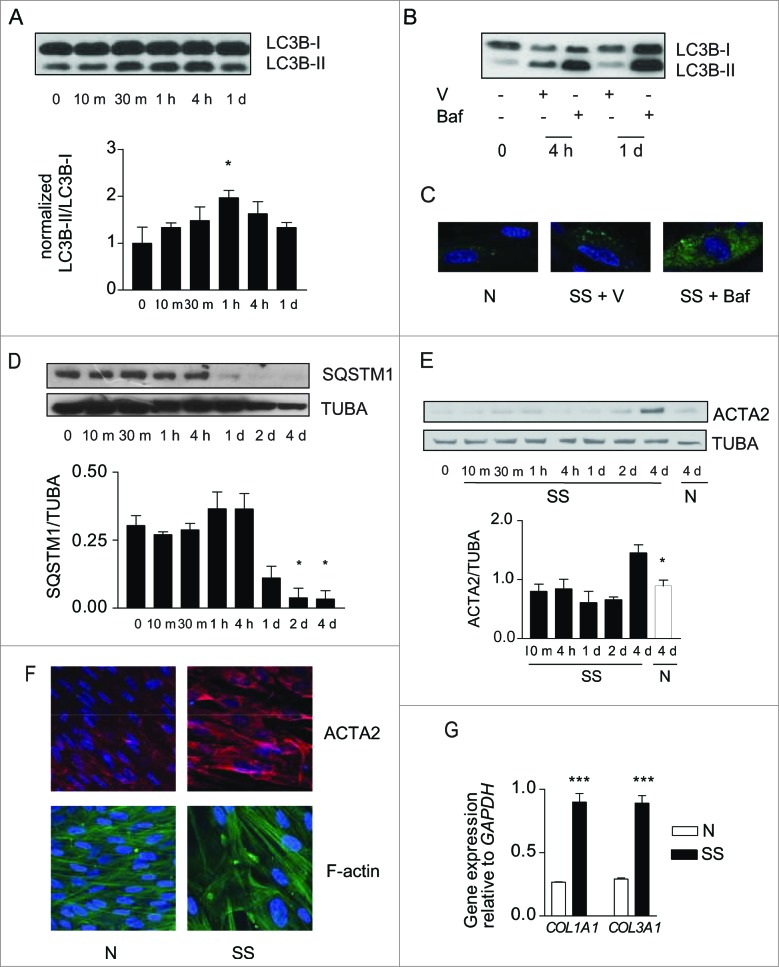
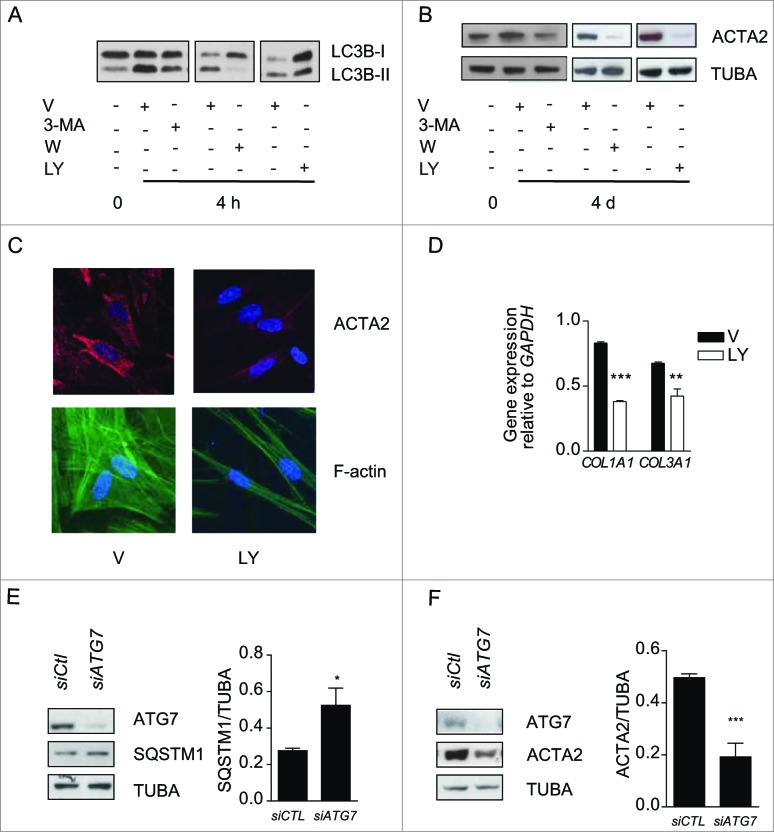
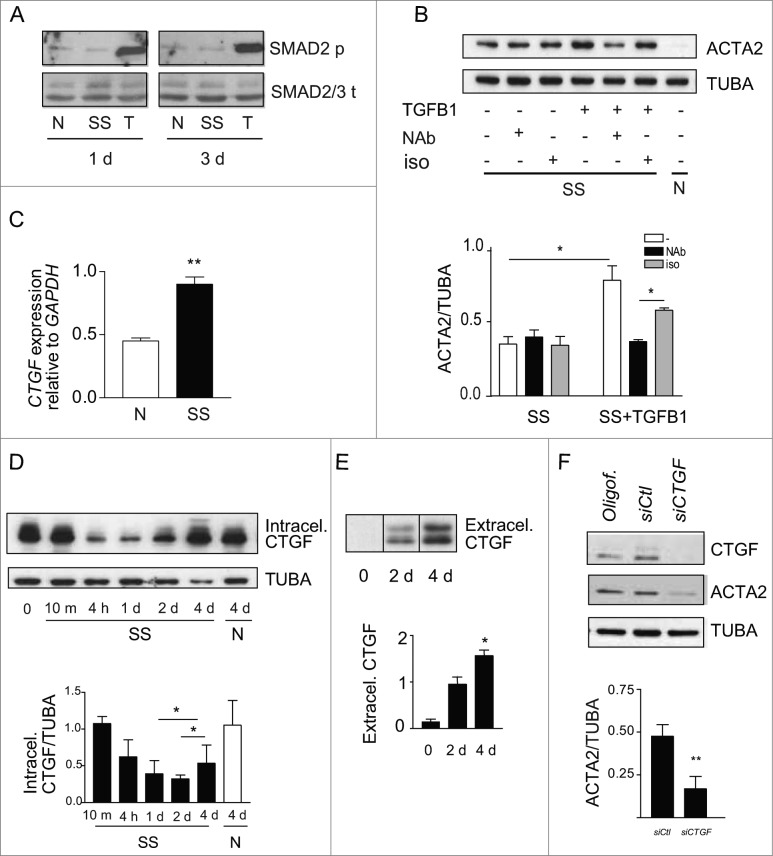
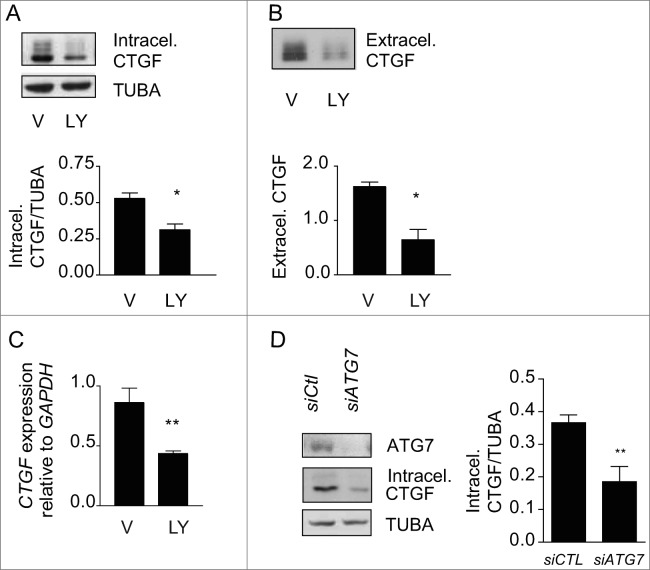
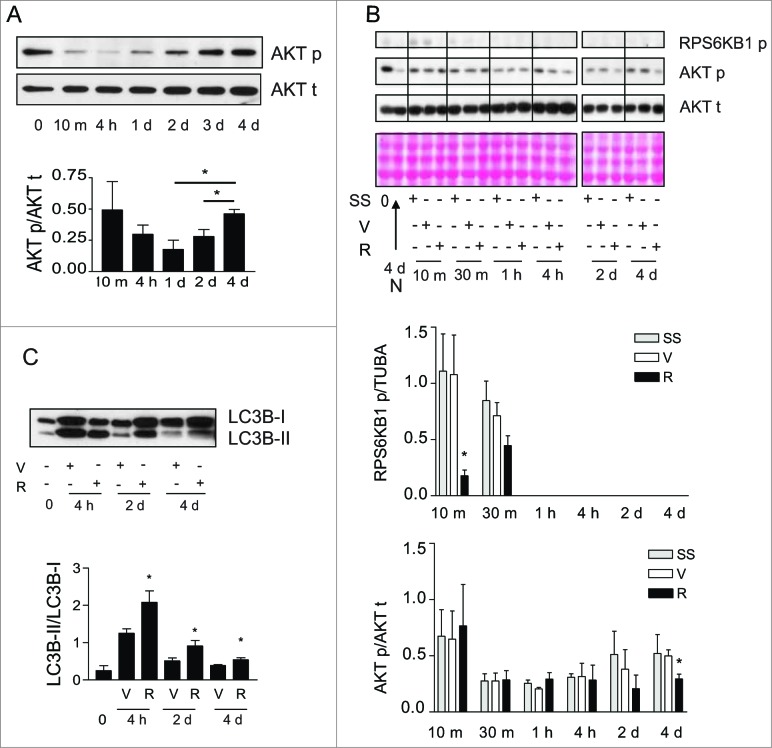
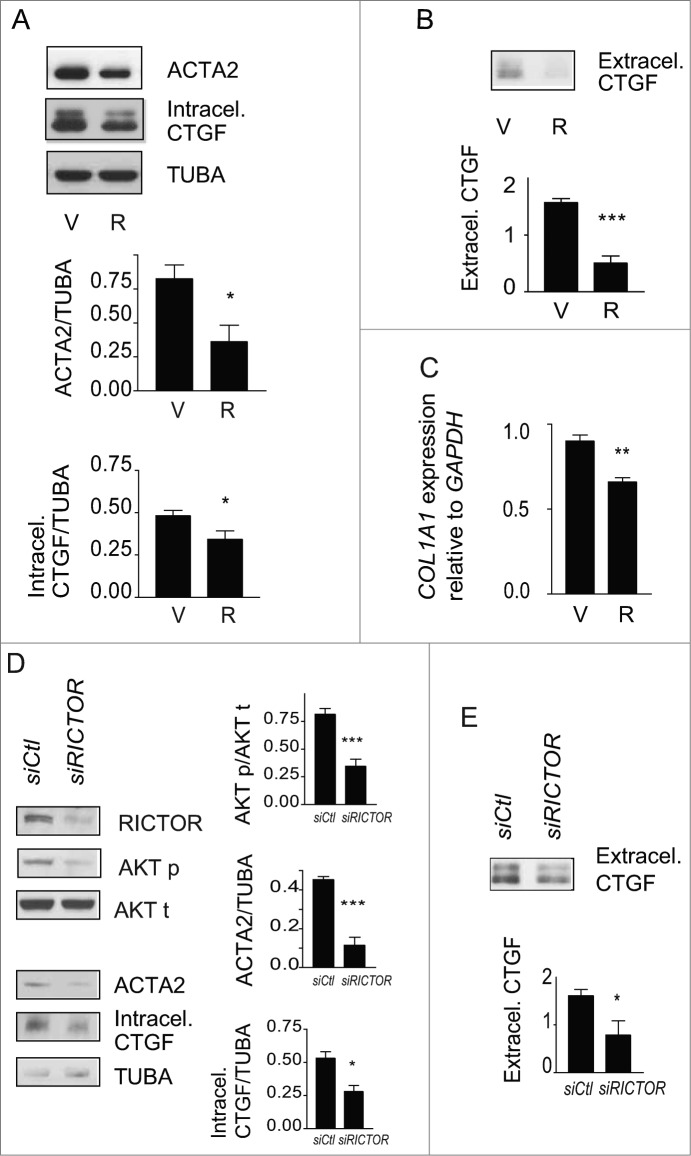
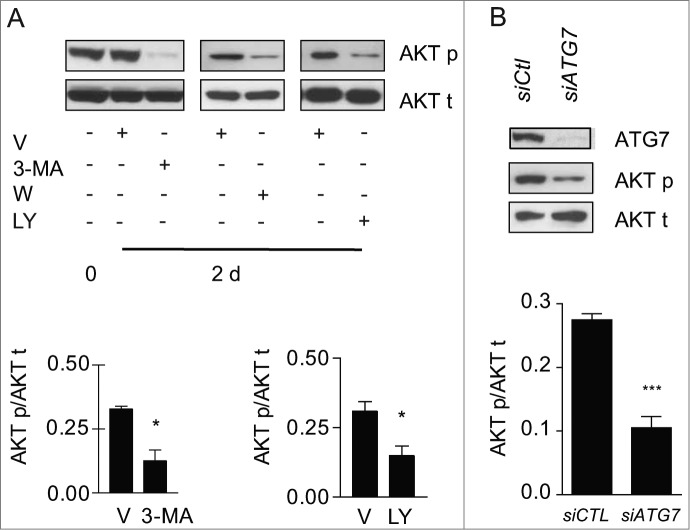
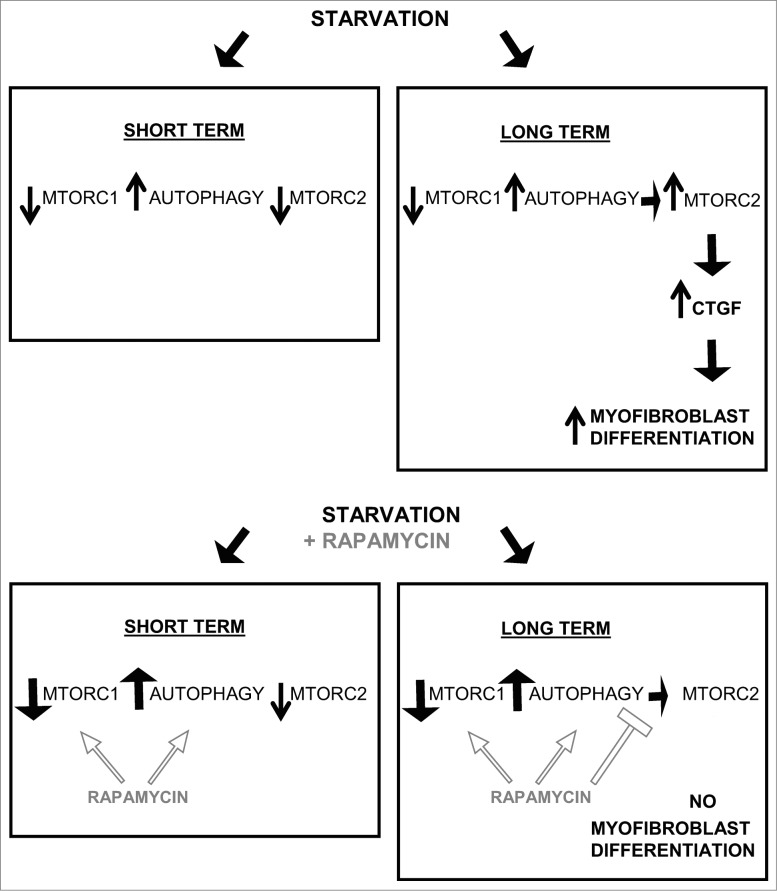
Recent evidence suggests that autophagy may favor fibrosis through enhanced differentiation of fibroblasts in myofibroblasts. Here, we sought to characterize the mediators and signaling pathways implicated in autophagy-induced myofibroblast differentiation. Fibroblasts, serum starved for up to 4 d, showed increased LC3-II/-I ratios and decreased SQSTM1/p62 levels. Autophagy was associated with acquisition of markers of myofibroblast differentiation including increased protein levels of ACTA2/αSMA (actin, α 2, smooth muscle, aorta), enhanced gene and protein levels of COL1A1 (collagen, type I, α 1) and COL3A1, and the formation of stress fibers. Inhibiting autophagy with 3 different class I phosphoinositide 3-kinase and class III phosphatidylinositol 3-kinase (PtdIns3K) inhibitors or through ATG7 silencing prevented myofibroblast differentiation. Autophagic fibroblasts showed increased expression and secretion of CTGF (connective tissue growth factor), and CTGF silencing prevented myofibroblast differentiation. Phosphorylation of the MTORC1 target RPS6KB1/p70S6K kinase was abolished in starved fibroblasts. Phosphorylation of AKT at Ser473, a MTORC2 target, was reduced after initiation of starvation but was followed by spontaneous rephosphorylation after 2 d of starvation, suggesting the reactivation of MTORC2 with sustained autophagy. Inhibiting MTORC2 activation with long-term exposure to rapamycin or by silencing RICTOR, a central component of the MTORC2 complex abolished AKT rephosphorylation. Both RICTOR silencing and rapamycin treatment prevented CTGF and ACTA2 upregulation, demonstrating the central role of MTORC2 activation in CTGF induction and myofibroblast differentiation. Finally, inhibition of autophagy with PtdIns3K inhibitors or ATG7 silencing blocked AKT rephosphorylation. Collectively, these results identify autophagy as a novel activator of MTORC2 signaling leading to CTGF induction and myofibroblast differentiation.

Keywords: 3-MA, 3-methyladenine; ACTA2, actin, α 2, smooth muscle, aorta; AKT; ATG7; Ctl, control; DAPI, 4′, 6-diamidino-2-phenylindole; ECM, extracellular matrix; FBS, fetal bovine serum; GF, growth factor; LC3B, MAP1LC3B (microtubule-associated protein 1 light chain 3 β); LY, LY294002; MTORC2; N, normal growth medium; R, rapamycin; SS, serum-free (starvation) medium; T, TGFB1 (transforming growth factor, β 1); TUBA, tubulin, α; V, vehicle; W, wortmannin; WB, western blotting; autophagy; connective tissue growth factor (CTGF); differentiation; fibroblast; fibrosis; iso, isotype control; myofibroblast; rapamycin.


Figures

Figure 1.
Figure 1.
(See previous page). Starvation induces autophagy and myofibroblast differentiation. (A) Upper panel: Western blot showing LC3B-I and -II protein levels in WI-38 fibroblasts exposed to serum-free (starvation) medium (SS). Lower panel: Densitometric analysis of LC3B-II relative to LC3B-I normalized to time 0 (representative of 4 independent experiments, *P < 0.05 t = 0 vs 1 h). (B) Western blot showing LC3B-I and -II protein levels in WI-38 fibroblasts at baseline, starved for 4 h or 1 d and exposed to DMSO (V) or bafilomycin A1 (20 nM; Baf). Representative of 3 independent experiments. (C) Evaluation of LC3B puncta by confocal microscopy in WI-38 fibroblasts infected with a baculovirus vector expressing GFP-LC3B and exposed to normal conditions (medium with 10% FBS; N), serum-free medium with DMSO (V) or serum-free medium with bafilomycin A1 (20 nM) for 1 d. Representative of 3 independent experiments. (D) Upper panel: Western blot showing SQSTM1 and tubulin (TUBA) protein levels in starved WI-38 fibroblasts. Lower panel: Densitometric analysis of SQSTM1 protein levels relative to tubulin. Data are presented as mean ± s.e.m. (representative of 4 independent experiments, *p = 0.02 4 h vs 2 d and 4 h vs 4 d). (E) Upper panel: Western blot showing ACTA2 protein levels in WI-38 fibroblasts exposed to SS medium or grown under normal conditions (N). Tubulin was used as a loading control. Lower panel: Densitometric analysis of ACTA2 protein levels relative to tubulin normalized to time 0 (representative of 4 independent experiments; *p = 0.0170 SS vs N at 4 d). (F) Evaluation of the myofibroblast markers ACTA2 (red) and stress fiber (green) by immunofluorescence microscopy in cells grown in normal medium (N) or maintained without serum (SS) for 4 d. Representative of 3 independent experiments. (G) Real-time qPCR evaluation of mRNA levels of COL1A1 and COL3A1 after 4 d in N or SS. GAPDH was used as the reference gene (***P < 0.001 N vs SS, representative of 2 independent experiments performed in triplicate).
Figure 2.
Figure 2.
Autophagy induces myofibroblast differentiation in starved fibroblasts. (A) Western blot showing LC3B-I and -II protein levels in WI-38 fibroblasts at baseline or starved in the presence of 3-methyladenine (1 mM; 3-MA), wortmannin (100 nM; W), LY294002 (5 μM; LY) or vehicle (V) for 4 h. Representative of 4 independent experiments. (B) Western blot showing ACTA2 protein levels in WI-38 fibroblasts at baseline or starved and incubated with the same inhibitors as in A for 4 d. Representative of 4 independent experiments. (C) Evaluation of the myofibroblast markers ACTA2 (red) and stress fiber formation (green) by immunofluorescence microscopy in fibroblasts exposed to SS in the presence of LY or V for 4 d. Cell nuclei are visualized in blue. ACTA2 and stress fiber staining of fibroblasts grown in normal medium or starved for 4 d from the same experiment are shown in Figure 1F. Representative of 3 independent experiments. (D) COL1A1 and COL3A1 mRNA levels evaluated by real time qPCR in WI-38 fibroblasts serum starved for 4 d in the presence of the PtdIns3K inhibitor LY or vehicle. GAPDH was used as the reference gene (***P < 0.001 V vs LY for COL1A1 and **P < 0.01 V vs LY for COL3A1). Collagen mRNA levels of fibroblasts grown in normal medium or starved for 4 d from the same experiment are shown in Figure 1G. Representative of 2 independent experiments performed in triplicate. (E) Left panel: Western blot showing ATG7, SQSTM1 and tubulin (TUBA) protein levels in WI-38 fibroblasts starved for 2 d post-nucleofection with control siRNA (siCTL) or ATG7 siRNA (siATG7). Representative of 3 independent experiments. Right panel: Densitometric analysis of SQSTM1 protein level relative to tubulin (representative of 3 independent experiments, *p = 0.0318) in WI-38 fibroblasts silenced for ATG7 expression (ATG7 silencing is effective at 80.6% ± 6.0%, representative of 3 independent experiments, ***P < 0.0001). (F) Left panel: Western blot showing ATG7, ACTA2, and tubulin (TUBA) protein levels in WI-38 fibroblasts starved for 4 d post-nucleofection with control siRNA (siCTL) or ATG7 siRNA (siATG7). Representative of 4 independent experiments. Right panel: Densitometric analysis of ACTA2 level relative to tubulin (***p = 0.0005 representative of 4 independent experiments) in WI-38 fibroblasts silenced for ATG7 expression (ATG7 silencing is effective at 87.4% ± 4.4%, from 4 independent experiments, ***P < 0.0001).
Figure 3.
Figure 3.
(See previous page). Myofibroblast differentiation induced by starvation is dependent on CTGF upregulation. (A) Western blot showing phosphorylated SMAD2 and total SMAD2/3 in WI-38 fibroblasts cultured under normal conditions (N), serum starved (SS) or incubated with human recombinant TGFB1 (2 ng/ml) in SS for 1 or 3 d. Incubation with TGFB1 was used as a positive control for SMAD signaling. Representative of 3 independent experiments. (B) Upper panel: Western blot showing ACTA2 protein levels in WI-38 fibroblasts exposed to SS for 4 d in the presence of a neutralizing antibody (NAb) against pan-TGFB, or isotype-matched control (iso), both at 10 ug/ml. Recombinant human TGFB1 (0.1 ng/ml) was used as a positive control for the neutralizing activity of the pan-TGFB antibody. Representative of 4 independent experiments. Lower panel: Densitometric analysis of ACTA2 relative to tubulin (TUBA) protein levels (representative of 4 independent experiments, *p = 0.03 neutralizing antibody vs iso in the presence of TGFB1, *p = 0.03 SS vs TGFB1 in SS). (C) Evaluation of CTGF expression by real time qPCR in WI-38 fibroblasts exposed to serum-free medium (SS) or grown in normal condition (N) for 4 d (**p = 0.002). Representative of 2 independent experiments performed in triplicate. (D) Upper panel: Western blot showing intracellular CTGF protein levels in WI-38 fibroblasts at baseline, starved for up to 4 d or maintained in normal medium for 4 d. Representative of 8 independent experiments. Lower panel: Densitometric analysis of intracellular CTGF relative to tubulin protein levels normalized to time 0 (representative of 8 independent experiments, *p = 0.01 1d vs 4 d and 2 d vs 4 d in SS). (E) Upper panel: Evaluation of extracellular CTGF by WB in media conditioned by WI-38 fibroblasts exposed to SS for 0, 2 or 4 d. Representative of 8 independent experiments. Lower panel: Densitometric analysis of extracellular CTGF (representative of 8 independent experiments, *p = 0.01 2 d vs 4 d). (F) Upper panel: Western blot showing intracellular CTGF and ACTA2 protein levels in WI-38 fibroblasts exposed to SS for 5 d post-transfection with control siRNA (siCTL) or siRNA specific to CTGF (siCTGF). Representative of 5 independent experiments. Lower panel: Densitometric analysis of ACTA2 level relative to tubulin (representative of 5 independent experiments, **p = 0.004) in WI-38 fibroblasts silenced for CTGF expression (CTGF silencing is effective at 77.3% ± 4.8%, representative of 5 independent experiments, ***p = 0.0002).
Figure 4.
Figure 4.
Autophagy is central for CTGF upregulation in starved fibroblasts. (A) Upper panel: Western blot showing intracellular CTGF protein levels in serum-starved WI-38 fibroblasts incubated with the autophagy inhibitor LY294002 5 uM (LY) or vehicle (V) for 4 d. Representative of 4 independent experiments. Lower panel: Densitometric analysis of intracellular CTGF protein levels relative to tubulin (representative of 4 independent experiments, *p = 0.0286). (B) Upper panel: Western blot of extracellular CTGF protein levels in media conditioned by starved WI-38 fibroblasts in the presence of the inhibitor LY294002 5 uM (LY) or vehicle (V) for 4 d. Representative of 4 independent experiments. Lower panel: Densitometric analysis of extracellular CTGF protein levels (representative of 4 independent experiments, *p = 0.03 V vs LY at 4 d). (C) Evaluation of CTGF expression by qPCR in WI-38 fibroblasts exposed to serum-free medium (SS) in the presence of LY294002 5 uM (LY) or vehicle (V) for 4 d (**p = 0.0036). CTGF expression was normalized to GAPDH. CTGF mRNA levels of fibroblasts grown in normal medium or starved for 4 d from the same experiment are shown in Figure 3C. Representative of 2 independent experiments performed in triplicate. (D) Left panel: Western blot showing ATG7, CTGF and tubulin (TUBA) protein levels in WI-38 fibroblasts exposed to SS for 4 d post-nucleofection with control siRNA (siCTL) or siRNA specific to ATG7 (siATG7). Representative of 4 independent experiments. Right panel: Densitometric analysis of CTGF level relative to tubulin (**p = 0.0087 representative of 4 independent experiments) in WI-38 fibroblasts silenced for ATG7 expression (ATG7 silencing is effective at 87.4% ± 4.4%, representative of 4 independent experiments, *** P < 0.0001).
Figure 5.
Figure 5.
Activation of MTORC2 signaling in starved fibroblasts. (A) Upper panel: Western blot showing phosphorylation of AKT Ser473 (AKT p) and total AKT (AKT t) in WI-38 fibroblasts at baseline and exposed to serum-free medium (SS) for up to 4 d. Representative of 5 independent experiments. Lower panel: Densitometric analysis of AKT p relative to AKT t normalized to time 0 (representative of 5 independent experiments, *p = 0.0189 2 d vs 4 d and *p = 0.0238 1d vs 4 d). (B) Upper panel: Western blot showing phosphorylation of RPS6KB1 (MTORC1 downstream target) and phosphorylation of AKT Ser473 (MTORC2 target) in WI-38 fibroblasts at baseline and starved (SS) for up to 4 d in the presence of rapamycin (10 nM; R) or vehicle (V). Total AKT level was also evaluated by WB. Ponceau Red staining was used as loading control. Representative of 4 independent experiments. Middle panel: Densitometric analysis of phosphorylated RPS6KB1 relative to tubulin (representative of 4 independent experiments, *p = 0.0286 V vs R at 10 min). Data were normalized to baseline. Lower panel: Densitometric analysis of AKT p relative to AKT t (representative of 4 independent experiments, *p = 0.0237 V vs R at d 4). Data were normalized to baseline. (C) Upper panel: Western blot showing LC3B-I and -II protein levels in WI-38 fibroblasts at baseline or exposed to SS for 4 h, 2 d or 4 d in the presence of rapamycin (10 nM; R) or vehicle (V). Representative of 5 independent experiments. Lower panel: Densitometric analysis of LC3B-II relative to LC3B-I (representative of 5 independent experiments; *p = 0.0456 V vs R at 4 h, *p = 0.0444 V vs R at 2 d, *p = 0.0266 V vs R at 4 d).
Figure 6.
Figure 6.
Blockade of autophagy-induced myofibroblast differentiation by rapamycin. (A) Upper panel: Western blot showing ACTA2 and intracellular CTGF protein levels in serum-starved WI-38 fibroblasts incubated with the MTOR inhibitor rapamycin (10 nM; R) or vehicle (V) for 4 d. Representative of 5 independent experiments. Middle panel: Densitometric analysis of ACTA2 protein levels relative to tubulin (representative of 5 independent experiments; *p = 0.0189). Lower panel: Densitometric analysis of intracellular CTGF protein levels relative to tubulin (representative of 5 independent experiments, *p = 0.0485). (B) Upper panel: Western blot showing extracellular CTGF protein levels in media conditioned by WI-38 fibroblasts starved in the presence of rapamycin (R) or vehicle (V) for 4 d. Representative of 5 independent experiments. Lower panel: Densitometric analysis of extracellular CTGF, representative of 5 independent experiments, ***P < 0.0001 V vs R. (C) Evaluation of the expression of the myofibroblast marker COL1A1 by real-time qPCR in WI-38 fibroblasts serum starved for 4 d in the presence of rapamycin (10 nM; R) or vehicle (V) (**p = 0.005 V vs R). Collagen mRNA levels of fibroblasts grown in normal medium or starved for 4 d from the same experiment are shown in Figure 1G. Representative of 2 independent experiments performed in triplicate. (D) Effects of MTORC2 inhibition by RICTOR silencing on levels of downstream target AKT phosphorylation, myofibroblast marker ACTA2, and intracellular CTGF. Left panel: Cells were incubated in SS for 4 d after electroporation with control siRNA (siCTL) or siRICTOR. Cell lysates were analyzed by WB. Inhibition of RICTOR expression (82.3 +/- 17.3%, representative of 4 independent experiments, ***P < 0.0001) was achieved over siCTL. Right upper panel: Densitometric analysis of AKT p relative to total AKT (representative of 4 independent experiments; ***p = 0.0002). Right middle panel: Densitometric analysis of ACTA2 relative to tubulin (representative of 4 independent experiments; ***p = 0.0003). Right lower panel: Densitometric analysis of intracellular CTGF relative to tubulin (representative of 4 independent experiments; *p = 0.0286). (E) Upper panel: Evaluation of extracellular CTGF by WB in conditioned media from the experiment described in (C). Lower panel: Densitometric analysis of extracellular CTGF (representative of 4 independent experiments; *p = 0.0286).
Figure 7.
Figure 7.
Autophagy is essential for MTORC2 activity induced by serum starvation. (A) Upper panel: Evaluation of AKT Ser473 phosphorylation (AKT p) and total AKT (AKT t) by WB in WI-38 fibroblasts at baseline or exposed to SS plus vehicle for 2 d or maintained in SS with the autophagy inhibitors 3-methyladenine (1 mM; 3-MA), wortmannin (100 nM; W), or LY294002 (5 μM; LY). Representative of 4 independent experiments. Lower left panel: Densitometric analysis of AKT p relative to AKT t in cells exposed to DMSO or 3-MA (representative of 4 independent experiments, *p = 0.0286). Lower right panel: Densitometric analysis of AKT p relative to AKT t in cells exposed to DMSO or LY (representative of 4 independent experiments, *p = 0.0114 V vs LY at d 2). (B) Upper panel: Evaluation of AKT Ser473 phosphorylation (AKT p) and total AKT (AKT t) by WB in WI-38 fibroblasts exposed to SS for 2 d post-transfection with control siRNA (siCTL) or siRNA specific to ATG7 (siATG7). Representative of 3 independent experiments. Lower panel: Densitometric analysis of AKT p protein level relative to AKT t (representative of 3 independent experiments, ***P < 0.0001) in WI-38 fibroblasts silenced for ATG7 expression (ATG7 silencing is effective at 80.6% ± 6.0%, representative of 3 independent experiments, ***P < 0.0001).
Figure 8.
Figure 8.
Long-term autophagy favors MTORC2 activation leading to enhanced CTGF production and myofibroblast differentiation. Short-term serum starvation inactivates MTORC1 and MTORC2 signaling leading to dephosphorylation of RPS6KB1 (Thr389) and AKT (Ser473). MTORC1 inhibition induces autophagy, demonstrated by a higher LC3B-II/-I ratio and lower SQSTM1 level. Rapamycin increases autophagy by further inhibiting MTORC1. A sustained autophagic response is responsible for the MTORC2 reactivation when fibroblasts are starved for 2 d or more (long term), as measured by rephosphorylation of AKT at Ser473. In turn, MTORC2 activity drives the production and secretion of the pro-fibrotic cytokine CTGF leading to myofibroblast differentiation. Long-term exposure to rapamycin inactivates MTORC1 leading to an increased autophagic response, but prevents MTORC2 activation and downstream CTGF induction and myofibroblast differentiation.

References

    1. Hinz B. Formation and function of the myofibroblast during tissue repair. J Invest Dermatol 2007; 127:526-37; PMID:17299435; http://dx.doi.org/10.1038/sj.jid.5700613 - DOI - PubMed
    1. Wynn TA. Common and unique mechanisms regulate fibrosis in various fibroproliferative diseases. J Clin Invest 2007; 117:524-9; PMID:17332879; http://dx.doi.org/10.1172/JCI31487 - DOI - PMC - PubMed
    1. Tomasek JJ, Gabbiani G, Hinz B, Chaponnier C, Brown RA. Myofibroblasts and mechano-regulation of connective tissue remodelling. Nat Rev Mol Cell Bio 2002; 3:349-63; http://dx.doi.org/10.1038/nrm809 - DOI - PubMed
    1. Hinz B, Gabbiani G. Fibrosis: recent advances in myofibroblast biology and new therapeutic perspectives. F1000 Biol Rep 2010; 2:78; PMID:21170369; http://dx.doi.org/10.3410/B2-78 - DOI - PMC - PubMed
    1. Desmouliere A, Darby IA, Gabbiani G. Normal and pathologic soft tissue remodeling: role of the myofibroblast, with special emphasis on liver and kidney fibrosis. Lab Invest 2003; 83:1689-707; PMID:14691287; http://dx.doi.org/10.1097/01.LAB.0000101911.53973.90 - DOI - PubMed

Publication types

MeSH terms

Substances