. 2014 Dec 11;15(1):406.
doi: 10.1186/s12859-014-0406-y.

CLAST: CUDA implemented large-scale alignment search tool

Affiliations

CLAST: CUDA implemented large-scale alignment search tool

Masahiro Yano et al. BMC Bioinformatics. .

Abstract

Background: Metagenomics is a powerful methodology to study microbial communities, but it is highly dependent on nucleotide sequence similarity searching against sequence databases. Metagenomic analyses with next-generation sequencing technologies produce enormous numbers of reads from microbial communities, and many reads are derived from microbes whose genomes have not yet been sequenced, limiting the usefulness of existing sequence similarity search tools. Therefore, there is a clear need for a sequence similarity search tool that can rapidly detect weak similarity in large datasets.

Results: We developed a tool, which we named CLAST (CUDA implemented large-scale alignment search tool), that enables analyses of millions of reads and thousands of reference genome sequences, and runs on NVIDIA Fermi architecture graphics processing units. CLAST has four main advantages over existing alignment tools. First, CLAST was capable of identifying sequence similarities ~80.8 times faster than BLAST and 9.6 times faster than BLAT. Second, CLAST executes global alignment as the default (local alignment is also an option), enabling CLAST to assign reads to taxonomic and functional groups based on evolutionarily distant nucleotide sequences with high accuracy. Third, CLAST does not need a preprocessed sequence database like Burrows-Wheeler Transform-based tools, and this enables CLAST to incorporate large, frequently updated sequence databases. Fourth, CLAST requires <2 GB of main memory, making it possible to run CLAST on a standard desktop computer or server node.

Conclusions: CLAST achieved very high speed (similar to the Burrows-Wheeler Transform-based Bowtie 2 for long reads) and sensitivity (equal to BLAST, BLAT, and FR-HIT) without the need for extensive database preprocessing or a specialized computing platform. Our results demonstrate that CLAST has the potential to be one of the most powerful and realistic approaches to analyze the massive amount of sequence data from next-generation sequencing technologies.


Figures

Figure 1
Figure 1
Overview of the CLAST search processing phases. (A) A read-only q-gram index was generated from reference genome sequences using a novel algorithm for parallel architecture (Figure 3). (B) The query sequences were searched against the read-only q-gram index. (C) Seeds were filtered to reduce calculation time (Figure 4). (D) The seed sequences were aligned to the reference genome sequences (Figure 2). (E) Results were filtered according to E-value and alignment length.
Figure 2
Figure 2
Banded global and local alignment. (A) The gray area denotes the region of alignment in this banded alignment. Sequences were aligned from the edges of the seed in both the global and local modes. Sequence comparison ended at the maximal alignment score in gray area in the global alignment (B) and local alignment (C).
Figure 3
Figure 3
General algorithm for creating the read-only q-gram index in a parallel architecture. (A) The parallel algorithm to create a read-only q-gram index. (B) The algorithm to obtain a corresponding value stored in the read-only q-gram index of a queryKey. (C) The parallel algorithm to obtain the corresponding values stored in the read-only q-gram index of many queryKey.
Figure 4
Figure 4
Algorithm to reduce the number of seeds. (A) The gray area represents the “surrounding area” of each seed. (B) An example of seeds that is to be reduced. The number of each seed represents the order of seeds that is sorted by its position. (C) The first algorithm to check the seeds. A balloon means that next seed is in surrounding area, and a x-mark means not. CLAST removes the seeds with x-mark. (D) The second algorithm to check the seeds. A x-mark means that next seed is in surrounding area, and a baloon means not. CLAST removes the seeds with x-mark. (E) The seeds that remains in this example. The seeds are isolated, there is no seeds in surrounding area.
Figure 5
Figure 5
Result of each accuracy test. Both of the graph represent the results of simulated metagenomic analysis test. Horizontal axis represents bit score calculated by SSEARCH, and vertical axis represents ratio of accurately found hits. (A) Results of 100 base accuracy test. (B) Results of 800 base accuracy test.
Figure 6
Figure 6
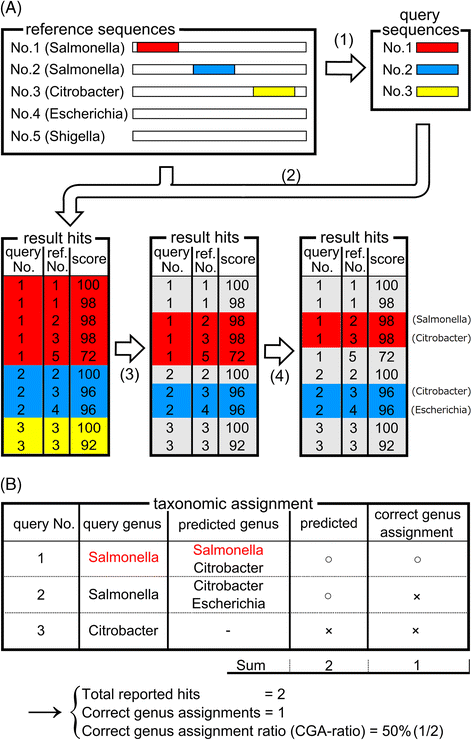
Comparison of the search accuracy of different alignment tools. (A) Taxonomic assignment of the query sequences in the simulated metagenomic analysis test was performed in the following steps: 1: Query sequences were generated by randomly selecting short fragments from reference genome sequences. 2: Sequence similarities were calculated between the query and reference genome sequences. 3: If a query matched to the original reference sequence, it was deleted from the results. 4: The best non-self hits were selected for taxonomic assignment. (B) Whether the result of taxonomic assignment were correct or not were assessed based on the taxonomic databases.
Figure 7
Figure 7
Search calculation time of each simulated metagenomic analysis test. The time for each tool to search 100,000 query reads against 2,314 reference genome sequences. Horizontal axis represents calculation time. (A) Results of 100 base test. (B) Results of 800 base test.
Figure 8
Figure 8
Results of the simulated metagenomic analysis test. Blue: Number of query reads that had at least one similar sequence in the database (total reported hits). Red: Number of query reads with correct taxonomic assignment (correct genus assignments). Percentages are the CGA ratio (correct genus assignments/total reported hits × 100). Horizontal axis represents number of queries. (A) Results of 100 base test. (B) Results of 800 base test.
Figure 9
Figure 9
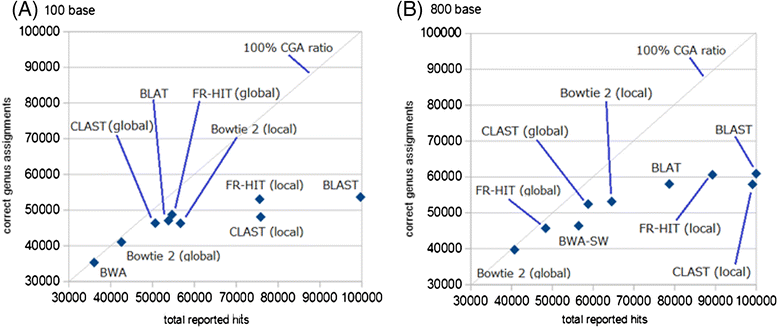
Relationships of sensitivity (total reported hits) and specificity (correct genus assignments) for each software both of the 100 base test and the 800 base test. Each point represents the result of simulated metagenomic analysis of BLAST, BLAT, CLAST (both global and local mode), FR-HIT (both global and local mode), BWA, BWA-SW, Bowtie 2 (both global and local mode). The gray slanting line of each graph represents 100 % CGA ratio. All points cannot be above the gray line. Horizontal axis represents total reported hits, and vertical axis represents correct genus assignments. (A) Results of 100 base test. (B) Results of 800 base test.
Figure 10
Figure 10
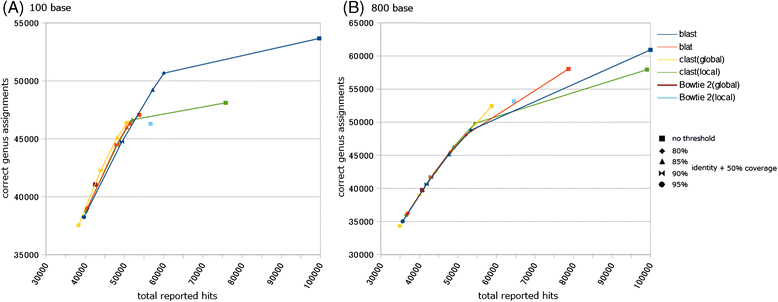
Relationships between sensitivity and specificity of BLAST, BLAT, and CLAST by changing the identity threshold both of the 100 base test and the 800 base test. Each curve represents the results of simulated metagenomic analysis of BLAST, BLAT, and CLAST (both global and local modes) under several thresholds. Each curve consists of the 5 points, indicating the results of simulated metagenomic analysis with 5 different thresholds. One point is the result that was not filtered by any identity and coverage thresholds (same with the point in Figure 9), and the others are based on the results that were filtered by an identity threshold and a coverage threshold. The identity thresholds were 95%, 90%, 85%, and 80%. The coverage threshold was unified to 50%. In all curves, high identity thresholds represent small numbers of total reported hits and correct genus assignments (Additional file 7). The points of Bowtie 2 results (both global and local modes) that were not filtered by any identity and coverage thresholds (same with the points in Figure 9) are also plotted to be able to compare with the curves of other tools. Horizontal axis represents total reported hits, and vertical axis represents correct genus assignments. (A) Results of 100 base test. (B) Results of 800 base test.
Figure 11
Figure 11
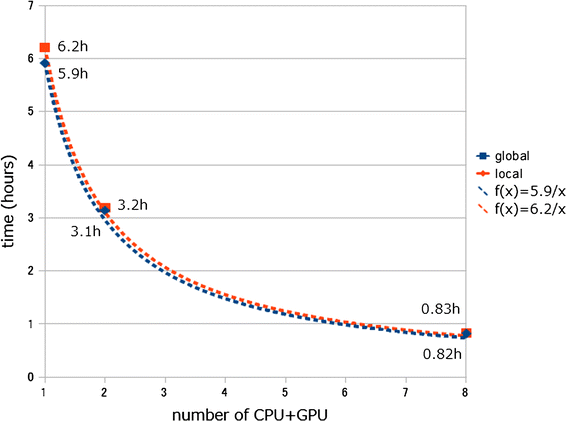
Calculation time of CLAST with real metagenomic reads.
Figure 12
Figure 12
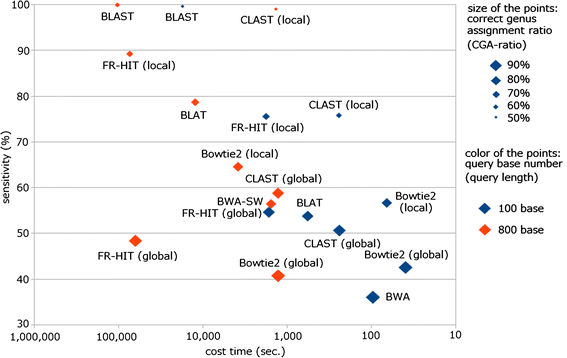
Scatter diagram of sensitivity versus time use.

References

    1. Performance and Specifications for HiSeq 2500/1500 [http://www.illumina.com/systems/hiseq_2500_1500/performance_specificatio...]
    1. Qin J, Li R, Raes J, Arumugam M, Burgdorf KS, Manichanh C, Nielsen T, Pons N, Levenez F, Yamada T, Mende DR, Li J, Xu J, Li S, Li D, Cao J, Wang B, Liang H, Zheng H, Xie Y, Tap J, Lepage P, Bertalan M, Batto J-M, Hansen T, Le Paslier D, Linneberg A, Nielsen HB, Pelletier E, Renault P, et al. A human gut microbial gene catalogue established by metagenomic sequencing. Nature. 2010;464:59–65. doi: 10.1038/nature08821. - DOI - PMC - PubMed
    1. The Human Microbiome Project Consortium A framework for human microbiome research. Nature. 2012;486:215–221. doi: 10.1038/nature11209. - DOI - PMC - PubMed
    1. Altschul SF, Gish W, Miller W, Myers EW, Lipman DJ. Basic local alignment search tool. J Mol Biol. 1990;215:403–410. doi: 10.1016/S0022-2836(05)80360-2. - DOI - PubMed
    1. Kent WJ. BLAT–the BLAST-like alignment tool. Genome Res. 2002;12:656–664. doi: 10.1101/gr.229202.ArticlepublishedonlinebeforeMarch2002. - DOI - PMC - PubMed

Publication types