. 2015 Jan 20;87(2):884-91.
doi: 10.1021/ac5025649. Epub 2014 Dec 26.

Autonomous metabolomics for rapid metabolite identification in global profiling

Affiliations

Autonomous metabolomics for rapid metabolite identification in global profiling

H Paul Benton et al. Anal Chem. .

Abstract

An autonomous metabolomic workflow combining mass spectrometry analysis with tandem mass spectrometry data acquisition was designed to allow for simultaneous data processing and metabolite characterization. Although previously tandem mass spectrometry data have been generated on the fly, the experiments described herein combine this technology with the bioinformatic resources of XCMS and METLIN. As a result of this unique integration, we can analyze large profiling datasets and simultaneously obtain structural identifications. Validation of the workflow on bacterial samples allowed the profiling on the order of a thousand metabolite features with simultaneous tandem mass spectra data acquisition. The tandem mass spectrometry data acquisition enabled automatic search and matching against the METLIN tandem mass spectrometry database, shortening the current workflow from days to hours. Overall, the autonomous approach to untargeted metabolomics provides an efficient means of metabolomic profiling, and will ultimately allow the more rapid integration of comparative analyses, metabolite identification, and data analysis at a systems biology level.


Figures

Figure 1
Figure 1
An autonomous vs conventional mass spectrometry-based metabolomic workflow. The autonomous workflow is based on parallel untargeted MS1 and MS2 data acquisition, where cycle time is optimized as a compromise for high peak definition (MS1 for comparative quantitative analysis) and high quality MS2 (for MS/MS matching to facilitate metabolite identification). The conventional workflow, the untargeted MS1 data acquisition for comparative quantitative analysis and targeted MS2 data acquisition of dysregulated features of interest (for metabolite identification) are performed in two subsequent steps. The autonomous workflow can be accomplished through the direct link between XCMS software and METLIN metabolite database.
Figure 2
Figure 2
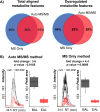
Characterization of the metabolic response of Desulfovibrio vulgaris (DVH) biofilm grown in the electron acceptor limited (EAL) conditions, using both auto MS/MS and MS-only acquisition method. (A) The overlap between metabolite features acquired with auto MS/MS method vs MS only method. Dysregulated metabolite features were defined using following parameters: p-value ≤ 0.05, intensity ≥ 1000. (B) Metabolite feature characterized by m/z 132.030 and retention time 24.6 min (MS/MS match, aspartic acid), its extracted ion chromatograms (EICs), p-values and fold-changes when acquired with auto MS/MS and MS only method. Red lines, biofilm grown in EAL conditions (n = 4); black lines, biofilm grown in balanced conditions (n = 4).
Figure 3
Figure 3
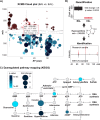
Autonomous metabolomic approach for simultaneous comparative analysis and identification of metabolites. (A) XCMS Cloud plot representation of the dysregulated metabolite features from Desulfovibrio vulgaris biofilm grown in electron acceptor limited conditions: red bubbles represent up-regulated features and blue bubbles represent down-regulated features. (B) Relative quantification and MS/MS matching identification of hypoxanthine as intermediary metabolite in purine metabolism. (C) Pathway mapping of dysregulated metabolite features using KEGG. Identified metabolites and their role in the purine metabolism pathway: blue circles represent down-regulated metabolites and the size of the circle represents the fold change.
Figure 4
Figure 4
MS/MS spectral matching of the MS/MS data, acquired “on-the-fly”, against METLIN metabolite database. MS/MS data were acquired at 50 ms scanning rate per spectra.
Figure 5
Figure 5
Preferred auto MS/MS increased MS/MS coverage of credentialed features relative to a naive experiment. Credentialed or biologically relevant features comprise only a portion of a metabolomic data set. The utilization of credentialed features to generate a preferred ion list increased auto MS/MS coverage to 78% of credentialed features.

References

    1. Patti G. J.; Yanes O.; Siuzdak G. Nat. Rev. Mol. Cell Biol. 2012, 13, 263–269. - PMC - PubMed
    1. Fiehn O.; Kopka J.; Dormann P.; Altmann T.; Trethewey R. N.; Willmitzer L. Nat. Biotechnol. 2000, 18, 1157–1161. - PubMed
    1. Dettmer K.; Aronov P. A.; Hammock B. D. Mass Spectrom. Rev. 2007, 26, 51–78. - PMC - PubMed
    1. van der Greef J.; van Wietmarschen H.; van Ommen B.; Verheij E. Mass Spectrom. Rev. 2013, 32, 399–415. - PubMed
    1. Johnson C. H.; Gonzalez F. J. J. Cell. Physiol. 2012, 227, 2975–2981. - PMC - PubMed

Publication types

MeSH terms