

Pan-African phylogeny of Mus (subgenus Nannomys) reveals one of the most successful mammal radiations in Africa
- PMID: 25496476
- PMCID: PMC4280006
- DOI: 10.1186/s12862-014-0256-2
Pan-African phylogeny of Mus (subgenus Nannomys) reveals one of the most successful mammal radiations in Africa
Abstract
Background: Rodents of the genus Mus represent one of the most valuable biological models for biomedical and evolutionary research. Out of the four currently recognized subgenera, Nannomys (African pygmy mice, including the smallest rodents in the world) comprises the only original African lineage. Species of this subgenus became important models for the study of sex determination in mammals and they are also hosts of potentially dangerous pathogens. Nannomys ancestors colonized Africa from Asia at the end of Miocene and Eastern Africa should be considered as the place of their first radiation. In sharp contrast with this fact and despite the biological importance of Nannomys, the specimens from Eastern Africa were obviously under-represented in previous studies and the phylogenetic and distributional patterns were thus incomplete.
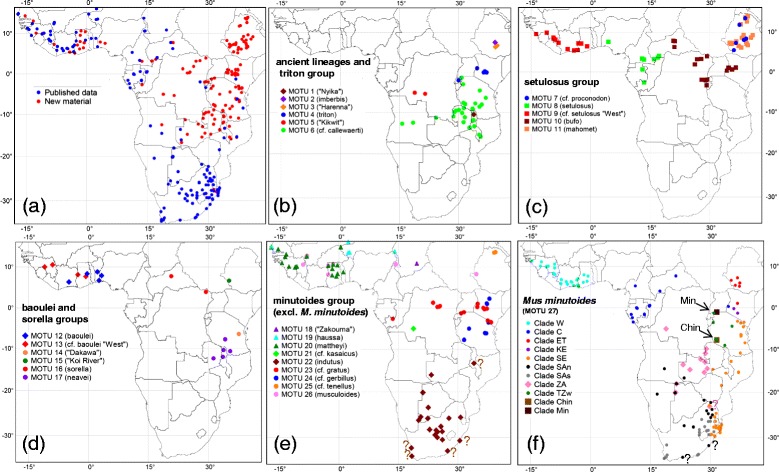
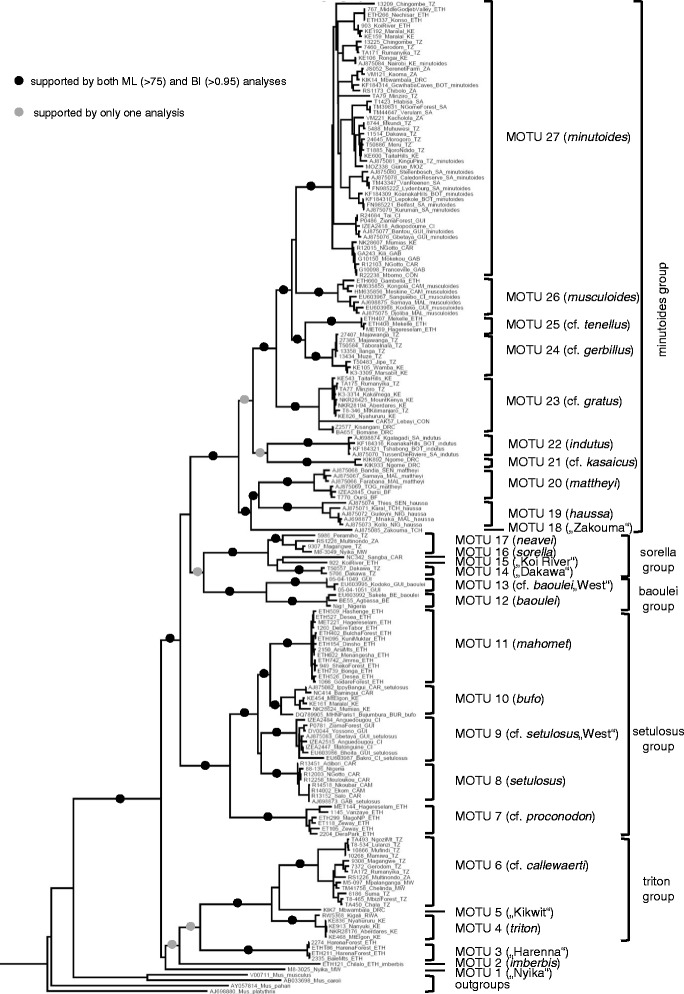
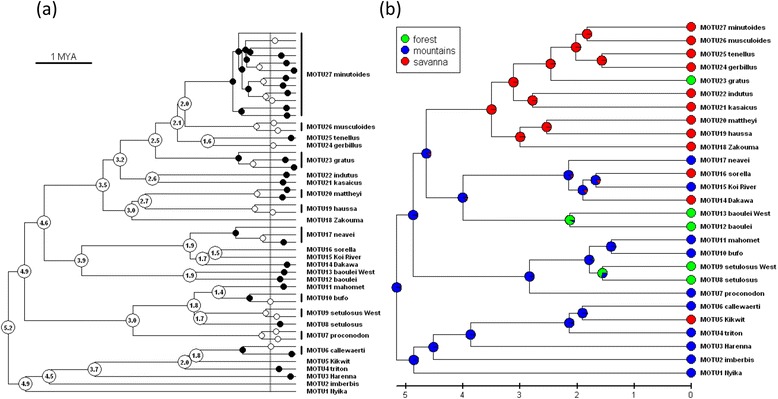
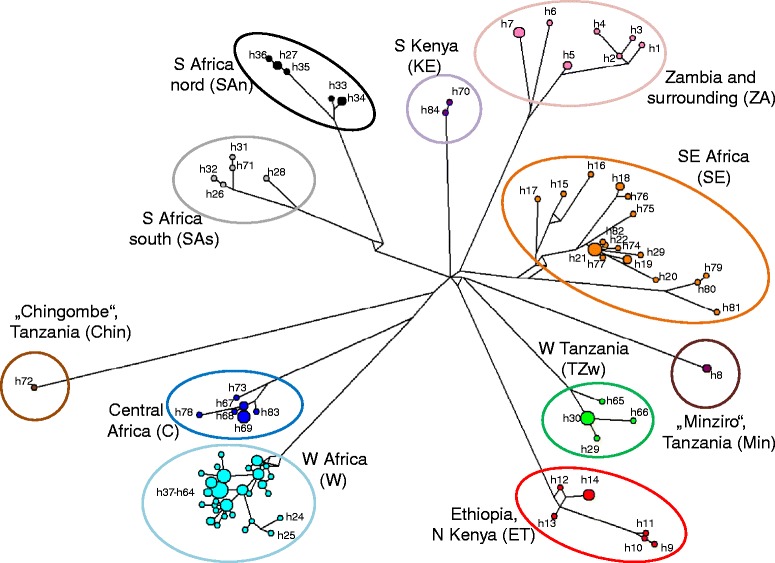
Results: We performed comprehensive genetic analysis of 657 individuals of Nannomys collected at approximately 300 localities across the whole sub-Saharan Africa. Phylogenetic reconstructions based on mitochondrial (CYTB) and nuclear (IRBP) genes identified five species groups and three monotypic ancestral lineages. We provide evidence for important cryptic diversity and we defined and mapped the distribution of 27 molecular operational taxonomic units (MOTUs) that may correspond to presumable species. Biogeographical reconstructions based on data spanning all of Africa modified the previous evolutionary scenarios. First divergences occurred in Eastern African mountains soon after the colonization of the continent and the remnants of these old divergences still occur there, represented by long basal branches of M. (previously Muriculus) imberbis and two undescribed species from Ethiopia and Malawi. The radiation in drier lowland habitats associated with the decrease of body size is much younger, occurred mainly in a single lineage (called the minutoides group, and especially within the species M. minutoides), and was probably linked to aridification and climatic fluctuations in middle Pliocene/Pleistocene.
Conclusions: We discovered very high cryptic diversity in African pygmy mice making the genus Mus one of the richest genera of African mammals. Our taxon sampling allowed reliable phylogenetic and biogeographic reconstructions that (together with detailed distributional data of individual MOTUs) provide a solid basis for further evolutionary, ecological and epidemiological studies of this important group of rodents.
Figures
References
-
- Zachos FE, Apollonio M, Bärmann EV, Festa-Bianchet M, Göhlich U, Habel JC, Haring E, Kruckenhauser L, Lovari S, McDevitt AD, Pertoldi C, Rössner GE, Sánchez-Villagra MR, Scandura M, Suchentrunk F. Species inflation and taxonomic artefacts - A critical comment on recent trends in mammalian classification. Mamm Biol. 2013;78:1–6.
-
- Groves CP. The nature of species: A rejoinder to Zachos et al. Mamm Biol. 2013;78:7–9.
-
- Krishna Krishnamurthy P, Francis RA. A critical review on the utility of DNA barcoding in biodiversity conservation. Biodivers Conserv. 2012;21:1907–1919. doi: 10.1007/s10531-012-0306-2. - DOI
-
- Hoffmann M, Grubb P, Groves CP, Hutterer R, Van der Straeten E, Simmons N, Bergmans W. A synthesis of African and western Indian Ocean Island mammal taxa (Class: Mammalia) described between 1988 and 2008: an update to Allen (1939) and Ansell (1989) Zootaxa. 2009;2205:1–36.
Publication types
MeSH terms
LinkOut - more resources
Full Text Sources
Other Literature Sources
