

Pharmacometabolomics of l-carnitine treatment response phenotypes in patients with septic shock
- PMID: 25496487
- PMCID: PMC4342803
- DOI: 10.1513/AnnalsATS.201409-415OC
Pharmacometabolomics of l-carnitine treatment response phenotypes in patients with septic shock
Abstract
Rationale: Sepsis therapeutics have a poor history of success in clinical trials, due in part to the heterogeneity of enrolled patients. Pharmacometabolomics could differentiate drug response phenotypes and permit a precision medicine approach to sepsis.
Objectives: To use existing serum samples from the phase 1 clinical trial of l-carnitine treatment for severe sepsis to metabolically phenotype l-carnitine responders and nonresponders.
Methods: Serum samples collected before (T0) and after completion of the infusion (T24, T48) from patients randomized to either l-carnitine (12 g) or placebo for the treatment of vasopressor-dependent septic shock were assayed by untargeted (1)H-nuclear magnetic resonance metabolomics. The normalized, quantified metabolite data sets of l-carnitine- and placebo-treated patients at each time point were compared by analysis of variance with post-hoc testing for multiple comparisons. Pathway analysis was performed to statistically rank metabolic networks.
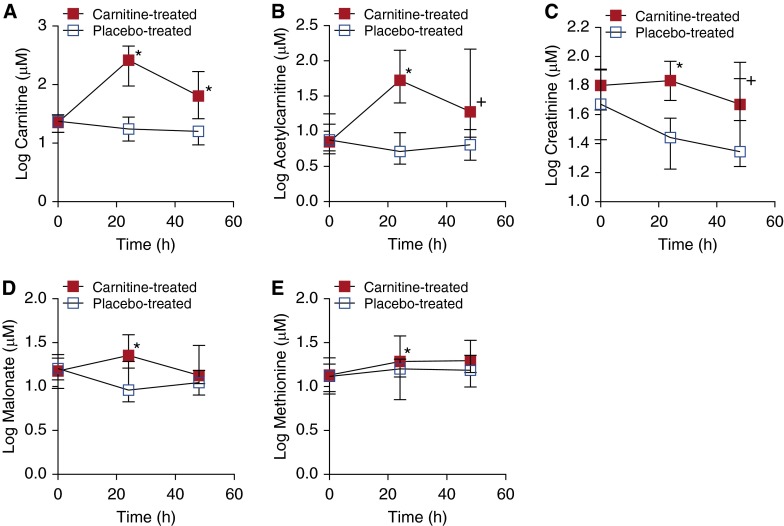
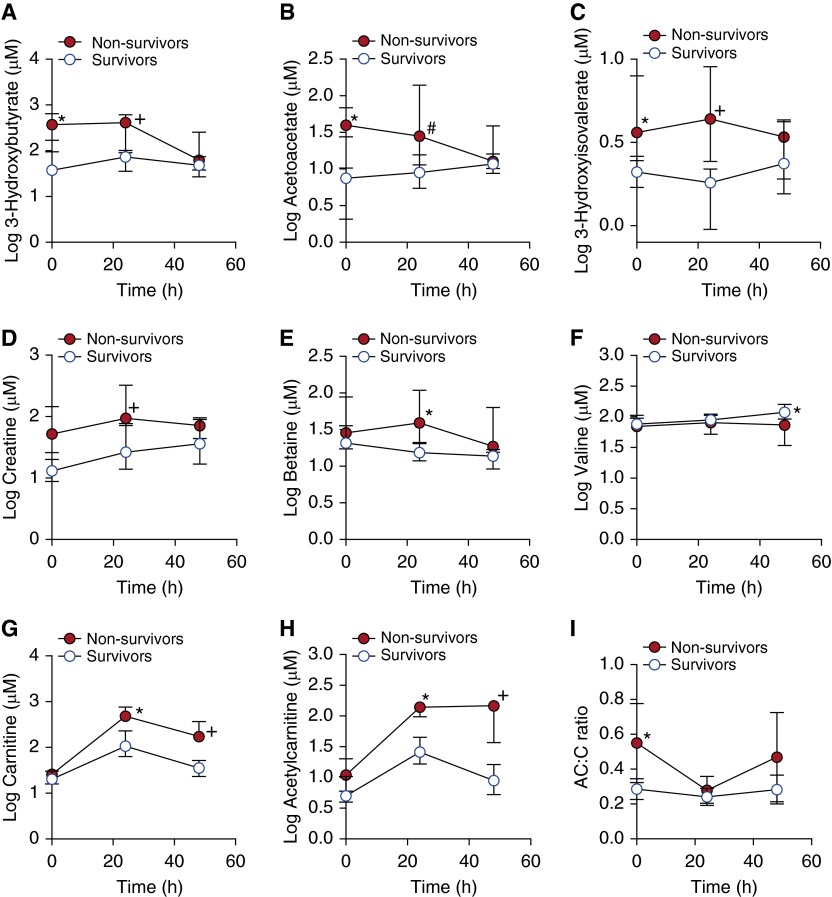
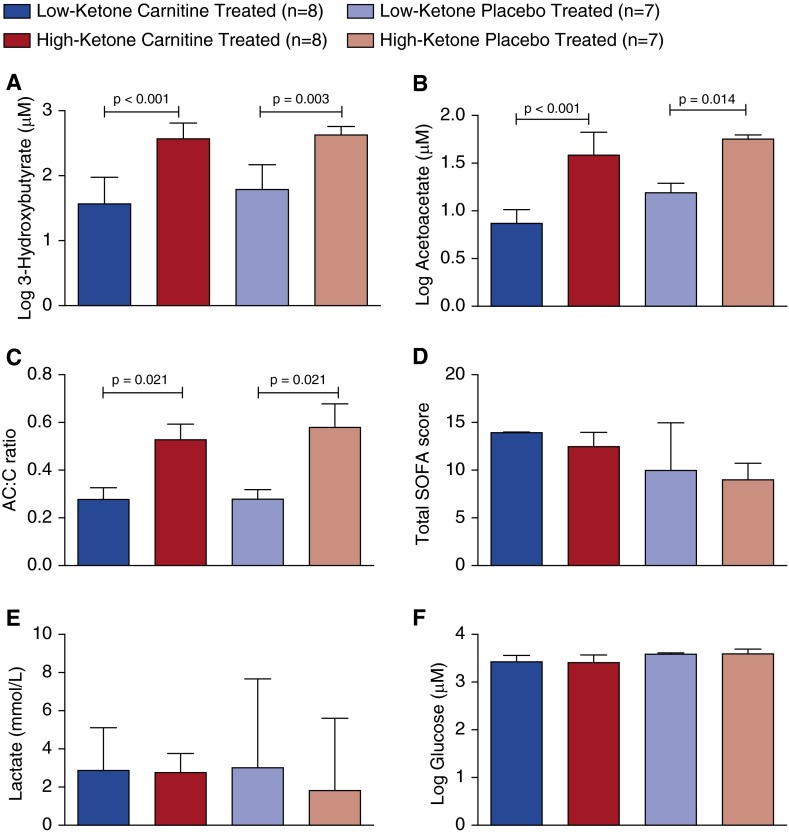
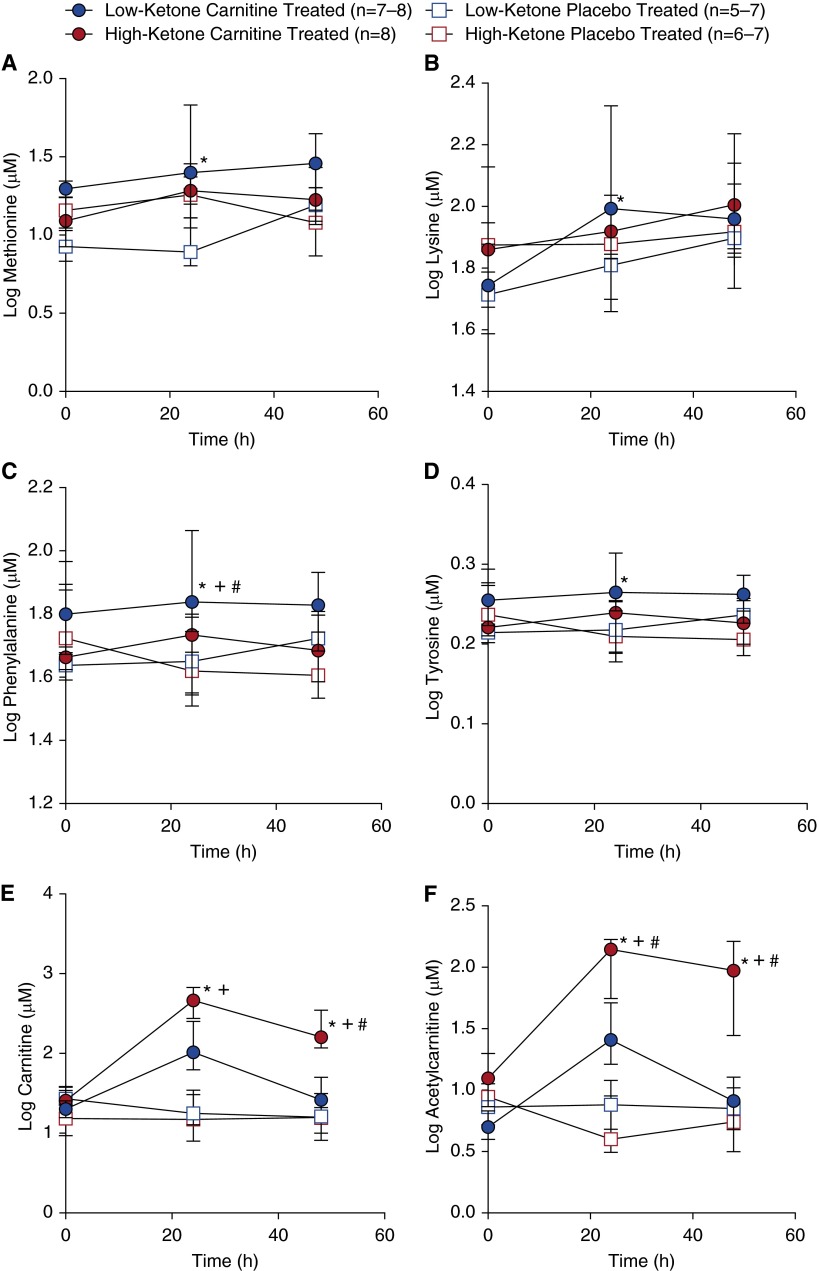
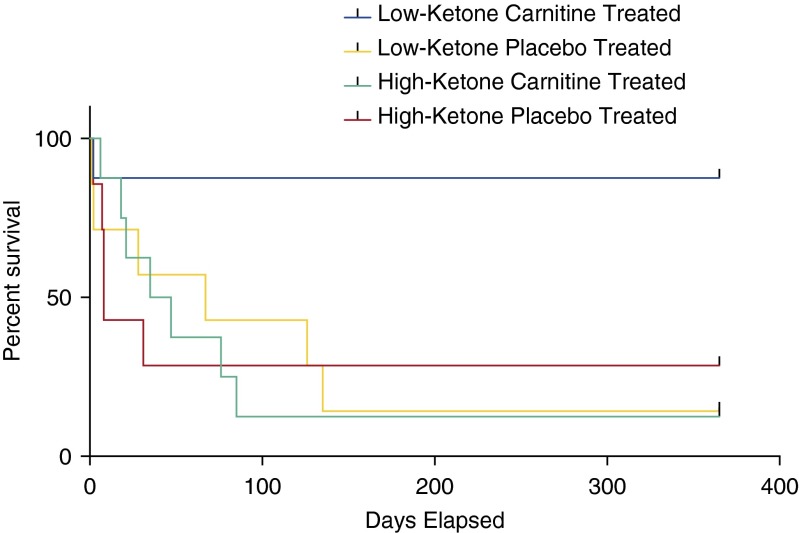
Measurements and main results: Thirty-eight metabolites were identified in all samples. Concentrations of 3-hydroxybutyrate, acetoacetate, and 3-hydroxyisovalerate were different at T0 and over time in l-carnitine-treated survivors versus nonsurvivors. Pathway analysis of pretreatment metabolites revealed that synthesis and degradation of ketone bodies had the greatest impact in differentiating l-carnitine treatment response. Analysis of all patients based on pretreatment 3-hydroxybutyrate concentration yielded distinct phenotypes. Using the T0 median 3-hydroxybutyrate level (153 μM), patients were categorized as either high or low ketone. l-Carnitine-treated low-ketone patients had greater use of carnitine as evidenced by lower post-treatment l-carnitine levels. The l-carnitine responders also had faster resolution of vasopressor requirement and a trend toward a greater improvement in mortality at 1 year (P = 0.038) compared with patients with higher 3-hydroxybutyrate.
Conclusions: The results of this preliminary study, which were not readily apparent from the parent clinical trial, show a unique metabolite profile of l-carnitine responders and introduce pharmacometabolomics as a viable strategy for informing l-carnitine responsiveness. The approach taken in this study represents a concrete example for the application of precision medicine to sepsis therapeutics that warrants further study.
Keywords: 3-hydroxybutyric acid; individualized medicine; ketone bodies; nuclear magnetic resonance; sepsis.
Figures
Similar articles
-
Pharmacometabolomics identifies candidate predictor metabolites of an L-carnitine treatment mortality benefit in septic shock.Clin Transl Sci. 2021 Nov;14(6):2288-2299. doi: 10.1111/cts.13088. Epub 2021 Jul 3. Clin Transl Sci. 2021. PMID: 34216108 Free PMC article.
-
Untargeted Metabolomics Differentiates l-Carnitine Treated Septic Shock 1-Year Survivors and Nonsurvivors.J Proteome Res. 2019 May 3;18(5):2004-2011. doi: 10.1021/acs.jproteome.8b00774. Epub 2019 Apr 1. J Proteome Res. 2019. PMID: 30895797 Free PMC article. Clinical Trial.
-
Septic Shock Nonsurvivors Have Persistently Elevated Acylcarnitines Following Carnitine Supplementation.Shock. 2018 Apr;49(4):412-419. doi: 10.1097/SHK.0000000000000997. Shock. 2018. PMID: 29384504 Free PMC article.
-
The supplementation of L-carnitine in septic shock patients: Systematic review and meta-analysis.Clinics (Sao Paulo). 2022 Oct 31;77:100124. doi: 10.1016/j.clinsp.2022.100124. eCollection 2022. Clinics (Sao Paulo). 2022. PMID: 36327640 Free PMC article.
-
L-carnitine: Searching for New Therapeutic Strategy for Sepsis Management.Curr Med Chem. 2022;29(18):3300-3323. doi: 10.2174/0929867328666211117092345. Curr Med Chem. 2022. PMID: 34789120 Review.
Cited by
-
Sustained Perturbation of Metabolism and Metabolic Subphenotypes Are Associated With Mortality and Protein Markers of the Host Response.Crit Care Explor. 2023 Mar 27;5(4):e0881. doi: 10.1097/CCE.0000000000000881. eCollection 2023 Apr. Crit Care Explor. 2023. PMID: 36998529 Free PMC article.
-
Emerging Biomarkers of Illness Severity: Urinary Metabolites Associated with Sepsis and Necrotizing Methicillin-Resistant Staphylococcus aureus Pneumonia.Pharmacotherapy. 2017 Sep;37(9):1033-1042. doi: 10.1002/phar.1973. Epub 2017 Jul 28. Pharmacotherapy. 2017. PMID: 28632946 Free PMC article.
-
Pharmacokinetics in Pharmacometabolomics: Towards Personalized Medication.Pharmaceuticals (Basel). 2023 Nov 7;16(11):1568. doi: 10.3390/ph16111568. Pharmaceuticals (Basel). 2023. PMID: 38004434 Free PMC article. Review.
-
Metabolic resuscitation in sepsis: a necessary step beyond the hemodynamic?J Thorac Dis. 2016 Jul;8(7):E552-7. doi: 10.21037/jtd.2016.05.37. J Thorac Dis. 2016. PMID: 27501325 Free PMC article.
-
Toxoplasma gondii GRA8 induces ATP5A1-SIRT3-mediated mitochondrial metabolic resuscitation: a potential therapy for sepsis.Exp Mol Med. 2018 Mar 30;50(3):e464. doi: 10.1038/emm.2017.308. Exp Mol Med. 2018. PMID: 29869623 Free PMC article.
References
-
- Angus DC, Linde-Zwirble WT, Lidicker J, Clermont G, Carcillo J, Pinsky MR. Epidemiology of severe sepsis in the United States: analysis of incidence, outcome, and associated costs of care. Crit Care Med. 2001;29:1303–1310. - PubMed
-
- Wunderink RG, Walley KR. Update in sepsis and pulmonary infections 2013. Am J Respir Crit Care Med. 2014;190:25–31. - PubMed
-
- Liu V, Escobar GJ, Greene JD, Soule J, Whippy A, Angus DC, Iwashyna TJ. Hospital deaths in patients with sepsis from 2 independent cohorts. JAMA. 2014;312:90–92. - PubMed
-
- Dellinger RP, Vincent JL, Marshall J, Reinhart K. Important issues in the design and reporting of clinical trials in severe sepsis and acute lung injury. J Crit Care. 2008;23:493–499. - PubMed
Publication types
MeSH terms
Substances
Grants and funding
LinkOut - more resources
Full Text Sources
