. 2014 Dec 11;8(1):22.
doi: 10.1186/s40246-014-0022-y.

Molecular signatures that correlate with induction of lens regeneration in newts: lessons from proteomic analysis

Affiliations

Molecular signatures that correlate with induction of lens regeneration in newts: lessons from proteomic analysis

Konstantinos Sousounis et al. Hum Genomics. .

Abstract

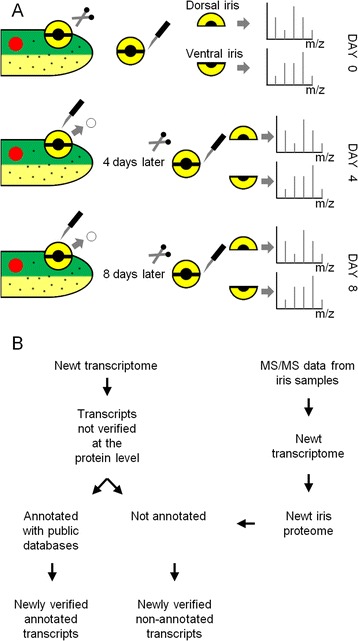
Background: Amphibians have the remarkable ability to regenerate missing body parts. After complete removal of the eye lens, the dorsal but not the ventral iris will transdifferentiate to regenerate an exact replica of the lost lens. We used reverse-phase nano-liquid chromatography followed by mass spectrometry to detect protein concentrations in dorsal and ventral iris 0, 4, and 8 days post-lentectomy. We performed gene expression comparisons between regeneration and intact timepoints as well as between dorsal and ventral iris.

Results: Our analysis revealed gene expression patterns associated with the ability of the dorsal iris for transdifferentiation and lens regeneration. Proteins regulating gene expression and various metabolic processes were enriched in regeneration timepoints. Proteins involved in extracellular matrix, gene expression, and DNA-associated functions like DNA repair formed a regeneration-related protein network and were all up-regulated in the dorsal iris. In addition, we investigated protein concentrations in cultured dorsal (transdifferentiation-competent) and ventral (transdifferentiation-incompetent) iris pigmented epithelial (IPE) cells. Our comparative analysis revealed that the ability of dorsal IPE cells to keep memory of their tissue of origin and transdifferentiation is associated with the expression of proteins that specify the dorso-ventral axis of the eye as well as with proteins found highly expressed in regeneration timepoints, especially 8 days post-lentectomy.

Conclusions: The study deepens our understanding in the mechanism of regeneration by providing protein networks and pathways that participate in the process.


Figures

Figure 1
Figure 1
Overview of the experimental procedure. (A) Sample collection at 0, 4, and 8 days post-lentectomy. Lenses were surgically removed from the newt’s eyes and iris rings were split into dorsal-ventral halves before subject to LC-MS/MS. (B) Comparison between newly obtained data and previously described newt transcriptome results. Data were used to validate annotated transcripts at the protein level and identify non-annotated proteins that are probably unique to newts or amphibians.
Figure 2
Figure 2
Comparisons between regenerating and control samples. (A) Workflow for selecting control and regeneration groups for Fisher’s exact test. (B) Selected enriched gene ontology (GO) terms (FDR < 0.05) in regeneration or control groups for dorsal and ventral samples. Bars indicate the number of proteins in each group. (C) Network analysis of proteins expressed at higher levels in regenerating and dorsal samples. (D) Network analysis of proteins expressed at higher levels in regenerating and ventral samples. (C, D) Connections between nodes indicate protein-protein interaction. Only proteins that showed at least one interaction with another protein of the same group were displayed.
Figure 3
Figure 3
Validation of protein expression data by qPCR analysis. (A) Genes expressed at higher levels in dorsal iris. (B) Genes expressed at higher levels during regeneration. (C) Genes expressed at higher levels in the dorsal iris and during regeneration. (D) Gene expressed at higher levels in the ventral iris and during regeneration. (E) Gene expressed at higher levels in the ventral iris. (F) Gene expressed at higher levels in the intact iris. Student’s t-test for independent samples was used for statistical significance. Homoscedasticity was assumed when Levene’s test p value was greater than 0.05. Asterisk (*) indicates statistical significance (Student’s t-test; p < 0.05). Each bar represents the average of triplicate values. Error bars represent standard deviation. Lines on the top of the graph compare samples during regeneration and control. Lines on the top of bars corresponding to a single day compare dorsal and ventral iris. For simplicity, only the statistics relevant for each group are presented on the graphs.
Figure 4
Figure 4
LC-MS/MS in cultured IPE cells and comparisons with in vivo samples. (A) Overview of procedure for using LC-MS/MS in cultured iris cells. (B) Dorsal and ventral group selection for comparison with Fisher’s exact test. (C) qPCR validation of in vitro proteomics data and comparisons. Student’s t-test for independent samples was used for statistical significance. Equal variances were assumed when Levene’s test p value was greater than 0.05. Asterisk (*) indicates statistical significance (Student t-test; p < 0.05). Each bar represents the average of triplicate values. Error bars represent standard deviation. (D) Pearson correlation between expression of dorsal in vivo proteins at indicated days and expression of dorsal in vitro cultured cell proteins. (E) Pearson correlation between expression of proteins in vivo in the ventral iris at indicated days and expression of proteins in cultured ventral IPE cells.
Figure 5
Figure 5
Gene expression comparison of different regenerating tissues from amphibians reveals a canonical regeneration program. Proteins found to be up-regulated during regeneration in the dorsal iris in the present study were compared to gene expression datasets related to amphibian regeneration published previously. Datasets included gene expression profiles from DNA microarray analysis of newt brain, spinal cord, hindlimbs, dorsal iris, heart, forelimbs and tail regeneration, microarray and RNA-seq analysis from axolotl limb regeneration, and LC-MS/MS from newt heart and axolotl limb regeneration. Newts and axolotls are presented with black color. Respective regenerating organs are colored white on the animals. The central grey column depicts the collection of all the gene expression data from the different regenerating tissues located at the periphery. The node and the three arrows represent the result of the data comparison. Boxes highlight the three major events of the common canonical regeneration program that was identified.

References

    1. Baddour JA, Sousounis K, Tsonis PA. Organ repair and regeneration: an overview. Birth Defects Res C Embryo Today. 2012;96:1–29. doi: 10.1002/bdrc.21006. - DOI - PubMed
    1. Barbosa-Sabanero K, Hoffmann A, Judge C, Lightcap N, Tsonis PA, Del Rio-Tsonis K. Lens and retina regeneration: new perspectives from model organisms. Biochem J. 2012;447:321–334. doi: 10.1042/BJ20120813. - DOI - PubMed
    1. Eguchi G, Shingai R. Cellular analysis on localization of lens forming potency in the newt iris epithelium. Dev Growth Differ. 1971;13:337–349. doi: 10.1111/j.1440-169X.1971.00337.x. - DOI - PubMed
    1. Wolff G. Entwickelungsphysiologische studien. I. Die regeneration der urodelenlinse. Arch EntwMech Org. 1895;1:380–390.
    1. Hoffmann A, Nakamura K, Tsonis PA. Intrinsic lens forming potential of mouse lens epithelial versus newt iris pigment epithelial cells in three-dimensional culture. Tissue Eng Part C Methods. 2014;20:91–103. doi: 10.1089/ten.tec.2013.0078. - DOI - PMC - PubMed

Publication types

Substances

LinkOut - more resources