. 2014;15(12):557.
doi: 10.1186/s13059-014-0557-1.

Genomic signatures of near-extinction and rebirth of the crested ibis and other endangered bird species

Genomic signatures of near-extinction and rebirth of the crested ibis and other endangered bird species

Shengbin Li et al. Genome Biol. 2014.

Abstract

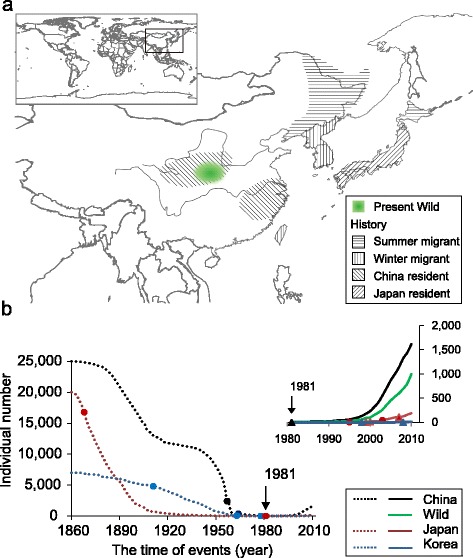
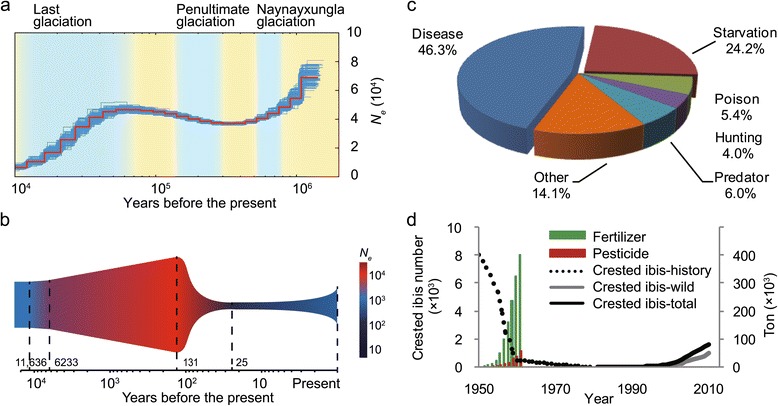
Background: Nearly one-quarter of all avian species is either threatened or nearly threatened. Of these, 73 species are currently being rescued from going extinct in wildlife sanctuaries. One of the previously most critically-endangered is the crested ibis, Nipponia nippon. Once widespread across North-East Asia, by 1981 only seven individuals from two breeding pairs remained in the wild. The recovering crested ibis populations thus provide an excellent example for conservation genomics since every individual bird has been recruited for genomic and demographic studies.

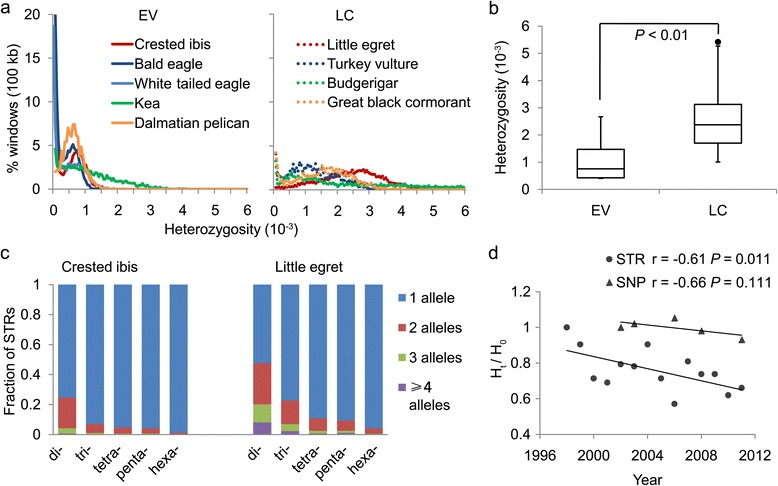
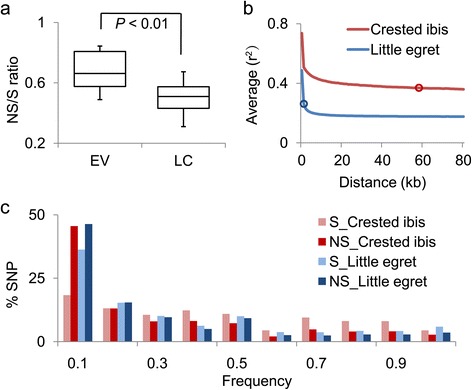
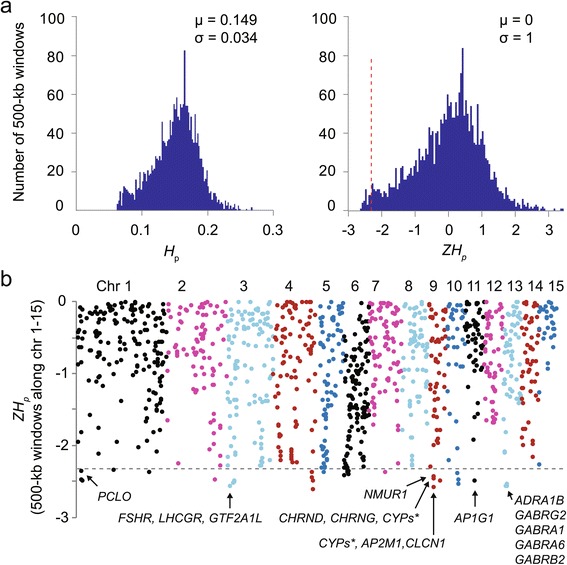
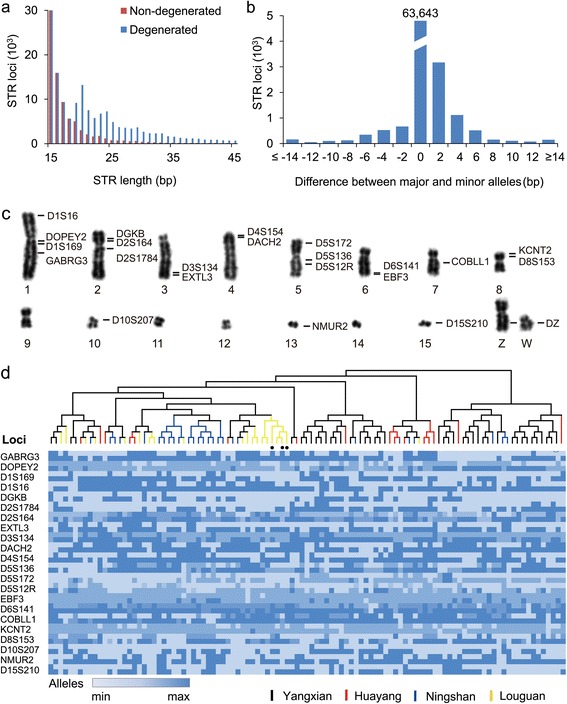
Results: Using high-quality genome sequences of multiple crested ibis individuals, its thriving co-habitant, the little egret, Egretta garzetta, and the recently sequenced genomes of 41 other avian species that are under various degrees of survival threats, including the bald eagle, we carry out comparative analyses for genomic signatures of near extinction events in association with environmental and behavioral attributes of species. We confirm that both loss of genetic diversity and enrichment of deleterious mutations of protein-coding genes contribute to the major genetic defects of the endangered species. We further identify that genetic inbreeding and loss-of-function genes in the crested ibis may all constitute genetic susceptibility to other factors including long-term climate change, over-hunting, and agrochemical overuse. We also establish a genome-wide DNA identification platform for molecular breeding and conservation practices, to facilitate sustainable recovery of endangered species.

Conclusions: These findings demonstrate common genomic signatures of population decline across avian species and pave a way for further effort in saving endangered species and enhancing conservation genomic efforts.


Figures

Figure 1
Figure 1
Demographic history of the crested ibis and its population dynamics. (a) The crested ibis populations (summer migrants, winter migrants, China residents, and Japan residents) were once widely distributed in East Asia. The recorded habitats are marked with parallel lines. The two breeding pairs were discovered in 1981 in the area in the South Qingling Mountains (green shade). (b) Population history based on historic records and the scientific literature [14]. The curves (dotted lines) indicate the time at which population bottlenecks occurred and bottleneck milestones are shown as solid diamonds (Additional file 1: Table S1). The inset enlarges the curves from 1980 to 2010. The colored solid triangles indicate recorded historic events (Additional file 1: Table S2). The vertical downward arrows indicate the discovery of the two survived breeding pairs in 1981.
Figure 2
Figure 2
Genomic diversity of selected EV and LC avian species. (a) Percentage distribution of genome sequences in a 100-kb window as a function of heterozygosity (SNPs/1,000 bp) of nine representative avian species from four orders each: EVs (n = 5) and LC (n = 4) species. Species from the same order are denoted in matching colors (solid, EV; dashed, LC). Note the differences among peaks between 0 and 1 on the heterozygosity axis. (b) Box plot of the average heterozygosity of LC (n = 32) and EV (n = 8) species (t test, P <0.01). (c) STR-based genomic diversity. Genome-wide STR alleles are based on lobSTR software [26] from resequencing reads of the crested ibis (n = 6; randomly selected from eight samples) and the little egret (n = 6). P values from chi-square test for di-, tri-, tetra-, penta-, and hexa-nucleotides are all <0.001. (d) Gradual loss of genetic diversity (Ht/H0). H0 and Ht represent initial heterozygosity and that after generation t. Solid circles (STR) or triangles (SNP) represent average heterozygosity of individuals from the same generation. P values are calculated based on linear regression.
Figure 3
Figure 3
Accumulation of deleterious mutations. (a) Box plot of NS/S (non-synonymous/synonymous) ratio (based on heterozygous SNPs) in the LC (n = 32) and EV (n = 8) species (t test, P <0.01). (b) LD (Linkage disequilibrium) decay of the crested ibis and the little egret genomes. Open circles denote distances where the r 2 correlation coefficient reduces to half of its maximum (approximately 60 kb for the crested ibis and approximately 1 kb for the little egret). (c) SNP fractions as derived allele frequencies in populations of the crested ibis (n = 9) and the little egret (n = 6). NS, non-synonymous; S, synonymous.
Figure 4
Figure 4
Heterozygosity loss and selected genes in the crested ibis genome. (a) Distributions of heterozygosity, H p (left), and corresponding Z transformations, ZH p (right), for all 500-kb windows (n = 2,513). μ, mean; σ, standard deviation; red vertical dashed line, threshold at ZH p = -2.326 (q <0.01 in normal distribution). (b) The negative end (error head in a) of the ZH p distribution presented along chromosomes 1-15 (color-coded from left to right). The horizontal dashed line indicates the threshold (see a). Genes residing within a window with ZH p < -2.326 are indicated (Additional file 1: Table S14).
Figure 5
Figure 5
Demographic history reconstruction of the Chinese crested ibis population based on the resequenced data from eight resequenced individuals. (a) Estimation based on the PSMC (pairwise sequentially Markov coalescent) model. The red line depicts the estimated effective population size (N e), and the thin blue curves represent PSMC bootstrapping estimates. The sky blue and yellow background colors indicate glacial and interglacial periods, respectively. (b) Estimation based on the ∂a∂i calculator. The timing of demographic events is indicated (vertical dashed lines; x-axis indicates time in logarithmic scale). (c) Percent of deaths from various causes of the wild crested ibis from 1981 to 2003 [14]. (d) Agrochemical usage and population size. The population size was negatively correlated with the usage of pesticides and fertilizers during 1950s to early 1960s in China (fertilizer, r = -0.92, P <0.001; pesticide, r = -0.95, P <0.001). Agrochemical use has been forbidden in the sanctuary designated for the recued ibis population since 1981. P values were calculated based on linear regression (data on pesticide and fertilizer usage are summarized in Additional file 1: Table S17).
Figure 6
Figure 6
Genome-wide STR profiling of four ibis sub-populations. (a) STR (units of 2 bp, 3 bp, 4 bp, 5 bp, and 6 bp) distribution as a fraction of the total repeat length. Non-degenerate STRs do not contain insertions, deletions or mismatches. (b) Near random distribution of allele size differences between the major and minor alleles (n = 9). Size difference is calculated by subtracting the minor allele length from the major allele length. (c) Genetic markers of the ibis chromosomes typed in this study. Twenty-two representative STR and a single sex chromosome (W)-derived markers are shown here. (d) Individual identification based on the 22 STR loci. The colored horizontal scale bar indicates the number of repeat units (from minimum to maximum). The alleles (105 individuals) are used to construct neighbor-joining tree within sub-populations (Yangxian, n = 42; Ningshan, n = 27; Huayang, n = 16; and Louguan, n = 20). Solid circles denote the three individuals from a single family.

Similar articles

Cited by

References

    1. Attenborough D. Help us build a brighter future: the need to save the world’s most threatened birds. Cambridge: BirdLife International; 2008.
    1. Collar NJ, Andreev AV, Chan S. Threatened Birds of Asia: The BirdLife International Red Data Book. 5. Cambridge: BirdLife International; 2001.
    1. Brooke Mde L, Butchart SH, Garnett ST, Crowley GM, Mantilla-Beniers NB, Stattersfield AJ. Rates of movement of threatened bird species between IUCN red list categories and toward extinction. Conserv Biol. 2008;22:417–427. doi: 10.1111/j.1523-1739.2008.00905.x. - DOI - PubMed
    1. Frankham R. Genetics and extinction. Biol Conserv. 2005;126:131–140. doi: 10.1016/j.biocon.2005.05.002. - DOI
    1. Saccheri I, Kuussaari M, Kankare M, Vikman P, Fortelius W, Hanski I. Inbreeding and extinction in a butterfly metapopulation. Nature. 1998;392:491–494. doi: 10.1038/33136. - DOI

Publication types

LinkOut - more resources