

Changes in leukocyte subsets of pregnant gilts experimentally infected with porcine reproductive and respiratory syndrome virus and relationships with viral load and fetal outcome
- PMID: 25497114
- PMCID: PMC4265508
- DOI: 10.1186/s13567-014-0128-1
Changes in leukocyte subsets of pregnant gilts experimentally infected with porcine reproductive and respiratory syndrome virus and relationships with viral load and fetal outcome
Abstract
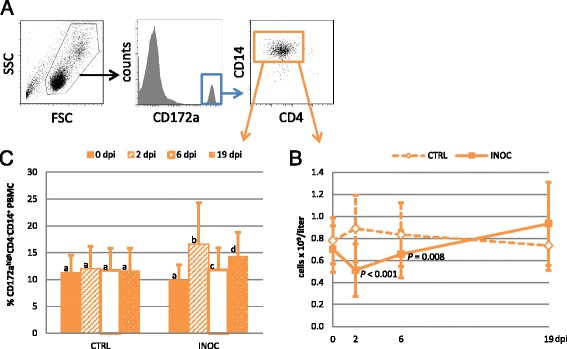
In spite of more than two decades of extensive research, the understanding of porcine reproductive and respiratory syndrome virus (PRRSv) immunity is still incomplete. A PRRSv infection of the late term pregnant female can result in abortions, early farrowings, fetal death, and the birth of weak, congenitally infected piglets. The objectives of the present study were to investigate changes in peripheral blood mononuclear cell populations in third trimester pregnant females infected with type 2 PRRSv (NVSL 97-7895) and to analyze potential relationships with viral load and fetal mortality rate. PRRSv infection caused a massive, acute drop in total leukocyte counts affecting all PBMC populations by two days post infection. Except for B cells, cell counts started to rebound by day six post infection. Our data also show a greater decrease of naïve B cells, T-helper cells and cytolytic T cells than their respective effector or memory counterparts. Absolute numbers of T cells and γδ T cells were negatively associated with PRRSv RNA concentration in gilt serum over time. Additionally, absolute numbers of T helper cells may be predictive of fetal mortality rate. The preceding three leukocyte populations may therefore be predictive of PRRSv-related pathological outcomes in pregnant gilts. Although many questions regarding the immune responses remain unanswered, these findings provide insight and clues that may help reduce the impact of PRRSv in pregnant gilts.
Figures


Similar articles
-
Changes in peripheral blood leukocyte subpopulations in piglets co-infected experimentally with porcine reproductive and respiratory syndrome virus and porcine circovirus type 2.Vet Microbiol. 2008 Jun 22;129(3-4):367-77. doi: 10.1016/j.vetmic.2007.11.020. Epub 2007 Nov 29. Vet Microbiol. 2008. PMID: 18164875
-
Cytokine profiles in pregnant gilts experimentally infected with porcine reproductive and respiratory syndrome virus and relationships with viral load and fetal outcome.Vet Res. 2014 Dec 6;45:113. doi: 10.1186/s13567-014-0113-8. Vet Res. 2014. PMID: 25479904 Free PMC article.
-
Maternal and fetal predictors of fetal viral load and death in third trimester, type 2 porcine reproductive and respiratory syndrome virus infected pregnant gilts.Vet Res. 2015 Sep 25;46:107. doi: 10.1186/s13567-015-0251-7. Vet Res. 2015. PMID: 26407558 Free PMC article.
-
Porcine reproductive and respiratory syndrome.Vet Pathol. 1998 Jan;35(1):1-20. doi: 10.1177/030098589803500101. Vet Pathol. 1998. PMID: 9545131 Review.
-
Novel insights into host responses and reproductive pathophysiology of porcine reproductive and respiratory syndrome caused by PRRSV-2.Vet Microbiol. 2017 Sep;209:114-123. doi: 10.1016/j.vetmic.2017.02.019. Epub 2017 Mar 2. Vet Microbiol. 2017. PMID: 28292546 Review.
Cited by
-
Systemic CD4 cytotoxic T cells improve protection against PRRSV-1 transplacental infection.Front Immunol. 2023 Jan 17;13:1020227. doi: 10.3389/fimmu.2022.1020227. eCollection 2022. Front Immunol. 2023. PMID: 36798517 Free PMC article.
-
Differences in Whole Blood Gene Expression Associated with Infection Time-Course and Extent of Fetal Mortality in a Reproductive Model of Type 2 Porcine Reproductive and Respiratory Syndrome Virus (PRRSV) Infection.PLoS One. 2016 Apr 19;11(4):e0153615. doi: 10.1371/journal.pone.0153615. eCollection 2016. PLoS One. 2016. PMID: 27093427 Free PMC article.
-
Fetal Metabolomic Alterations Following Porcine Reproductive and Respiratory Syndrome Virus Infection.Front Mol Biosci. 2020 Dec 11;7:559688. doi: 10.3389/fmolb.2020.559688. eCollection 2020. Front Mol Biosci. 2020. PMID: 33363202 Free PMC article.
-
Integrated time-series transcriptomic and metabolomic analyses reveal different inflammatory and adaptive immune responses contributing to host resistance to PRRSV.Front Immunol. 2022 Oct 20;13:960709. doi: 10.3389/fimmu.2022.960709. eCollection 2022. Front Immunol. 2022. PMID: 36341362 Free PMC article.
-
The T-Cell Response to Type 2 Porcine Reproductive and Respiratory Syndrome Virus (PRRSV).Viruses. 2019 Aug 29;11(9):796. doi: 10.3390/v11090796. Viruses. 2019. PMID: 31470568 Free PMC article.
References
-
- Nauwynck HJ, Van Gorp H, Vanhee M, Karniychuk U, Geldhof M, Cao A, Verbeeck M, Van Breedam W. Micro-dissecting the pathogenesis and immune response of PRRSV Infection paves the way for more efficient PRRSV vaccines. Transbound Emerg Dis. 2012;59:50–54. doi: 10.1111/j.1865-1682.2011.01292.x. - DOI - PubMed
Publication types
MeSH terms
LinkOut - more resources
Full Text Sources
Other Literature Sources
