. 2014 Dec 18;159(7):1698-710.
doi: 10.1016/j.cell.2014.11.015. Epub 2014 Dec 11.

High-resolution sequencing and modeling identifies distinct dynamic RNA regulatory strategies

Affiliations

High-resolution sequencing and modeling identifies distinct dynamic RNA regulatory strategies

Michal Rabani et al. Cell. .

Abstract

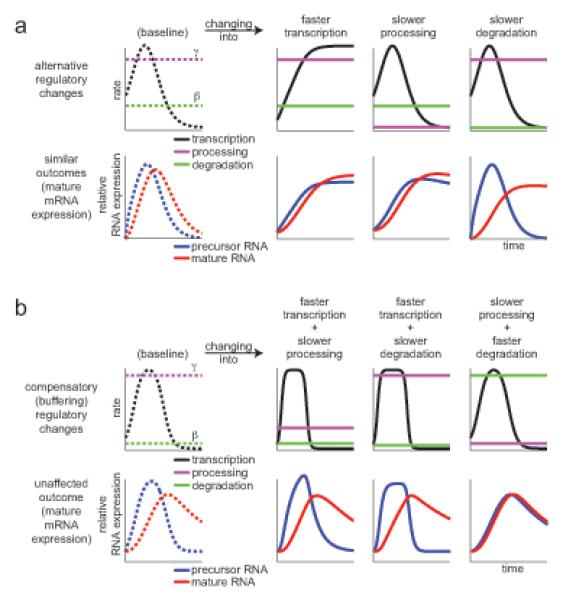
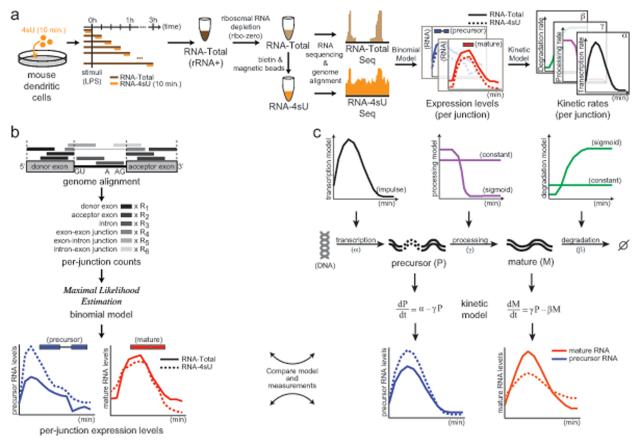
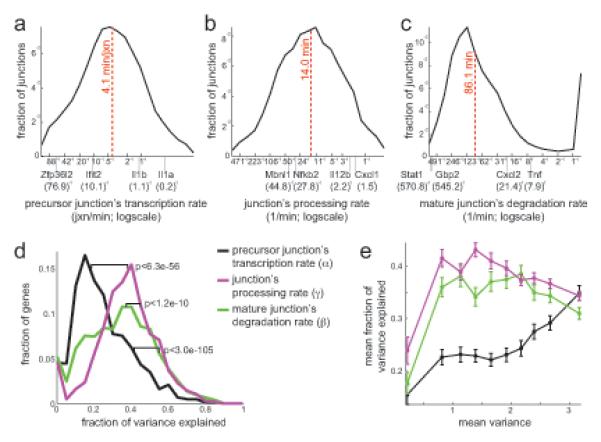
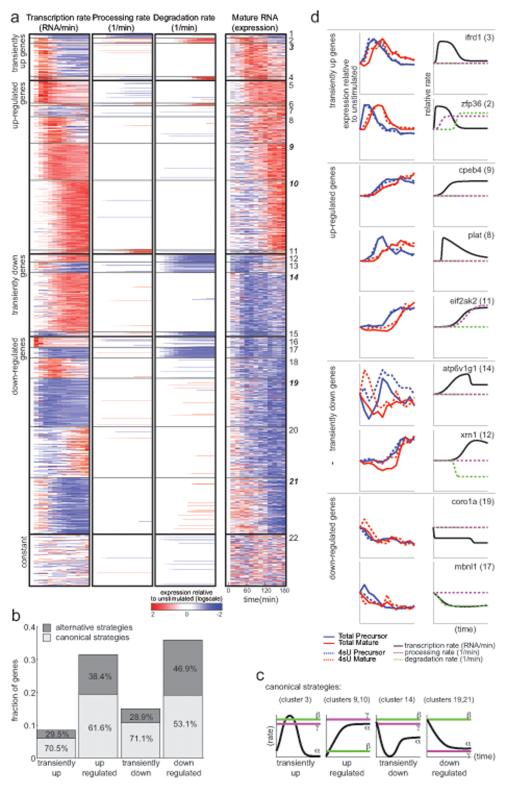
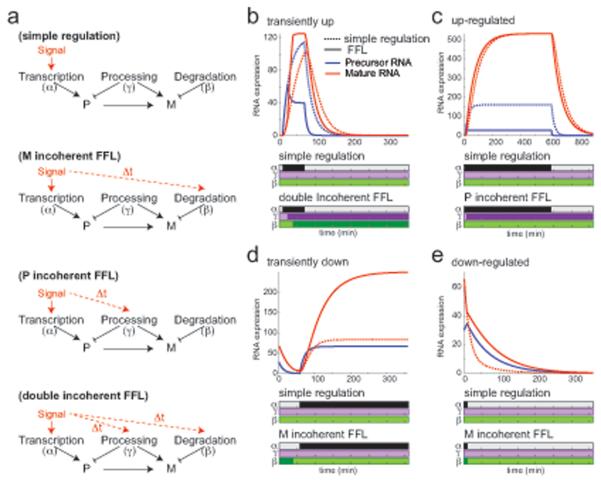
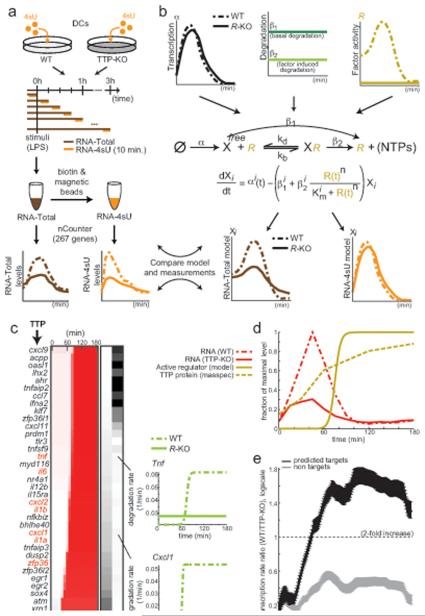
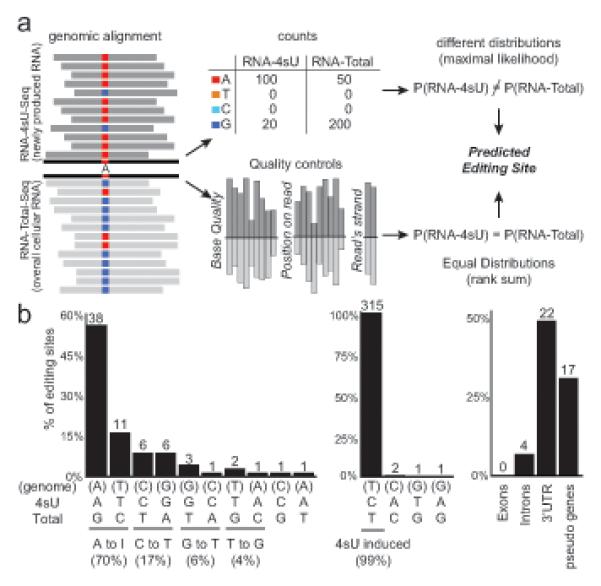
Cells control dynamic transitions in transcript levels by regulating transcription, processing, and/or degradation through an integrated regulatory strategy. Here, we combine RNA metabolic labeling, rRNA-depleted RNA-seq, and DRiLL, a novel computational framework, to quantify the level; editing sites; and transcription, processing, and degradation rates of each transcript at a splice junction resolution during the LPS response of mouse dendritic cells. Four key regulatory strategies, dominated by RNA transcription changes, generate most temporal gene expression patterns. Noncanonical strategies that also employ dynamic posttranscriptional regulation control only a minority of genes, but provide unique signal processing features. We validate Tristetraprolin (TTP) as a major regulator of RNA degradation in one noncanonical strategy. Applying DRiLL to the regulation of noncoding RNAs and to zebrafish embryogenesis demonstrates its broad utility. Our study provides a new quantitative approach to discover transcriptional and posttranscriptional events that control dynamic changes in transcript levels using RNA sequencing data.


Figures

Figure 1
Figure 1. Dynamic transitions in mature RNA levels can arise from changes in transcription, processing, or degradation
(a) Different regulatory changes can lead to a similar mRNA temporal expression profile. Top: transcription (black, RNA/min), processing (magenta, 1/min) and degradation rates (green, 1/min). Bottom: precursor (blue) and mature (red) RNA expression levels. Left (dashed lines): baseline reference expression (dashed lines). Three columns (solid lines): changes in each of three possible rates, lead to the same new ,mRNA profile (solid red, bottom). (b) Compensatory changes in two of three rates (rows as in (a)) leave mRNA levels (red, bottom) unchanged. Left column (dashed lines): reference expression; three columns (solid lines): changes from reference in two of three possible rates; mRNA levels (red, bottom) do not change vs. baseline.
Figure 2
Figure 2. DRiLL infers the abundance and kinetics of precursor and mature transcripts at single junction resolution
(a) A high-resolution map of the temporal LPS response. Orange: 4sU pulse and 4sU-RNA. Dark brown: sampled RNA; light brown: rRNA-depleted Total RNA; blue, red: inferred precursor and mature levels, respectively; black, purple, green: estimated rates of RNA transcription, processing, and degradation, respectively. (b) Binomial model. Counts of sequencing reads that are located on exons, introns or the junctions between them (grayscale, dark to light) are used to infer, for each splicing junction, the abundance of transcripts with an unspliced precursor (P, blue) and mature junction (M, red), in either RNA-Total (solid) or RNA-4sU (dashed) samples. (c) Kinetic model. Transcription makes a precursor (P, blue) of the junction (at some temporally changing rate α, black), and that product (P) is processed (at rate γ, purple, constant or temporally changing) into a mature transcript (M, red). Degradation (at rate β, green, constant or temporally changing) eliminates the mature (M) junction. Comparing the kinetic model estimates of P and M to their levels as inferred by the binomial model (red and blue, respectively), the model fits the kinetic parameters of a junction. See also Figures S1, S7 and Table S1.
Figure 3
Figure 3. Genome wide kinetic rates at per-junction resolution
(a-c) Distribution of junction kinetic rates (x-axis, logscale) predicted for 10,351 substantially expressed junctions (fraction of junctions, y-axis). Example transcripts and half-life values in minutes are marked. Dashed line: median. (a) Precursor junction transcription rates (jxn/min, x-axis, logscale). (b) Junction processing rate (1/min, x-axis, logscale). (c) Mature junction degradation rate (1/min, x-axis, logscale). (d) Distribution of the fraction of the variance between a gene’s junctions that is explained by differences in transcription (black), processing (purple) or degradation (green) rates, in 1,693 genes with ≥2 junctions (fraction, y-axis). P-values: KS-test. (e) The mean fraction (y-axis) of the variance between a gene’s junctions that is explained by differences in its transcription (black), processing (purple) or degradation (green) rates, estimated in each of 10 quantiles of genes (x-axis) partitioned by mean variance between junctions. Error bars: standard error. See also Figures S2, S3.
Figure 4
Figure 4. Regulatory strategies that generate dynamic mRNA profiles
(a) Dynamics of transcription (left), processing (middle) and degradation (right) kinetic rates predicted by the kinetic model and ,mRNA levels inferred by the binomial model, relative to unstimulated (t0) control (white: t0, red: 2 fold above t0, blue: 2 fold below t0; logscale), for each of 7,872 expressed genes (rows) during 3 hours of the response (columns). Genes are divided into 22 groups (solid black lines), in four modes of mRNA regulation (dashed black lines, from top to bottom): transiently up, up regulated, transiently down and down regulated. (b) Fraction of genes (y-axis) using canonical (light gray) or non-canonical (dark gray) strategies in each of the four modes (x-axis). Fraction of genes within each mode is marked. (c) Canonical regulatory strategies. Typical transcription (α, black), processing (γ, purple) and degradation (β, green) rates of canonical strategies in each of the four modes. (d) Example genes (name on top, group in brackets) from canonical and non-canonical strategies. Right plots: t0-relative expression (y-axis) of a gene’s precursor (blue) and mature (red) RNA inferred by the binomial model for RNA-total (solid) and RNA-4sU (dashed). Left plots: kinetic parameters of a gene (relative to rate at t0, y-axis): transcription (black), processing (dashed purple) and degradation (dashed green). See also Figures S4, S5, S6 and Tables S2, S5.
Figure 5
Figure 5. Simulations suggest functional role of alternative regulatory strategies
(a) Canonical and alternative strategies. Top to bottom: simple regulatory strategy where only transcription rates change dynamically (red arrow); incoherent feed-forward loop (FFL) regulation of mRNA expression with additional temporal changes in degradation rates (dashed red arrow, temporally delayed); incoherent FFL regulation of precursor expression with additional temporal changes in processing (dashed red arrow, temporally delayed); a double incoherent FFL with temporal changes in transcription, processing and degradation rates. (b-e) Comparing simple (dashed lines) and alternative (solid lines) strategies: a double incoherent FFL (b), a precursor incoherent FFL (c), and a mature RNA incoherent FFL (d). Top: temporal (x-axis, minutes) precursor (blue) and mature (red) RNA expression (y-axis) by either strategy. Bottom: temporal (x-axis) transcription (black), processing (purple) and degradation (green) rate changes relative to unstimulated cells by a simple (top) or alternative (bottom) strategy. See also Figure S5.
Figure 6
Figure 6. TTP as a regulator of dynamic RNA degradation rates
(a) Method overview. 4sU (orange) and total (brown) RNA are sampled from DCs from wildtype (WT, light gray) and TTP-KO (dark gray) mice, following LPS stimulation and short (10 minute) metabolic labeling pulses, and quantified for a 267 transcript signature by the nCounter. (b) Kinetic model of factor induced RNA degradation. Gene X is transcribed at rate α (black) that differs in WT (dotted) or R-KO (solid) cells, and is degraded either at basal rate β1 (dark green) from the unbound state (XFree), or through factor-mediated (R, yellow, commonly an RBP) degradation (rate β2, light green) from the bound state (XR), in either WT (dotted) or R-KO (solid, inactive) cells. The regulator’s association and dissociation constants (kb, kd) determine the binding efficiency (Km). We optimize the parameters per gene by comparing the model predictions (bottom, RNA-Total: brown; RNA-4sU: orange) to the nCounter measurements. (c) 36 predicted TTP targets. Rows: Genes (left; red: known TTP targets). Left heatmap: estimated WT degradation profiles (relative rate; red: high; blue: low) at 13 time points (columns). Right heatmap: predicted 1/Km (binding affinity, left column) and β2 (factor induced degradation, right column). (d) Predicted levels of the active regulator protein (solid yellow), TTP protein levels measured in WT cells (dashed yellow; average of two replicates), and TTP RNA levels in WT (dashed red) and TTP-KO (solid red) cells. (f) Mean ratio of predicted transcription rate (WT vs. TTP-KO rate; y-axis; logscale) over time (x-axis) for 36 predicted TTP targets (black) and non-targets (gray). Error bars: standard error. See also Table S4.
Figure 7
Figure 7. High resolution metabolic labeling can reliably detect RNA editing
(a) Method for detecting editing sites. We search for positions where the distribution of sequenced nucleotides is different in RNA-4sU-Seq (dark gray, top) and RNA-total-Seq (light gray, bottom) using maximum likelihood estimation (top row), and also require that other measures associated with base quality distribute evenly between the two samples (bottom row). (b) Distribution of predicted editing sites (% of sites, y-axis). Left: nucleotide changes in RNA-total (editing sites, nucleotide changes on x-axis; top: genomic base, middle: RNA-4sU base, bottom: RNA-total base), middle: nucleotide changes in RNA-4sU data (4sU induced base changes), right: distinct annotations associated with RNA-total nucleotide changes. Number of sites is marked. See also Table S3.

References

    1. Adiconis X, Borges-Rivera D, Satija R, DeLuca DS, Busby MA, Berlin AM, Sivachenko A, Thompson DA, Wysoker A, Fennell T, et al. Comparative analysis of RNA sequencing methods for degraded or low-input samples. Nature methods. 2013;10:623–629. - PMC - PubMed
    1. Amit I, Garber M, Chevrier N, Leite AP, Donner Y, Eisenhaure T, Guttman M, Grenier JK, Li W, Zuk O, et al. Unbiased reconstruction of a mammalian transcriptional network mediating pathogen responses. Science. 2009;326:257–263. - PMC - PubMed
    1. Audibert A, Weil D, Dautry F. In vivo kinetics of mRNA splicing and transport in mammalian cells. Molecular and cellular biology. 2002;22:6706–6718. - PMC - PubMed
    1. Brooks SA, Blackshear PJ. Tristetraprolin (TTP): interactions with mRNA and proteins, and current thoughts on mechanisms of action. Biochimica et biophysica acta. 2013;1829:666–679. - PMC - PubMed
    1. Cabili MN, Trapnell C, Goff L, Koziol M, Tazon-Vega B, Regev A, Rinn JL. Integrative annotation of human large intergenic noncoding RNAs reveals global properties and specific subclasses. Genes & development. 2011;25:1915–1927. - PMC - PubMed

Publication types

Associated data